
Motion Diagram Physics Guide: How to Draw and Read Motion Diagrams
Learn how to draw motion diagrams in physics, read dot spacing, velocity arrows, acceleration direction, and connect diagrams to graphs.
A motion diagram is one of the fastest ways to see how an object moves before you start using equations. Instead of showing only one position, it shows the object at equal time intervals. The spacing between dots tells you how the speed changes. Velocity arrows show direction and relative speed. Acceleration arrows show whether the velocity is changing.
This guide explains how to draw a motion diagram in physics, how to read dot spacing, how to place velocity and acceleration arrows, and how to connect a motion diagram to position-time and velocity-time graphs.
Motion Diagram Physics Maker
Create position-dot motion diagrams with velocity arrows, acceleration arrows, equal time intervals, and SVG, PNG, or CSV export.
Make a motion diagram ->Quick Answer: How Do You Draw a Motion Diagram?
To draw a motion diagram:
- Choose the object you are tracking.
- Represent the object as a dot or simple shape.
- Mark positions at equal time intervals.
- Keep dot spacing equal for constant speed.
- Increase dot spacing if the object is speeding up.
- Decrease dot spacing if the object is slowing down.
- Add velocity arrows in the direction of motion.
- Make longer velocity arrows where speed is greater.
- Add an acceleration arrow if velocity changes.
- Check that the diagram matches the written scenario, graph, or data table.
The key rule is simple: equal time intervals. If the time step changes, the dot spacing no longer tells a clean story about speed.
A motion diagram compresses a moving object into a sequence of equal-time snapshots.
What Is a Motion Diagram in Physics?
A motion diagram is a visual model of an object's position at repeated moments in time. It is often drawn as a row of dots. Each dot represents where the object was after the same time interval, such as every 0.5 seconds.
LibreTexts describes a motion diagram as similar to a multiple-exposure photograph: the object appears at equal time intervals, so spacing reveals how the motion changes. Khan Academy's motion diagram lesson uses the same idea for visual models of motion in AP Physics 1.
In a physics class, motion diagrams help students translate between four representations:
| Representation | What it emphasizes | How it relates to a motion diagram |
|---|---|---|
| Verbal description | The story of the motion | Gives the direction, changes in speed, and events |
| Motion diagram | Positions at equal time steps | Shows speed changes through dot spacing |
| Position-time graph | Position as a function of time | Slope connects to velocity |
| Velocity-time graph | Velocity as a function of time | Slope connects to acceleration |
A motion diagram is especially useful before equations because it forces you to ask: where is the object, which way is it moving, and is its velocity changing?
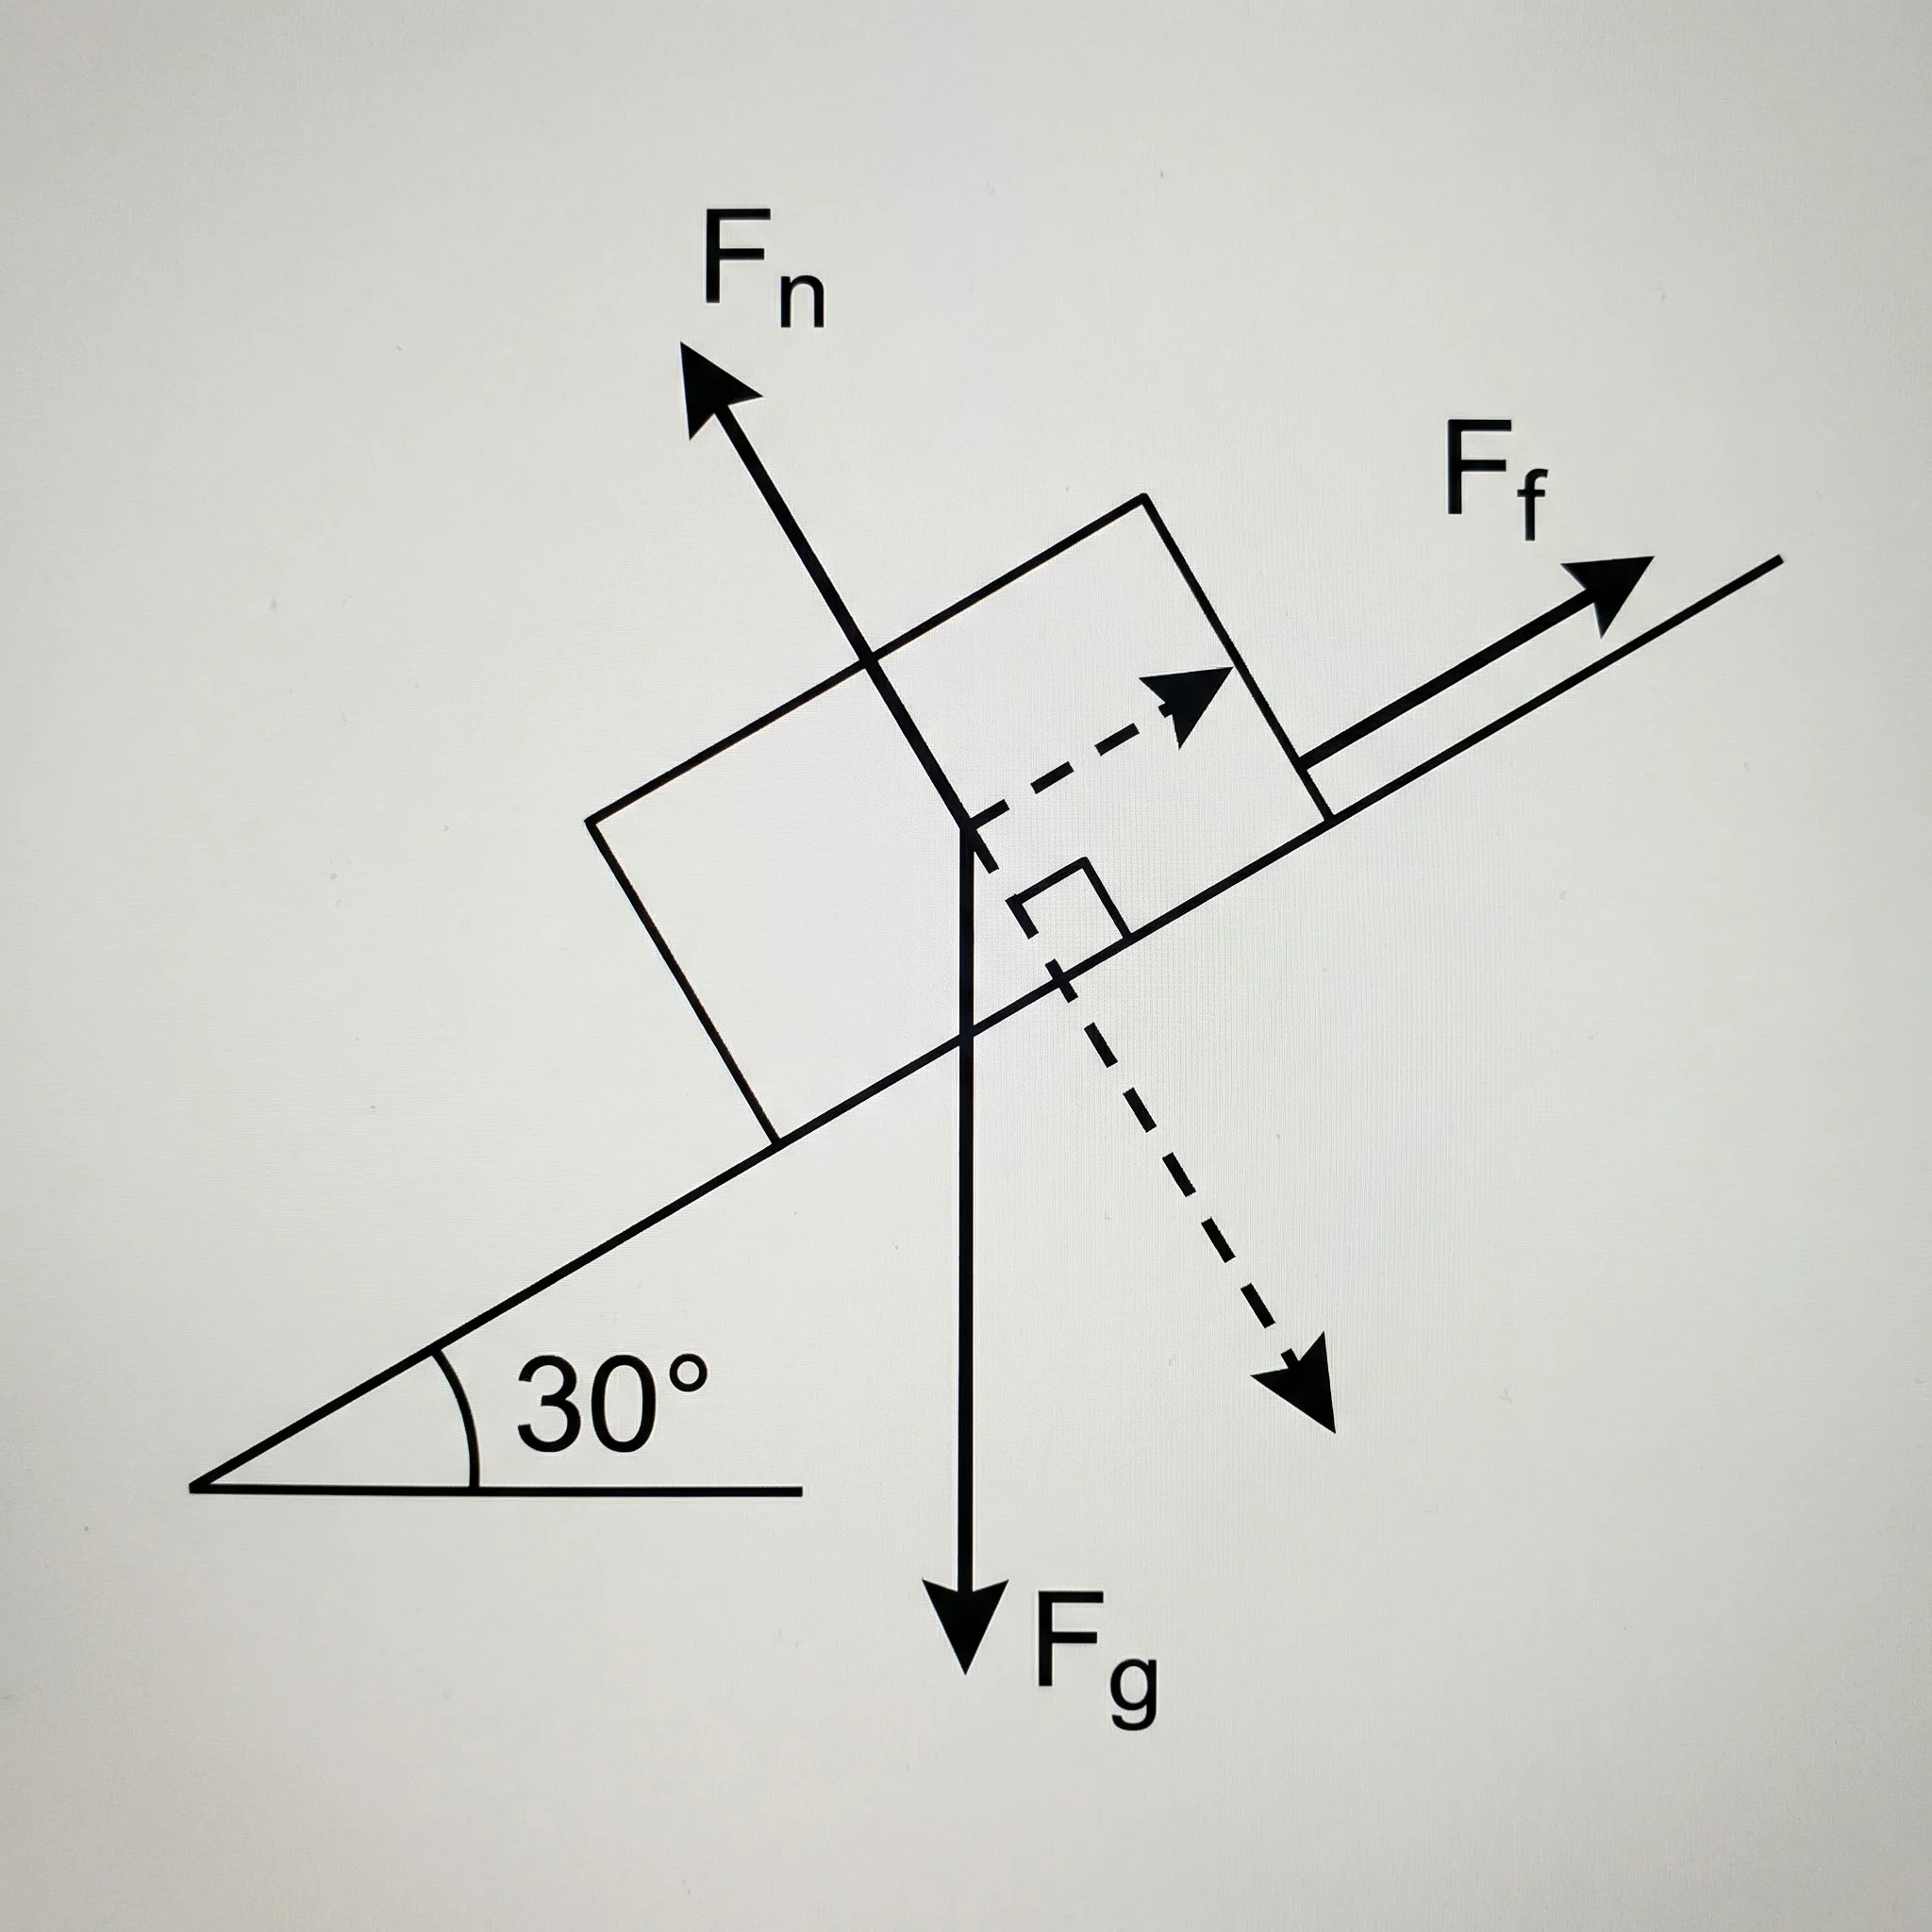
Motion Diagram vs Free Body Diagram
Students often mix up motion diagrams and free body diagrams because both use arrows. They answer different questions.
| Diagram type | Main question | Common symbols |
|---|---|---|
| Motion diagram | How is the object's position and velocity changing over time? | Position dots, velocity arrows, acceleration arrows |
| Free body diagram | What forces act on the object right now? | Force arrows such as weight, normal force, tension, friction |
| Vector diagram | How do vector quantities add or resolve? | Component arrows, resultant arrows, angles |
A motion diagram belongs to kinematics. It describes motion without first explaining the forces that caused it. A free body diagram belongs to dynamics. It describes forces so you can use Newton's laws.
For example, a sled slowing down on rough snow has a motion diagram with dots getting closer together while the sled still moves forward. Its free body diagram would show weight down, normal force up, and friction backward. The two diagrams are connected, but they are not the same diagram.
Free Body Diagram Generator
Create labeled force diagrams for blocks, pulleys, circular motion, friction, and other physics examples.
The Three Parts of a Good Motion Diagram
A clear motion diagram has three layers: position, velocity, and acceleration.
1. Position dots
Position dots are the backbone of the diagram. They should be placed at equal time intervals. If a cart is photographed every second, each dot is one second after the previous dot. If the cart moves the same distance each second, the dots are equally spaced.
2. Velocity arrows
Velocity arrows show direction and relative speed. The arrow points in the direction the object is moving. The arrow length should match the speed qualitatively:
- equal-length arrows for constant speed
- longer arrows as the object speeds up
- shorter arrows as the object slows down
- arrows changing direction if the object turns around
3. Acceleration arrows
Acceleration arrows show how velocity changes. If velocity is increasing to the right, acceleration points right. If an object moves right but slows down, acceleration points left. If velocity is constant, acceleration is zero, so many teachers omit the acceleration arrow.
That last point is the mistake students miss most often: acceleration does not always point in the direction of motion. It points in the direction the velocity is changing.
Constant Speed Motion Diagram
Constant speed is the easiest case. The object covers the same distance during every equal time interval, so the dots are evenly spaced. Velocity arrows all point in the same direction and have the same length. Acceleration is zero.
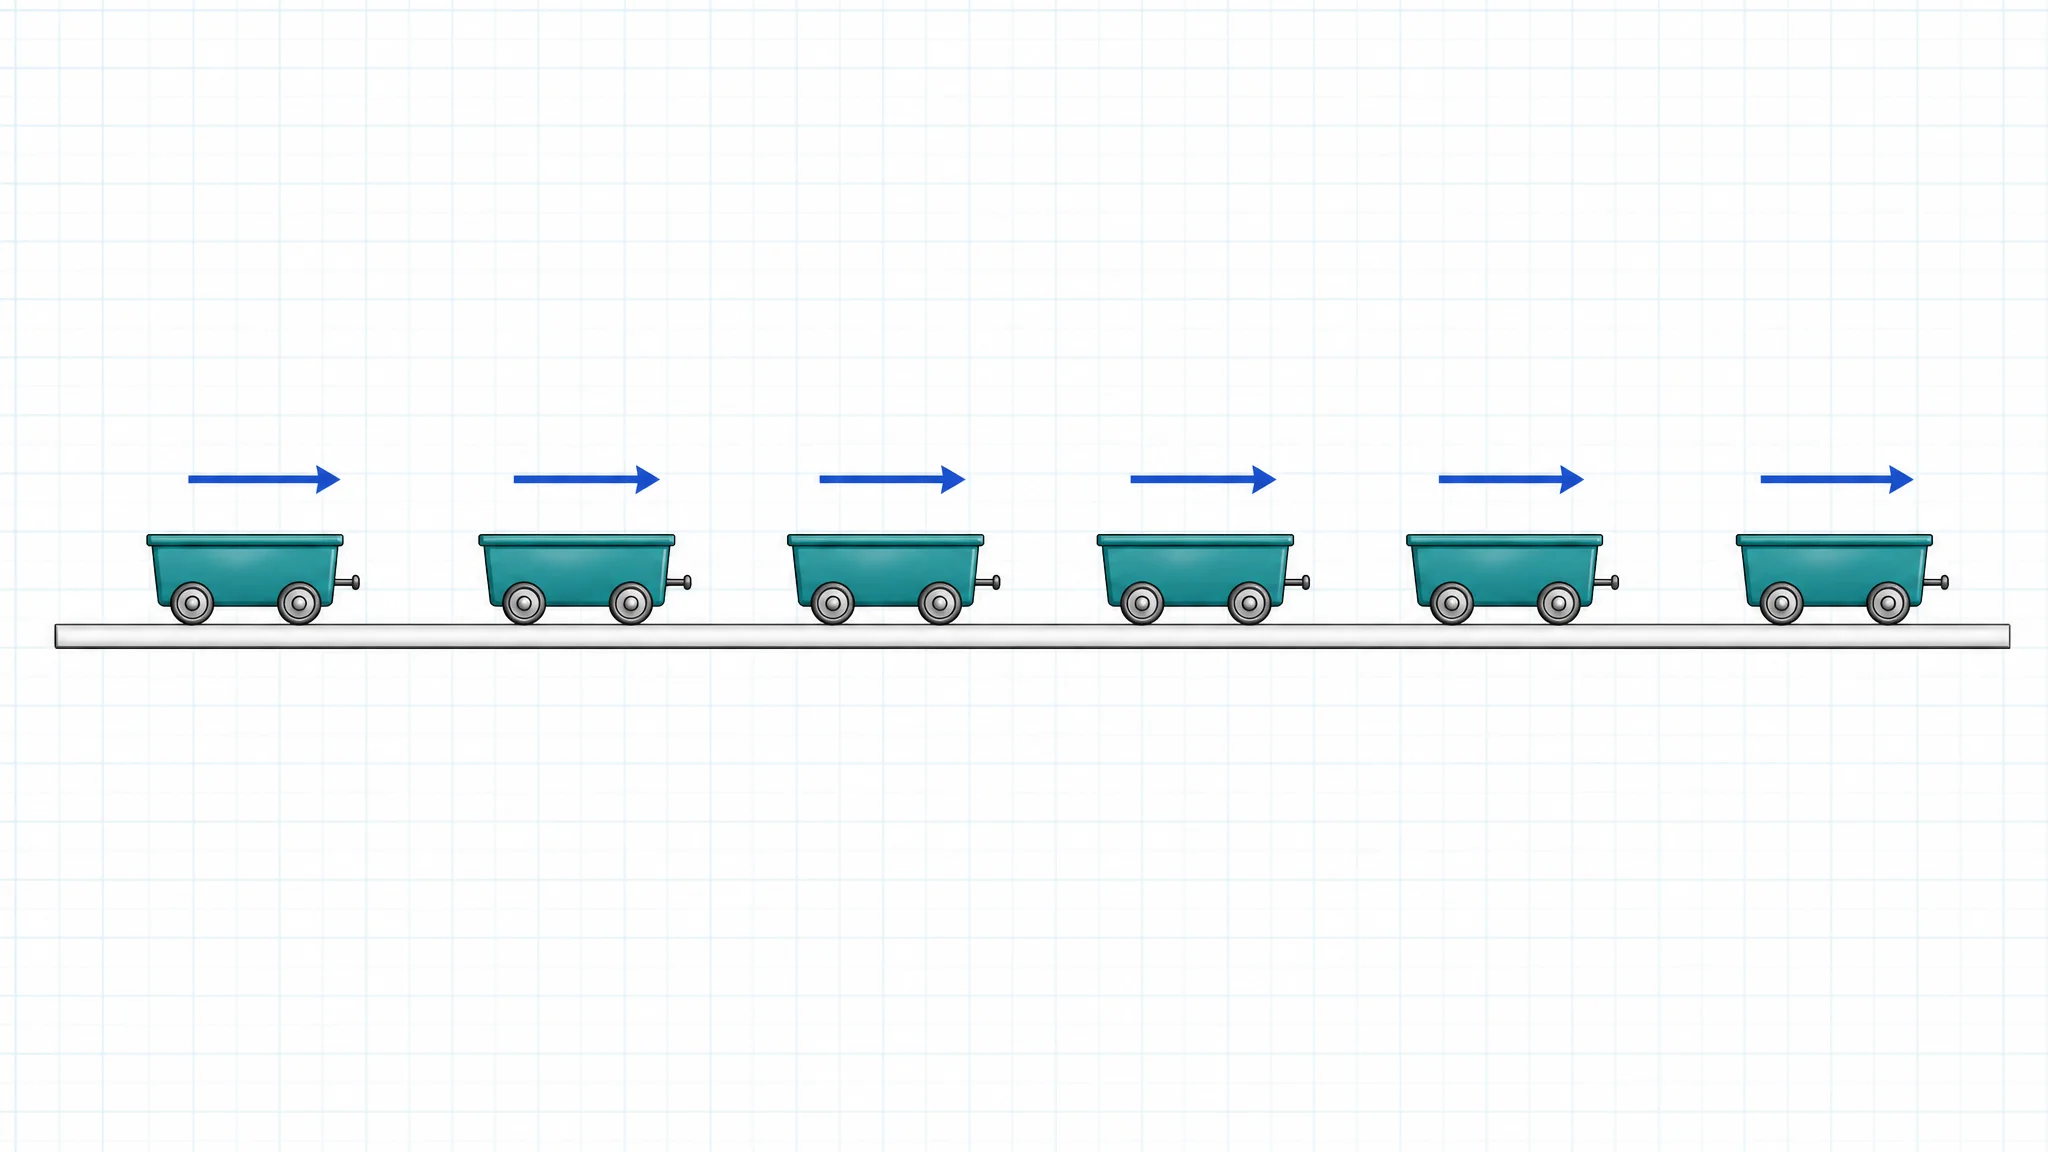
Equal spacing means equal distance traveled during each equal time interval.
Use this pattern when the prompt says:
- a car travels at a constant speed
- a puck slides with negligible friction
- a person walks steadily
- a cart moves with constant velocity
- the position-time graph is a straight line with constant slope
The important feature is not the exact number of dots. It is the relationship between neighboring dots. If every time step is the same and every position step is the same, speed is constant.
Speeding Up Motion Diagram
When an object speeds up, it covers more distance in each equal time interval. The dots spread farther apart as time goes on. Velocity arrows get longer. If the object is moving right and speeding up, acceleration points right.
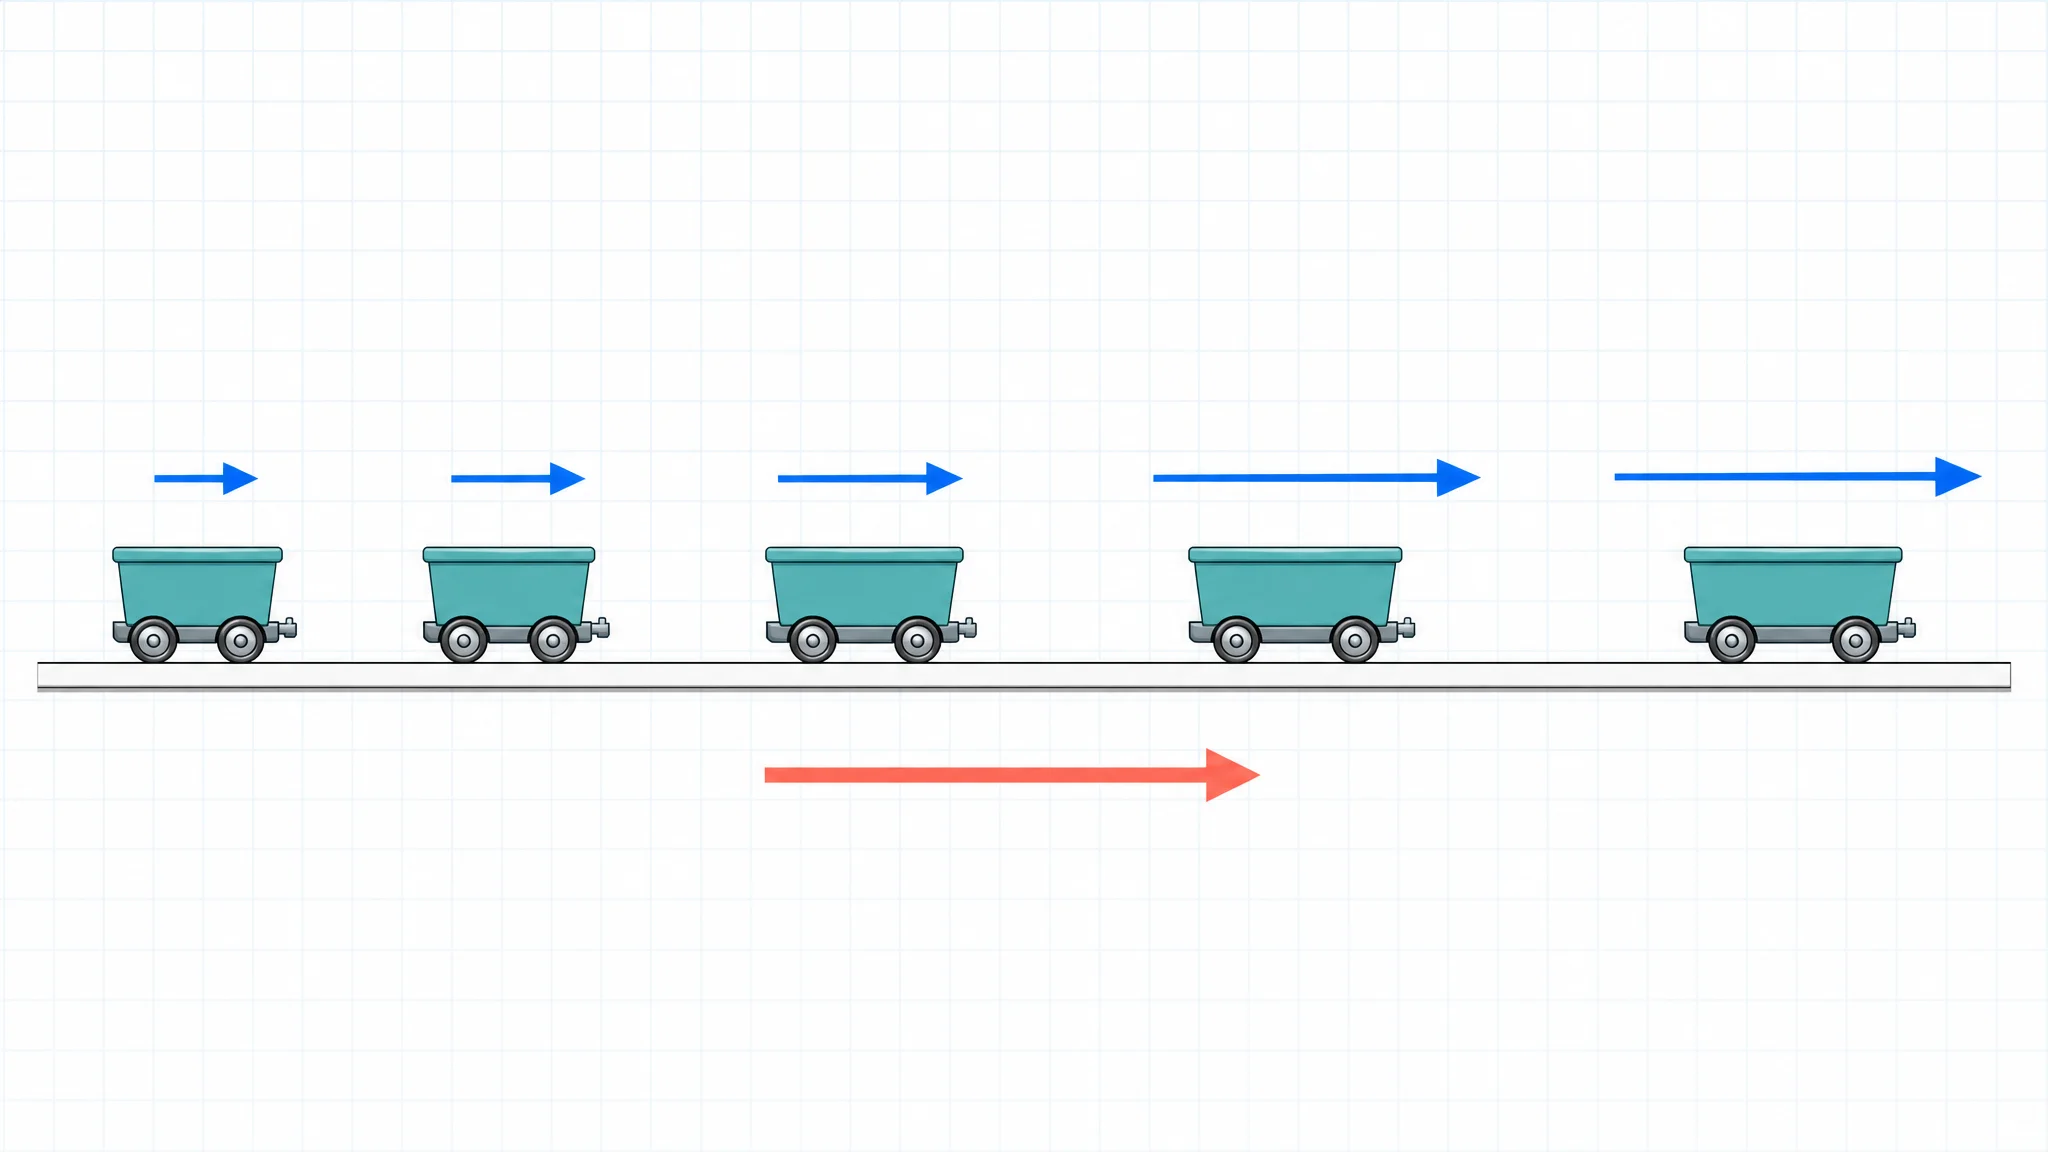
Dots spread out because the object covers more distance during each later time interval.
This pattern appears in many introductory physics examples:
| Scenario | Dot spacing | Velocity arrows | Acceleration |
|---|---|---|---|
| Cart released down a ramp | Increasing | Longer down the ramp | Down the ramp |
| Falling object before air resistance matters | Increasing vertically | Longer downward | Downward |
| Car leaving a stoplight | Increasing forward | Longer forward | Forward |
| Ball rolling down an incline | Increasing | Longer downhill | Downhill |
If you connect this diagram to graphs, the position-time graph curves upward for positive motion and positive acceleration. The velocity-time graph rises with time.
Slowing Down Motion Diagram
When an object slows down, it covers less distance in each equal time interval. The dots get closer together as time goes on. Velocity arrows still point in the direction of motion, but they get shorter. Acceleration points opposite the motion.
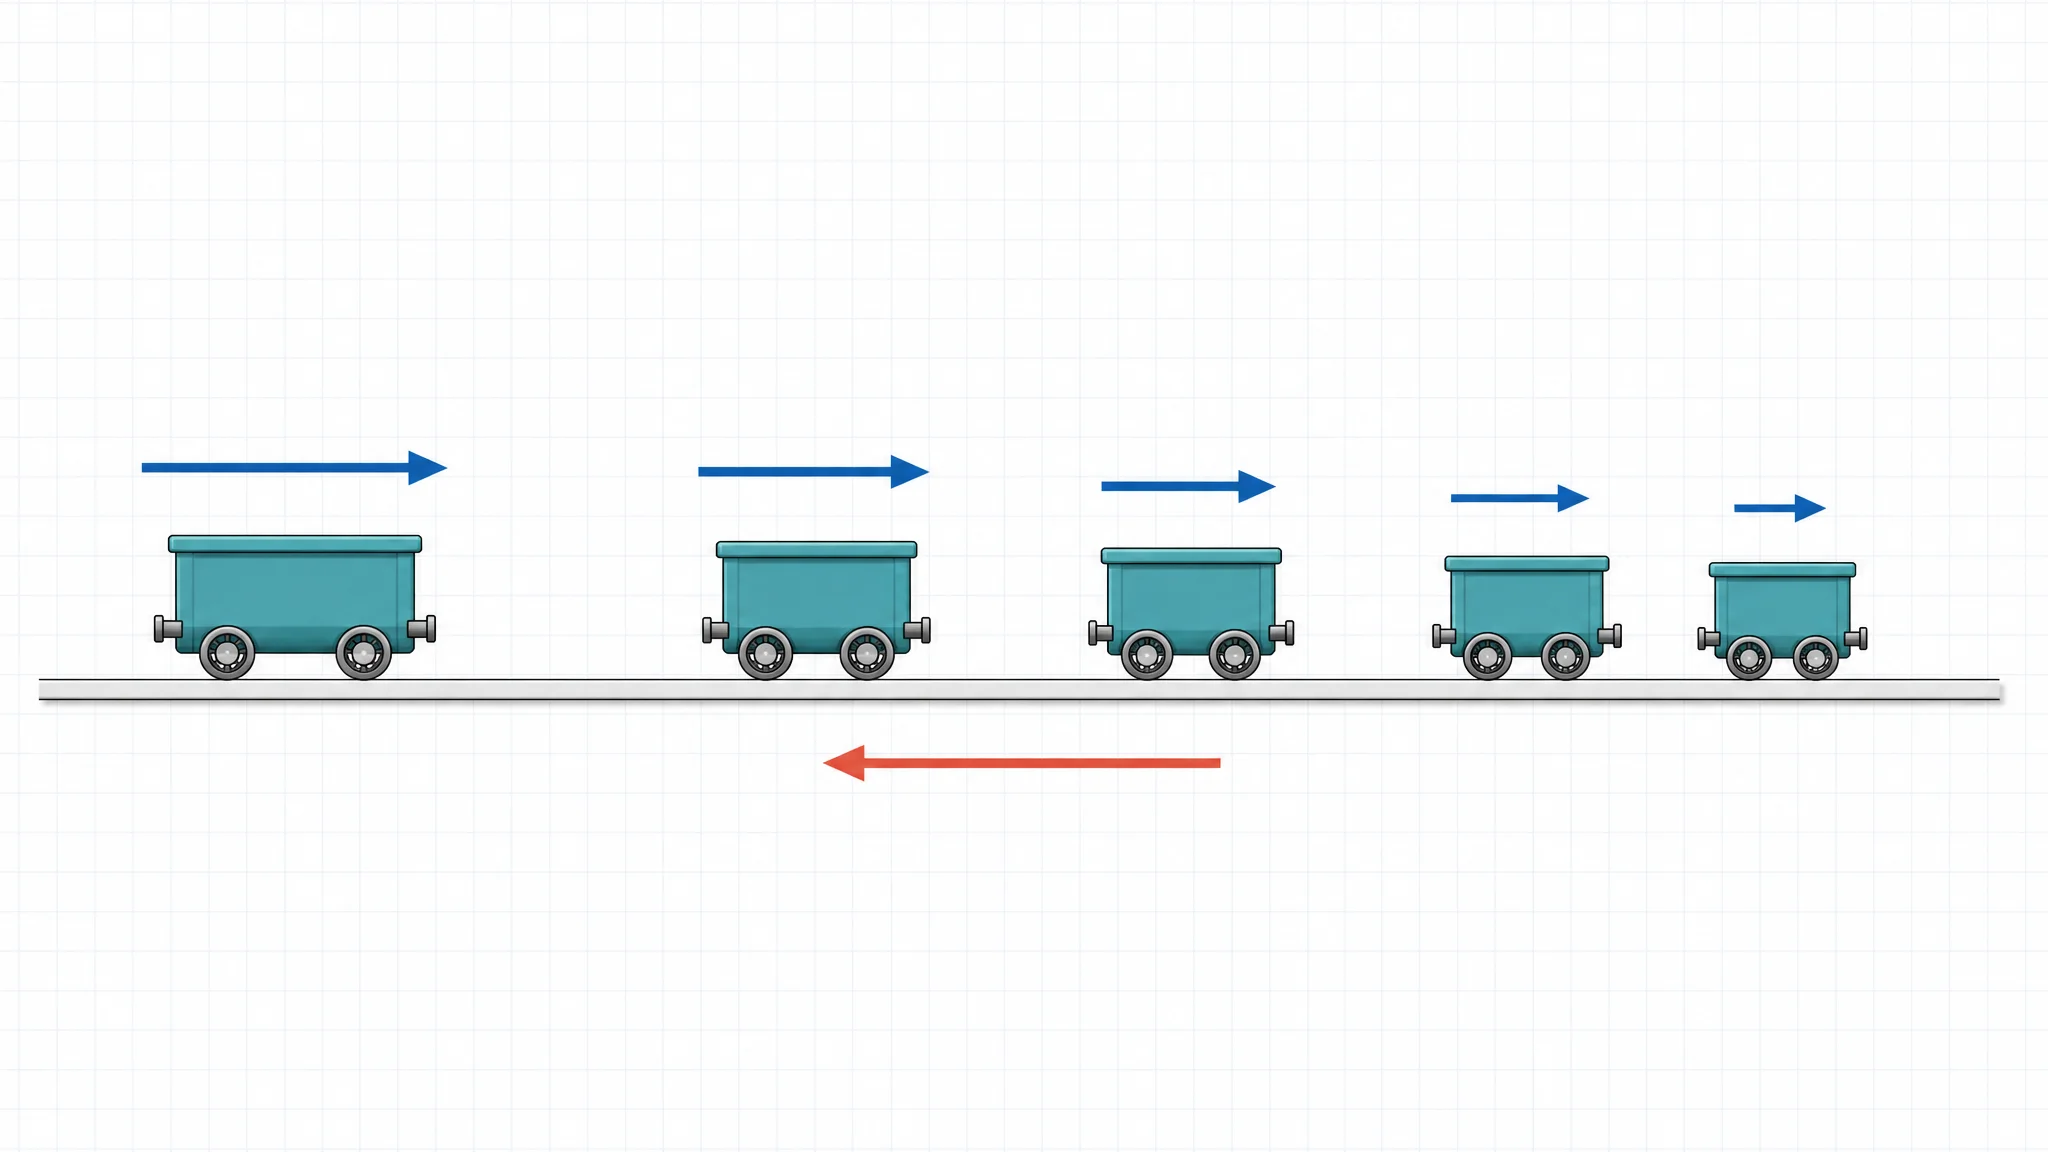
The object moves right, but acceleration points left because the rightward velocity is decreasing.
This is where motion diagrams become useful for reasoning. A car braking while moving right has positive velocity if right is chosen as positive. But its acceleration is negative because its velocity is becoming less positive.
Common slowing-down examples include:
- a car approaching a stop sign
- a ball rolling uphill
- a cart moving forward while friction slows it
- a thrown ball rising upward before it reaches the top
At the highest point of a vertical throw, the ball's velocity is momentarily zero, but its acceleration is still downward. A motion diagram helps separate "which way it is moving now" from "which way its velocity is changing."
How to Read Dot Spacing
Dot spacing is a qualitative speed indicator. It does not automatically give exact speed unless the diagram includes a scale and time interval. Still, it tells you the trend.
| Dot pattern | Motion meaning | Velocity meaning | Acceleration meaning |
|---|---|---|---|
| Equal spacing | Constant speed | Constant velocity if direction is unchanged | Zero acceleration |
| Spacing increases | Speeding up | Velocity magnitude increases | Acceleration in direction of motion |
| Spacing decreases | Slowing down | Velocity magnitude decreases | Acceleration opposite direction of motion |
| Spacing changes direction | Object turns around | Velocity changes sign | Acceleration depends on how velocity changes |
| One dot only | Not enough information | Cannot infer speed trend | Cannot infer acceleration |
The phrase "equal time intervals" should always be visible in your reasoning. Wide spacing means high speed only because the time between positions is the same.
How to Add Velocity Arrows
Velocity is a vector, so it has both direction and magnitude. In a motion diagram:
- Put each velocity arrow near the dot or between neighboring dots, depending on your class convention.
- Point the arrow in the direction the object is moving at that moment.
- Make the arrow longer when the object is moving faster.
- Keep arrow lengths equal for constant speed.
- Reverse arrow direction after a turnaround.
If you are drawing a qualitative diagram, you do not need exact arrow lengths. They only need to communicate relative speed. If the final dot spacing is about twice the first dot spacing, the final velocity arrow should be noticeably longer than the first.
Western Kentucky University's motion diagram teaching page gives a practical classroom sequence: mark positions at equal intermediate times, add velocity vectors, then add acceleration if speed changes.
How to Add Acceleration Arrows
Acceleration describes the change in velocity over time:
acceleration = change in velocity / change in timeIn a simple one-dimensional motion diagram, acceleration can point:
- right, if rightward velocity is increasing
- left, if rightward velocity is decreasing
- left, if leftward velocity is increasing in magnitude
- right, if leftward velocity is decreasing in magnitude
- nowhere, if velocity is constant
Use this shortcut: compare two nearby velocity arrows. The acceleration points from the earlier velocity to the later velocity in velocity space. In everyday language, it points toward the change, not necessarily toward the travel direction.
Drawing from a Word Problem
Suppose the prompt says:
A cart starts from rest and rolls down a straight track to the right, speeding up at a constant rate.
Build the motion diagram in this order:
- Draw a straight horizontal path.
- Place the first dot at the starting position.
- Add later dots increasingly farther apart to the right.
- Draw small velocity arrows near early dots and longer arrows near later dots.
- Draw one acceleration arrow to the right.
- Label the time order if the diagram could be confusing.
Do not start with equations. A motion diagram is most valuable before the algebra because it gives the sign and shape of the motion.
Drawing from a Position-Time Graph
A position-time graph can be translated into a motion diagram by reading slope.
| Position-time graph feature | Motion diagram feature |
|---|---|
| Straight line with positive slope | Equal spacing to the right |
| Straight line with negative slope | Equal spacing to the left |
| Horizontal line | Dots stacked at the same position |
| Curve getting steeper upward | Dots spread farther apart to the right |
| Curve flattening while moving right | Dots get closer together to the right |
| Peak or turn in the graph | Motion diagram changes direction |
The slope of a position-time graph is velocity. Steeper slope means greater speed. A flat slope means the object is not changing position.
Drawing from a Velocity-Time Graph
A velocity-time graph can also become a motion diagram, but the logic is slightly different. Velocity tells you how much position changes during each time interval.
| Velocity-time graph feature | Motion diagram feature |
|---|---|
| Constant positive velocity | Equal spacing to the right |
| Constant negative velocity | Equal spacing to the left |
| Velocity increasing above zero | Increasing spacing to the right |
| Velocity decreasing but still positive | Decreasing spacing to the right |
| Velocity crosses zero | Dots stop spreading one way and begin moving back |
| Zero velocity for a time interval | Repeated dots at the same position |
The slope of a velocity-time graph is acceleration. If the velocity graph is rising, acceleration is positive. If it is falling, acceleration is negative.
Common Mistakes
Mistake 1: Unequal time intervals
If you put dots wherever they "look good," the diagram loses meaning. Always decide the time interval first.
Mistake 2: Making acceleration point with motion
Acceleration points with motion only when speed is increasing in that direction. A braking car moving right has rightward velocity and leftward acceleration.
Mistake 3: Treating dot size as speed
The dot represents the object. Dot size is not speed. Spacing and velocity arrows communicate speed.
Mistake 4: Mixing force arrows into the motion diagram
Do not draw weight, normal force, tension, and friction arrows on a motion diagram unless the assignment specifically asks for a combined diagram. Use a free body diagram for forces.
Mistake 5: Forgetting direction after a turnaround
If an object turns around, velocity arrows must reverse direction. Position dots should first approach the turnaround point, then move back the other way.
Classroom and Homework Uses
Motion diagrams are useful for students and teachers because they reveal misconceptions quickly.
Teachers can use them to:
- introduce kinematics before formulas
- compare constant velocity and constant acceleration
- diagnose whether students understand acceleration direction
- connect lab data from ticker tape or video analysis to graphs
- create quick checks before solving numerical problems
Students can use them to:
- decide the sign of velocity and acceleration
- sketch a situation before choosing equations
- explain why a velocity-time graph rises or falls
- check whether a numerical answer makes physical sense
If you are building classroom materials, pair a motion diagram with a short prompt, a graph translation task, and a question asking students to identify velocity and acceleration signs.

AI Worksheet Generator
Generate printable physics worksheets with structured questions, worked examples, and answer keys.
Motion Diagram Checklist
Use this checklist before submitting a physics motion diagram:
| Check | Question |
|---|---|
| Equal time | Are all dots separated by the same time interval? |
| Direction | Do the dots move in the correct direction over time? |
| Speed | Does dot spacing show constant speed, speeding up, or slowing down? |
| Velocity | Do velocity arrows point in the direction of motion? |
| Arrow length | Do velocity arrows match relative speed? |
| Acceleration | Does acceleration point in the direction velocity changes? |
| Labels | Is the time order clear? |
| Separation | Are force arrows kept out of the motion diagram? |
When in doubt, explain the diagram in one sentence: "The object moves right, speeds up, and accelerates right," or "The object moves right, slows down, and accelerates left." If that sentence does not match the dots and arrows, revise the diagram.
FAQ
What does a motion diagram show in physics?
A motion diagram shows an object position at equal time intervals. Dot spacing shows relative speed, velocity arrows show direction and speed, and acceleration arrows show how velocity changes.
How do you know if an object is speeding up from a motion diagram?
If the dots get farther apart over equal time intervals, the object is speeding up. Velocity arrows should also become longer in the direction of motion.
How do you know if an object is slowing down?
If the dots get closer together over equal time intervals, the object is slowing down. Velocity arrows still point in the direction of motion, but they become shorter.
Can acceleration point opposite the motion?
Yes. If an object moves right but slows down, its velocity points right while acceleration points left. Acceleration points in the direction the velocity is changing.
Is a motion diagram the same as a free body diagram?
No. A motion diagram shows how position and velocity change over time. A free body diagram shows the forces acting on an object at a particular moment.
How many dots should a motion diagram have?
Most classroom motion diagrams use five to seven dots, but the exact number is less important than showing equal time intervals and the correct spacing trend.
Do motion diagrams need exact measurements?
Not always. Many motion diagrams are qualitative. Exact measurements are needed only if the problem gives a scale, time interval, or asks for numerical speed or acceleration.
How does a motion diagram connect to graphs?
Dot spacing connects to velocity. A position-time graph slope gives velocity, and a velocity-time graph slope gives acceleration. Motion diagrams help translate those graph features into a visual story.
Create Physics Diagrams Faster
For a homework explanation, lab handout, or classroom slide, a clean motion diagram is usually more useful than a decorative picture. Keep the dots at equal time intervals, make velocity arrows consistent, and separate kinematics diagrams from force diagrams.
If you need a polished physics visual for class materials, use the Motion Diagram Physics Maker for position dots and velocity arrows, the Free Body Diagram Generator for force diagrams, and the AI Worksheet Generator for printable practice built around your own scenario.
Related Guides
- Ray Diagram: Lenses and Mirrors Explained — another core physics diagram, this one tracing light rays through lenses and mirrors.
分类
更多文章

Okabe-Ito Palette Hex Codes for Python, R & CSS
Copy all 8 Okabe-Ito palette hex codes with RGB values and ready-to-use Python, R, MATLAB and CSS snippets for colorblind-safe scientific figures.
")
How to Make a Histogram in Excel: Step-by-Step Guide (2026)
Learn how to create a histogram in Excel with the built-in Histogram chart, bin controls, and formatting tips. Includes Excel 365, 2024, 2021, 2019, and 2016 guidance.

What Is a Particulate Diagram? Particle Models Explained
A particulate diagram shows matter as individual particles. Learn how particle diagrams represent solids, liquids, gases, elements, compounds, and mixtures, with examples.