")
Block Diagrams Explained: How to Create One with Examples (2026 Guide)
Learn what block diagrams are and how to create them step by step. Covers system block diagrams, functional block diagrams, and process block diagrams with real examples.
Block diagrams are one of the most widely used visual tools in engineering, system design, and technical documentation. They represent complex systems as a collection of interconnected blocks, where each block stands for a distinct function, component, or subsystem. Unlike detailed schematics that show every wire and component value, block diagrams operate at a higher level of abstraction -- making them ideal for communicating the overall architecture and signal flow of a system without overwhelming the audience with low-level detail.
Engineers, architects, project managers, and educators all rely on block diagrams to plan, explain, and troubleshoot systems ranging from control systems and embedded electronics to software architectures and manufacturing processes. Whether you are documenting a feedback control loop for a university assignment or mapping out the subsystems of a satellite communication system, understanding how to create clear, effective block diagrams is a foundational skill.
Block Diagram Generator
Create professional block diagrams instantly with AI. Describe your system and get a clean, labeled block diagram.
Try it free →What Is a Block Diagram?
A block diagram is a graphical representation of a system that uses rectangular blocks to represent components or functions and directed arrows to show the relationships and signal flow between them. Each block is labeled with the name or transfer function of the component it represents, and the arrows indicate the direction in which signals, data, materials, or energy travel through the system.
Block diagrams deliberately omit internal details. A block labeled "Amplifier" does not show the transistors, resistors, or capacitors inside it -- only that the amplifier exists as a functional unit and how it connects to the rest of the system. This abstraction is what makes block diagrams so versatile. The same notation can describe an electronic circuit, a software pipeline, a business process, or a mechanical assembly line.
Three Main Types
Block diagrams come in several flavors depending on the domain and purpose:
- System block diagram: Shows the top-level architecture of an entire system, breaking it into major subsystems. Common in electrical engineering, telecommunications, and computer engineering.
- Functional block diagram: Focuses on the functions performed by each block rather than the physical components. Used heavily in control theory, systems engineering, and reliability analysis.
- Process block diagram: Represents a sequence of processing steps, where the output of one block feeds into the next. Widely used in chemical engineering, manufacturing, and signal processing.
Despite these distinctions, the underlying visual language is the same: blocks, arrows, and labels. The differences lie in what each block represents and how the arrows are interpreted.
Key Components of Block Diagrams
Every block diagram is built from a small set of visual elements. Understanding these components is essential before you start drawing.
1. Blocks (Rectangles)
The primary element. Each block represents a component, function, subsystem, or processing step. Blocks are drawn as rectangles and labeled with a descriptive name or a mathematical transfer function (such as G(s) in control systems).
2. Arrows (Connectors)
Directed lines that show the flow of signals, data, materials, or control between blocks. The arrowhead indicates the direction of flow. In most conventions, signals flow from left to right, though feedback loops may flow right to left.
3. Labels
Text annotations on blocks and arrows that clarify what each element represents. Block labels describe the function ("Filter," "ADC," "Motor Driver"), while arrow labels describe the signal or data being transmitted ("Input Voltage," "Error Signal," "Sensor Data").
4. Summing Points
Circles with a cross or plus/minus signs inside, used primarily in control system block diagrams. A summing point combines two or more signals -- typically by adding or subtracting them. For example, the error signal in a feedback control loop is calculated at a summing point where the reference input and the feedback signal meet.
5. Branch Points (Takeoff Points)
Points where a single signal splits into two or more paths. Represented as a dot on a line. The signal is duplicated -- not divided -- so each branch carries the same signal.
6. Input and Output Terminals
The starting and ending points of the system. The input terminal is where the external signal enters the system, and the output terminal is where the final result exits. These are typically shown as arrows entering or leaving the overall diagram boundary.
Types of Block Diagrams
System Block Diagram
A system block diagram gives a bird's-eye view of an entire system. Each block represents a major subsystem, and the arrows show how subsystems communicate. For example, a block diagram of a home automation system might include blocks for "Sensor Network," "Central Controller," "Cloud Server," "User Interface," and "Actuators."
System block diagrams are the starting point for most engineering projects. They help teams agree on the overall architecture before diving into detailed design.
Functional Block Diagram
Functional block diagrams emphasize what each block does rather than what it physically is. In control engineering, a functional block diagram might show "Plant," "Controller," "Sensor," and "Actuator" -- each with a transfer function that describes its input-output behavior mathematically.
Functional block diagrams are also a standard deliverable in systems engineering frameworks such as MIL-STD-882 and NASA systems engineering processes, where they are used for functional decomposition and hazard analysis.
Hardware Block Diagram
Hardware block diagrams show the physical components of a system and how they are interconnected. A hardware block diagram for an embedded system might include blocks for "Microcontroller," "RAM," "Flash Memory," "Power Supply," "Communication Module," and "I/O Peripherals."
This type of diagram is especially common in PCB design and data sheets, where engineers need to understand the high-level hardware topology before examining detailed schematics.
Process Flow Block Diagram
A process flow block diagram shows a sequence of operations or processing stages. In chemical engineering, this might represent the stages of refining crude oil. In signal processing, it might show the steps of digitizing, filtering, and compressing an audio signal.
Process block diagrams often flow strictly from left to right (or top to bottom) without feedback loops, though some processes include recycling or recirculation paths.
How to Create a Block Diagram: Step-by-Step
Creating an effective block diagram is a structured process. Follow these six steps to go from a blank canvas to a clear, professional diagram.
Step 1: Define the Purpose and Scope
Before drawing anything, answer these questions:
- What system are you diagramming? A control loop? A software architecture? A manufacturing process?
- Who is the audience? Fellow engineers need more technical detail; managers need a higher-level overview.
- What level of abstraction is appropriate? A single block labeled "Computer" is fine for a network overview but useless for a hardware design review.
Write a one-sentence purpose statement. For example: "This block diagram shows the signal path from microphone input to speaker output in a public address system."
Step 2: Identify the Components
List every component, function, or subsystem that belongs in the diagram. Start by brainstorming freely, then group related items. For a power supply system, your list might include:
- AC input
- Transformer
- Rectifier
- Filter
- Voltage regulator
- DC output
- Feedback network
Do not worry about arrangement yet -- just capture the complete set of blocks.
Step 3: Determine Relationships and Signal Flow
For each pair of blocks, ask: does a signal, material, or control flow pass between them? If so, in which direction?
Draw a rough adjacency list or table:
| From | To | Signal |
|---|---|---|
| AC Input | Transformer | AC mains voltage |
| Transformer | Rectifier | Stepped-down AC |
| Rectifier | Filter | Pulsating DC |
| Filter | Voltage Regulator | Filtered DC |
| Voltage Regulator | DC Output | Regulated DC |
| DC Output | Feedback Network | Output voltage sample |
| Feedback Network | Voltage Regulator | Error signal |
Step 4: Arrange the Layout
Place blocks so that the primary signal flows from left to right (or top to bottom). Keep these layout principles in mind:
- Minimize crossing arrows. Rearrange blocks to reduce visual clutter.
- Align blocks on a grid. Consistent spacing looks professional and aids readability.
- Place feedback loops below the forward path. This is the standard convention in control systems.
- Group related blocks. Use dashed boxes or shading to indicate subsystems within the larger system.
Step 5: Add Labels and Annotations
Label every block and every arrow. A block without a label is meaningless, and an unlabeled arrow forces the reader to guess what signal it carries. Additionally:
- Use consistent naming conventions. If one block says "ADC," don't label another "Analog to Digital Converter."
- Add units where relevant (e.g., "5 V DC," "48 kHz sample rate").
- Include a title and, if needed, a legend explaining any symbols or color codes.
Step 6: Review and Iterate
Check your diagram against these criteria:
- Completeness: Are all components and connections represented?
- Accuracy: Do the arrows correctly reflect the actual signal flow?
- Clarity: Can someone unfamiliar with the system understand the high-level architecture?
- Consistency: Are fonts, block sizes, and arrow styles uniform throughout?
Have a colleague review the diagram. Fresh eyes often catch missing connections or ambiguous labels.
Block Diagram Examples
Example 1: Control System with Feedback
A classic feedback control system consists of four main blocks arranged in a loop:
- Reference Input (R) enters a summing point
- Controller (G_c) processes the error signal
- Plant (G_p) is the system being controlled
- Sensor (H) measures the output and feeds it back to the summing point
The error signal is calculated as E = R - H(Y), where Y is the plant output. This structure is the foundation of PID controllers, cruise control systems, and temperature regulators.
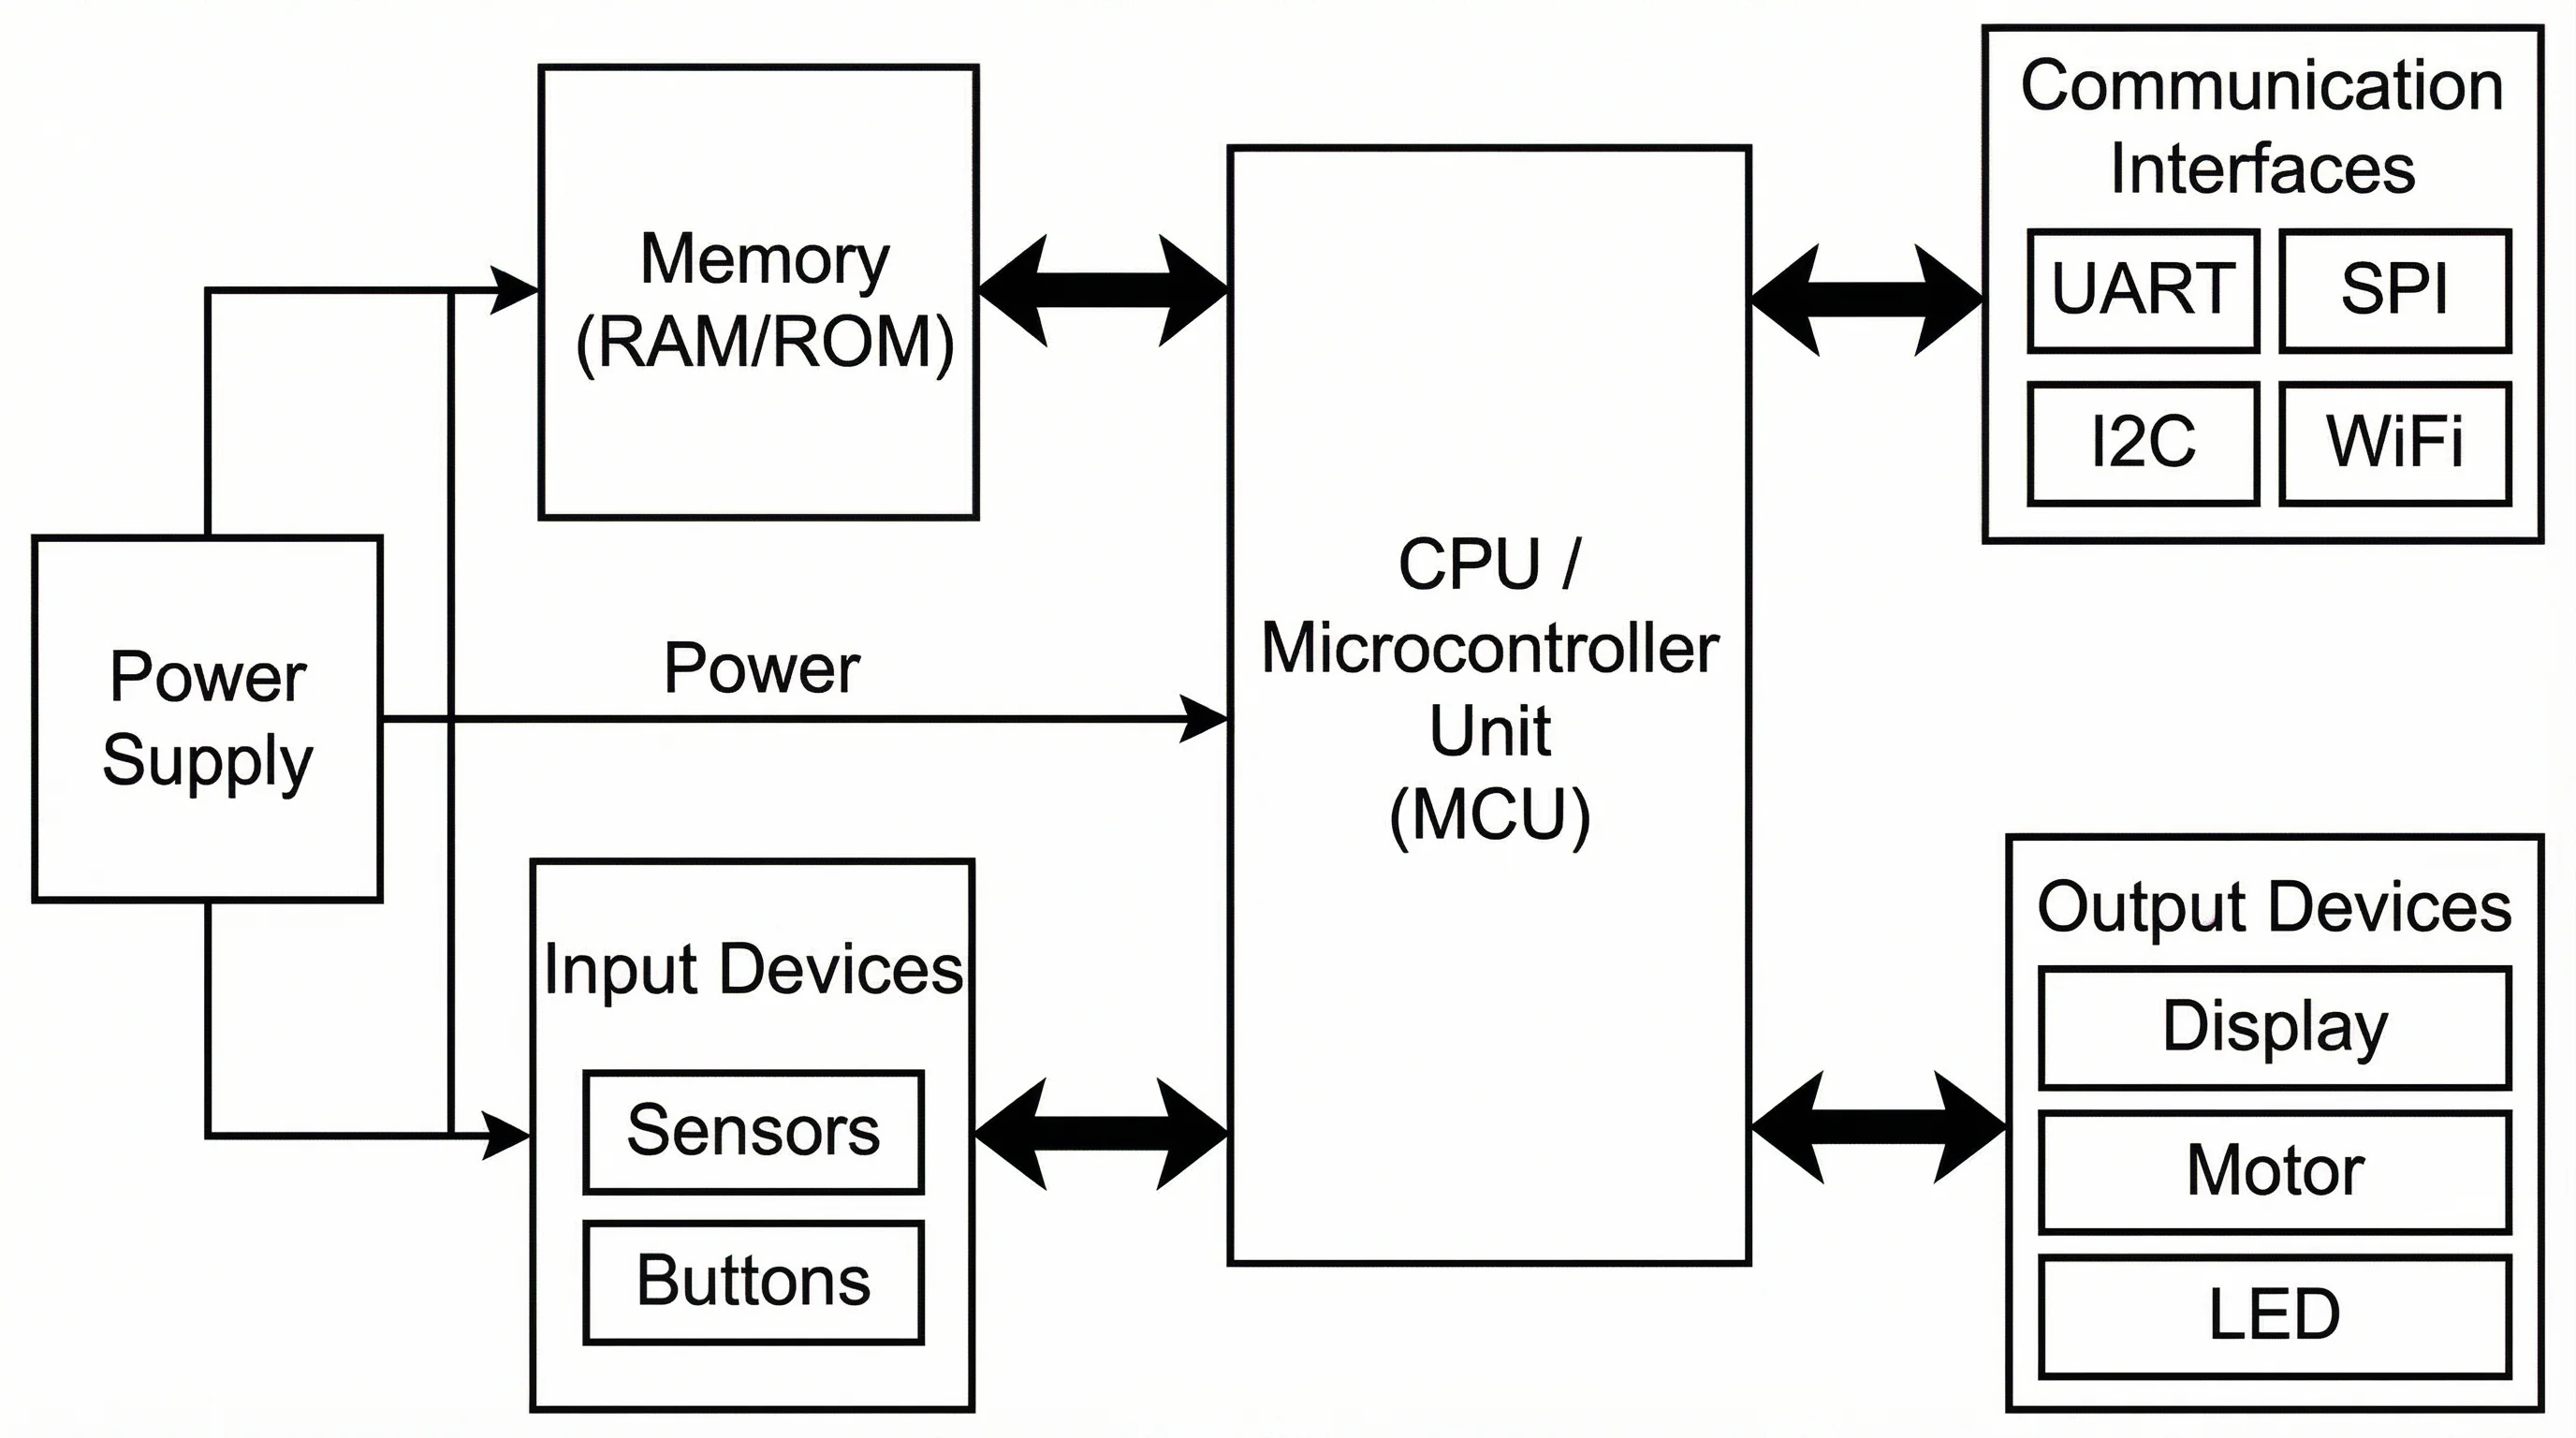
Example 2: Embedded System Architecture
An embedded system block diagram typically includes:
- Power Supply providing regulated voltage to all blocks
- Microcontroller/MCU as the central processing block
- Memory (RAM and Flash) connected to the MCU
- Communication Interfaces (UART, SPI, I2C, Ethernet) linking to external devices
- Sensors feeding data into the MCU
- Actuators receiving control signals from the MCU
The diagram shows the MCU at the center with bidirectional arrows to memory and communication blocks, input arrows from sensors, and output arrows to actuators.
Example 3: Power Supply System
A linear regulated power supply block diagram flows left to right:
AC Mains → Transformer → Bridge Rectifier → Smoothing Filter → Voltage Regulator → DC Output
A feedback path runs from the output back to the voltage regulator, carrying a sample of the output voltage for regulation. This example clearly shows how block diagrams simplify a circuit that might contain dozens of physical components into six functional blocks.
Example 4: Communication System
A basic communication system block diagram includes:
Information Source → Transmitter → Channel → Receiver → Destination
With a Noise Source feeding into the channel block via a summing point. This is the Shannon-Weaver model, and it can be expanded with sub-blocks for encoding, modulation, demodulation, and decoding.
Block Diagram Best Practices
Follow these guidelines to produce block diagrams that are both professional and easy to understand.
1. Keep It Simple
Resist the temptation to show every sub-component. If a block can be understood as a single unit by your target audience, leave it as one block. You can always create a separate, more detailed diagram for any block that needs further decomposition.
2. Use Consistent Block Sizes
All blocks at the same level of hierarchy should be the same size. Varying block sizes suggests varying importance, which can mislead the reader unless that is your explicit intention.
3. Flow Left to Right
The primary signal path should flow from left to right, matching the natural reading direction in Western languages. Feedback and return paths flow right to left, typically below the forward path.
4. Label Everything
Never leave a block or arrow unlabeled. Even if the meaning seems obvious to you, your diagram may be read by someone with a different background. Clear labels eliminate ambiguity.
5. Use Color Sparingly
Color can distinguish subsystem boundaries, signal types (analog vs. digital), or critical paths. But using too many colors creates visual noise. Stick to two or three colors and define them in a legend.
6. Include a Title and Context
Every diagram should have a title that describes the system and, ideally, a brief annotation explaining the scope and any assumptions. A diagram labeled "Power Supply Block Diagram -- 5V/3A Output, Linear Regulated" is far more useful than one labeled simply "Block Diagram."
Block Diagrams vs Other Diagram Types
Understanding how block diagrams compare to other common diagram types helps you choose the right visualization for your needs.
| Feature | Block Diagram | Flowchart | Circuit Diagram | Architecture Diagram |
|---|---|---|---|---|
| Abstraction level | High | Medium-High | Low (detailed) | High |
| Shows signal flow | Yes | No (shows decision logic) | Yes (current flow) | Sometimes |
| Uses standard symbols | Rectangles + arrows | Diamonds, ovals, rectangles | IEEE/IEC component symbols | Varies by framework |
| Best for | System architecture, control systems | Processes, algorithms, workflows | Electronic circuits | Software systems, infrastructure |
| Includes feedback loops | Often | Rarely | Implicitly | Sometimes |
Block Diagram vs Flowchart
Flowcharts emphasize decision logic -- they use diamond-shaped decision nodes and show branching paths based on yes/no or true/false conditions. Block diagrams emphasize signal flow and functional relationships between components. If your goal is to show how data or signals move through a system, use a block diagram. If your goal is to document a step-by-step process with conditional branches, use a flowchart.
Block Diagram vs Circuit Diagram
Circuit diagrams (schematics) show the exact electrical components and their connections -- every resistor, capacitor, and transistor. Block diagrams abstract these details away, showing only functional units. In practice, engineers often start with a block diagram to define the system architecture and then create detailed circuit diagrams for each block. For more on related diagrams, see our guide on data flow diagrams, which share similar principles of showing information movement through a system.
Block Diagram vs Architecture Diagram
Software architecture diagrams (such as UML component diagrams or C4 models) serve a similar purpose to block diagrams but follow domain-specific conventions. Architecture diagrams may include layers, interfaces, and deployment nodes that are not part of traditional block diagram notation. If you are working in software, architecture diagrams may be more appropriate. For a broader comparison of diagramming tools that support both types, check out our guide to free diagram software.
Frequently Asked Questions
What is the purpose of a block diagram?
The purpose of a block diagram is to provide a simplified, high-level visual representation of a system. It shows the major components (or functions) and the relationships between them without getting into internal details. Block diagrams help engineers, students, and stakeholders understand system architecture, identify signal paths, communicate design intent, and troubleshoot problems by isolating which block in the chain is responsible for unexpected behavior.
What is the difference between a block diagram and a flowchart?
A block diagram shows functional components and signal flow within a system. Each block represents a subsystem or component, and arrows indicate how signals or data pass between them. A flowchart shows procedural steps and decision logic. It uses diamond shapes for decisions and follows a start-to-end path through a process. Block diagrams answer "what are the parts and how do they connect?" Flowcharts answer "what are the steps and what happens at each decision point?"
What are the basic rules for drawing block diagrams?
The fundamental rules are: (1) every component or function gets its own labeled block; (2) arrows indicate the direction of signal or data flow; (3) the primary signal path flows left to right; (4) feedback paths flow right to left, typically below the forward path; (5) summing points use a circle with plus/minus signs; (6) branch points (takeoff points) are marked with a dot; and (7) every block and every arrow should be labeled.
Who uses block diagrams?
Block diagrams are used across many disciplines. Electrical engineers use them for circuit and system design. Control engineers use them to model feedback systems. Computer engineers use them for hardware architecture. Software engineers use them for system-level design. Chemical and process engineers use them for plant and process design. Students at all levels use them in coursework. Technical writers use them in documentation and manuals. Project managers use them to communicate system overviews to stakeholders.
Can AI create block diagrams?
Yes. Modern AI tools can generate block diagrams from natural-language descriptions. You describe your system in plain text -- for example, "a feedback control system with a PID controller, a DC motor plant, and an encoder sensor" -- and the AI produces a structured block diagram with labeled blocks and correctly directed arrows. This approach eliminates manual drawing and is especially useful for rapid prototyping, documentation, and educational purposes. ConceptViz's Block Diagram Generator is one such tool that creates publication-ready block diagrams from text descriptions in seconds.
Start Creating Block Diagrams Today
Block diagrams are a deceptively simple tool with enormous communicative power. By mastering the basics -- blocks, arrows, labels, summing points, and branch points -- you gain the ability to represent virtually any system at the level of abstraction your audience needs.
Whether you are designing a new embedded system, documenting a manufacturing process, preparing a textbook figure, or simply trying to explain how a complex system works to a non-technical audience, a well-crafted block diagram is often the most effective visual you can produce.
Block Diagram Generator
Generate block diagrams from text descriptions — no manual drawing needed.
分类
更多文章

Canva for Diagrams: Honest Review & Alternatives
An honest review of Canva's diagramming features in 2026. See where Canva excels, where it falls short, and which specialized alternatives work better.

Motion Diagram Physics Guide: How to Draw and Read Motion Diagrams
Learn how to draw motion diagrams in physics, read dot spacing, velocity arrows, acceleration direction, and connect diagrams to graphs.
")
15 Illustration and Infographic Design Styles Explained (2026)
Explore 15 illustration and infographic design styles with examples: flat, isometric, 3D, hand-drawn, minimalist, vector, cartoon, line art and more.