Phylogenetic Tree Maker for Evolutionary Relationships
Make an evolutionary tree online from the taxa you want to compare. Get a labeled phylogenetic tree with branches, nodes, and common ancestors — free.
AI Phylogenetic Tree Generator
Free to try ·
Your phylogenetic tree will appear here
Illustrative diagram — for formal sequence analysis use dedicated phylogenetics software
Phylogenetic Tree Examples
Species, gene, and molecular trees across biology and evolution
Mammalian Phylogenetic Tree
Branch lengths set by divergence time — each node marks a shared ancestor of the lineages below it.
Viral Evolution Tree
A molecular tree where branch length reflects genetic distance — the basis of variant tracking.
16S rRNA Bacterial Tree
Built from 16S rRNA sequences and rooted with an outgroup — the standard for microbial phylogeny.
Land Plant Evolution Tree
Key innovations — vascular tissue, seeds, flowers — appear at the nodes where lineages diverge.
Human mtDNA Phylogeny
A tree of mtDNA haplogroups — every branch traces back to a single African common ancestor.
Protein Family Tree
A gene tree of the globin family — nodes separate gene duplications from speciation events.
What is a phylogenetic tree?
A phylogenetic tree is a branching diagram that shows how a group of species, genes, or proteins are related through evolution. Every tip (or leaf) is a taxon — a living species or sequence you are comparing. Every branch point, called a node, represents the most recent common ancestor of everything above it. Reading from the root outward, the tree traces how one ancestral lineage split again and again into the diversity we see today. This generator turns a list of taxa into a clean, labeled tree so you can see those relationships at a glance instead of drawing branches by hand.
The parts of a phylogenetic tree: taxa, nodes, branches, and the root
- Taxa (tips/leaves): the species, populations, genes, or sequences at the ends of the branches — the things being compared.
- Branches: the lines connecting tips and nodes; they represent lineages evolving over time, and their length can encode time or amount of genetic change.
- Nodes (internal nodes): each branch point is a hypothesized common ancestor where one lineage split into two or more.
- Root: the base of the tree — the single common ancestor of every taxon shown. A rooted tree gives direction to evolutionary time.
- Clade: a node plus all of its descendants — a complete branch of the tree that shares one ancestor.
Common ancestors and how to read evolutionary relationships
Relatedness on a tree is about shared ancestry, not physical position. Two taxa are more closely related the more recently they share a common ancestor — that is, the closer their nearest shared node sits to the tips. To compare two species, trace each branch back until the lines meet; that meeting node is their most recent common ancestor. A common mistake is reading left-to-right order along the tips as a ranking — it is not. Branches rotate freely around their nodes, so only the branching pattern (the topology) carries meaning, not the order the tips happen to be drawn in.
Phylogenetic tree vs cladogram
Both diagrams show branching evolutionary relationships, but they treat branch length differently. In a cladogram, only the branching order matters — the lengths of the branches are not meaningful and carry no data. In a phylogenetic tree (often a phylogram), branch length is informative: it is scaled to represent evolutionary change, such as the number of genetic mutations or the time since divergence. So a cladogram answers "who is related to whom and in what order did they split," while a phylogenetic tree adds "how much have they changed" or "how long ago." If you only need the branching pattern, a cladogram is enough; if you need to show degree of change or divergence time, you want a phylogenetic tree.
How phylogenetic trees are built from data
Modern phylogenetic trees are usually inferred from molecular data — aligned DNA, RNA, or protein sequences — rather than physical traits alone. Researchers line up homologous sequences, measure how much they differ, and use methods such as maximum likelihood, Bayesian inference, or distance-based approaches to find the tree topology that best explains the data. Many published trees show bootstrap support values at the nodes, indicating how reliable each branch is. This AI generator does not run those statistical algorithms; it produces a clear, presentation-ready illustration of the relationships you describe, ideal for slides, study notes, posters, and reports rather than for formal sequence analysis.
Where phylogenetic trees are used in biology
Phylogenetic trees are central to evolutionary biology and far beyond it. Taxonomists use them to classify organisms by shared ancestry; epidemiologists build molecular trees of viruses to track how outbreaks and variants spread; conservation biologists use them to prioritize genetically distinct species; and biotechnologists trace gene and protein families to predict function. In the classroom they make abstract ideas — common descent, adaptive radiation, the out-of-Africa migration — concrete and visual. Whether you are comparing the great apes, mapping bacterial phyla, or showing how a protein family duplicated over time, a phylogenetic tree is the standard way to communicate evolutionary relationships.
Frequently Asked Questions
Related Biology Tools
 Biology
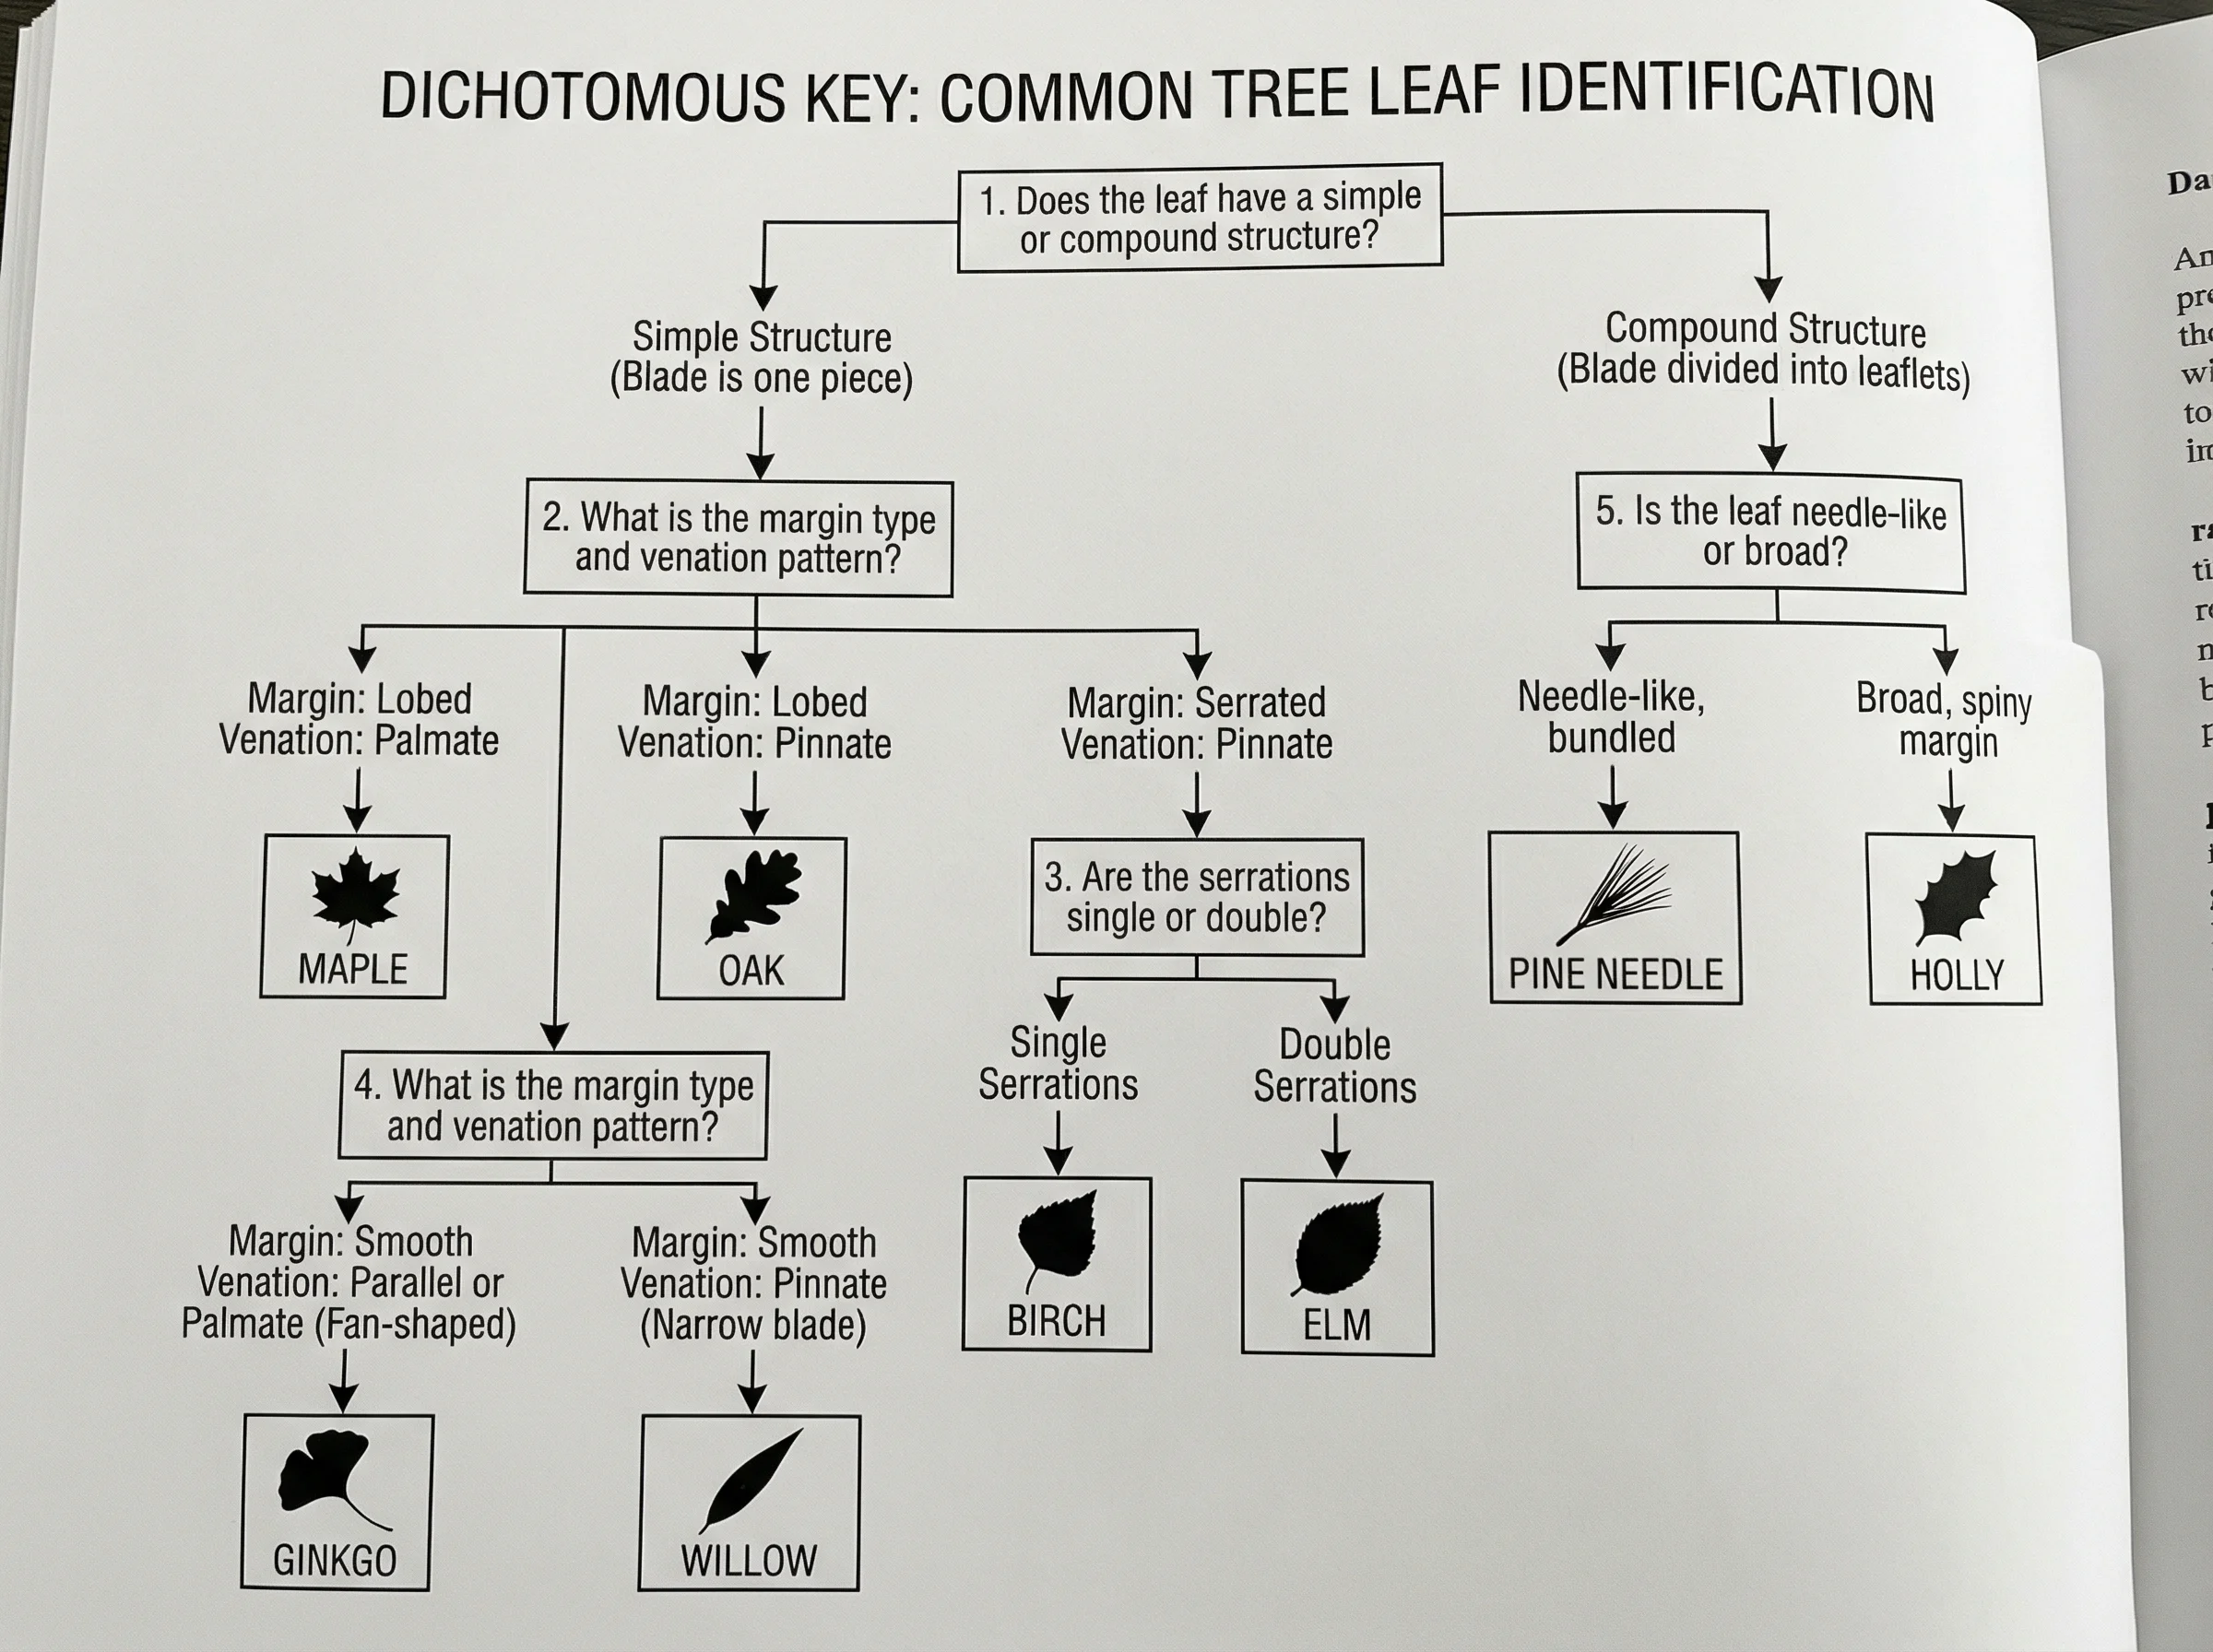
Dichotomous Key Maker
Build branching dichotomous keys to identify organisms by their traits.
 Biology
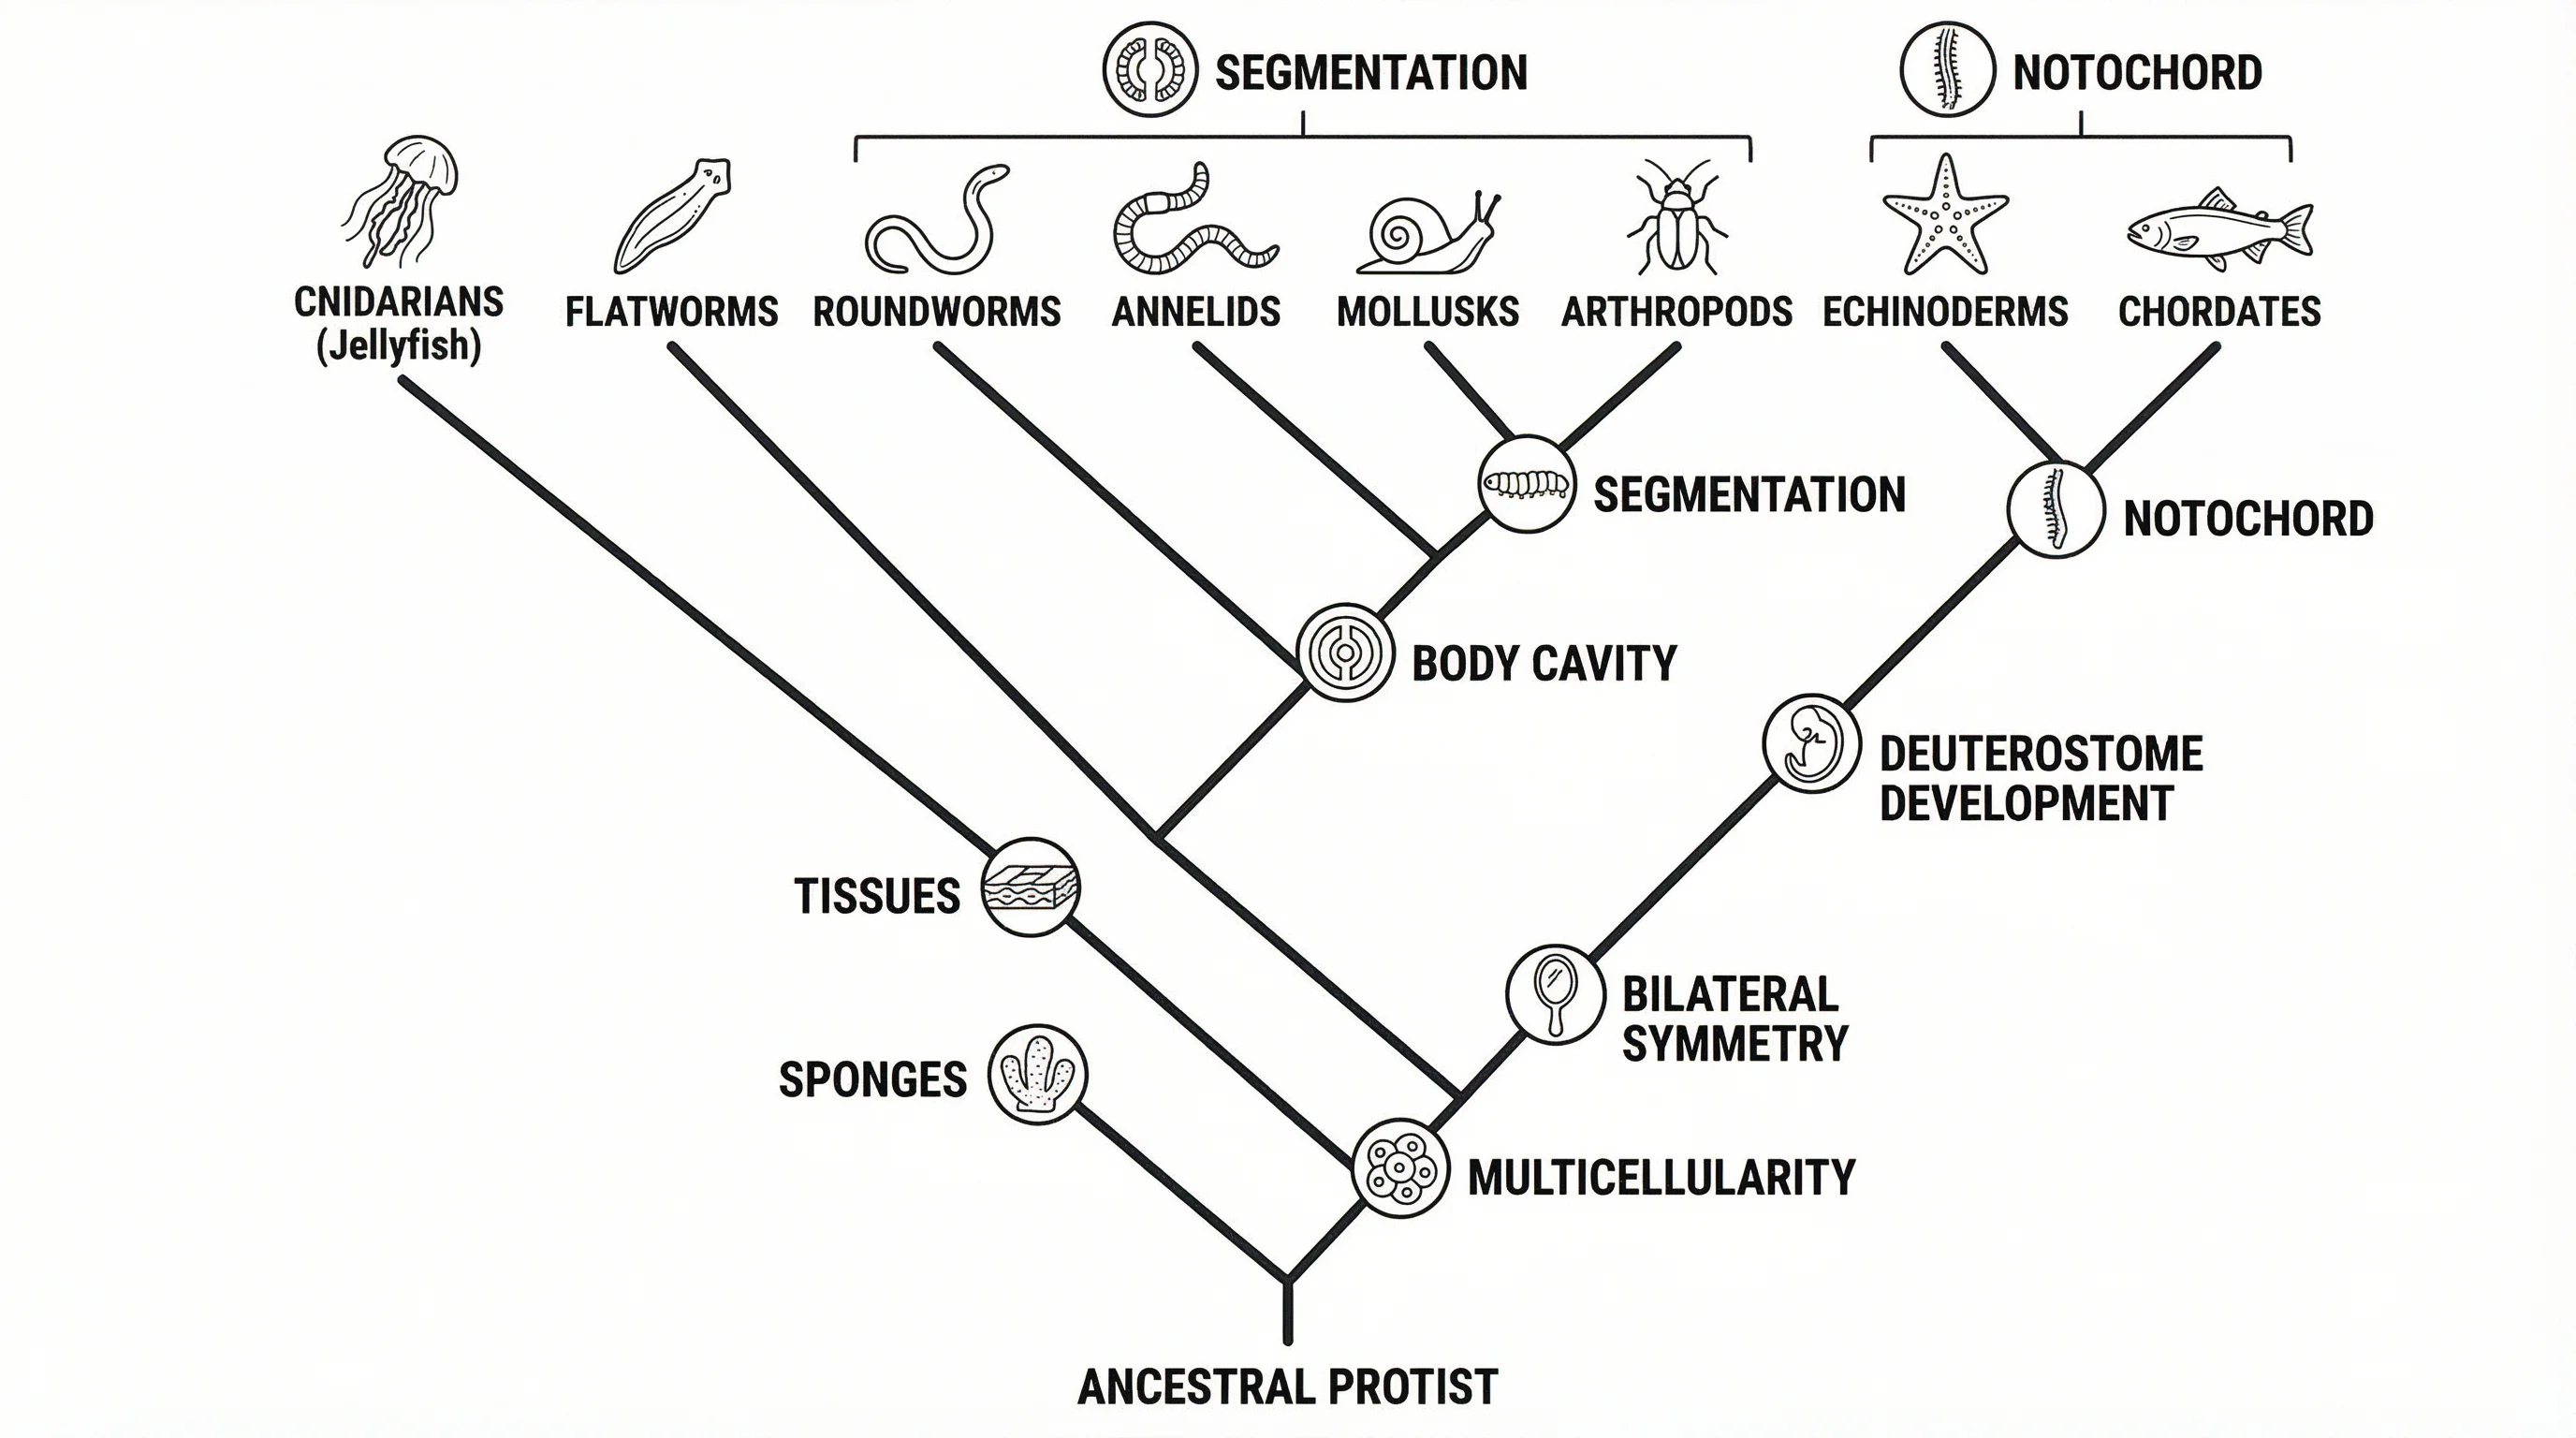
Cladogram Maker
Build a cladogram showing the branching order of shared traits — the relationships without scaled branch lengths.
 Research
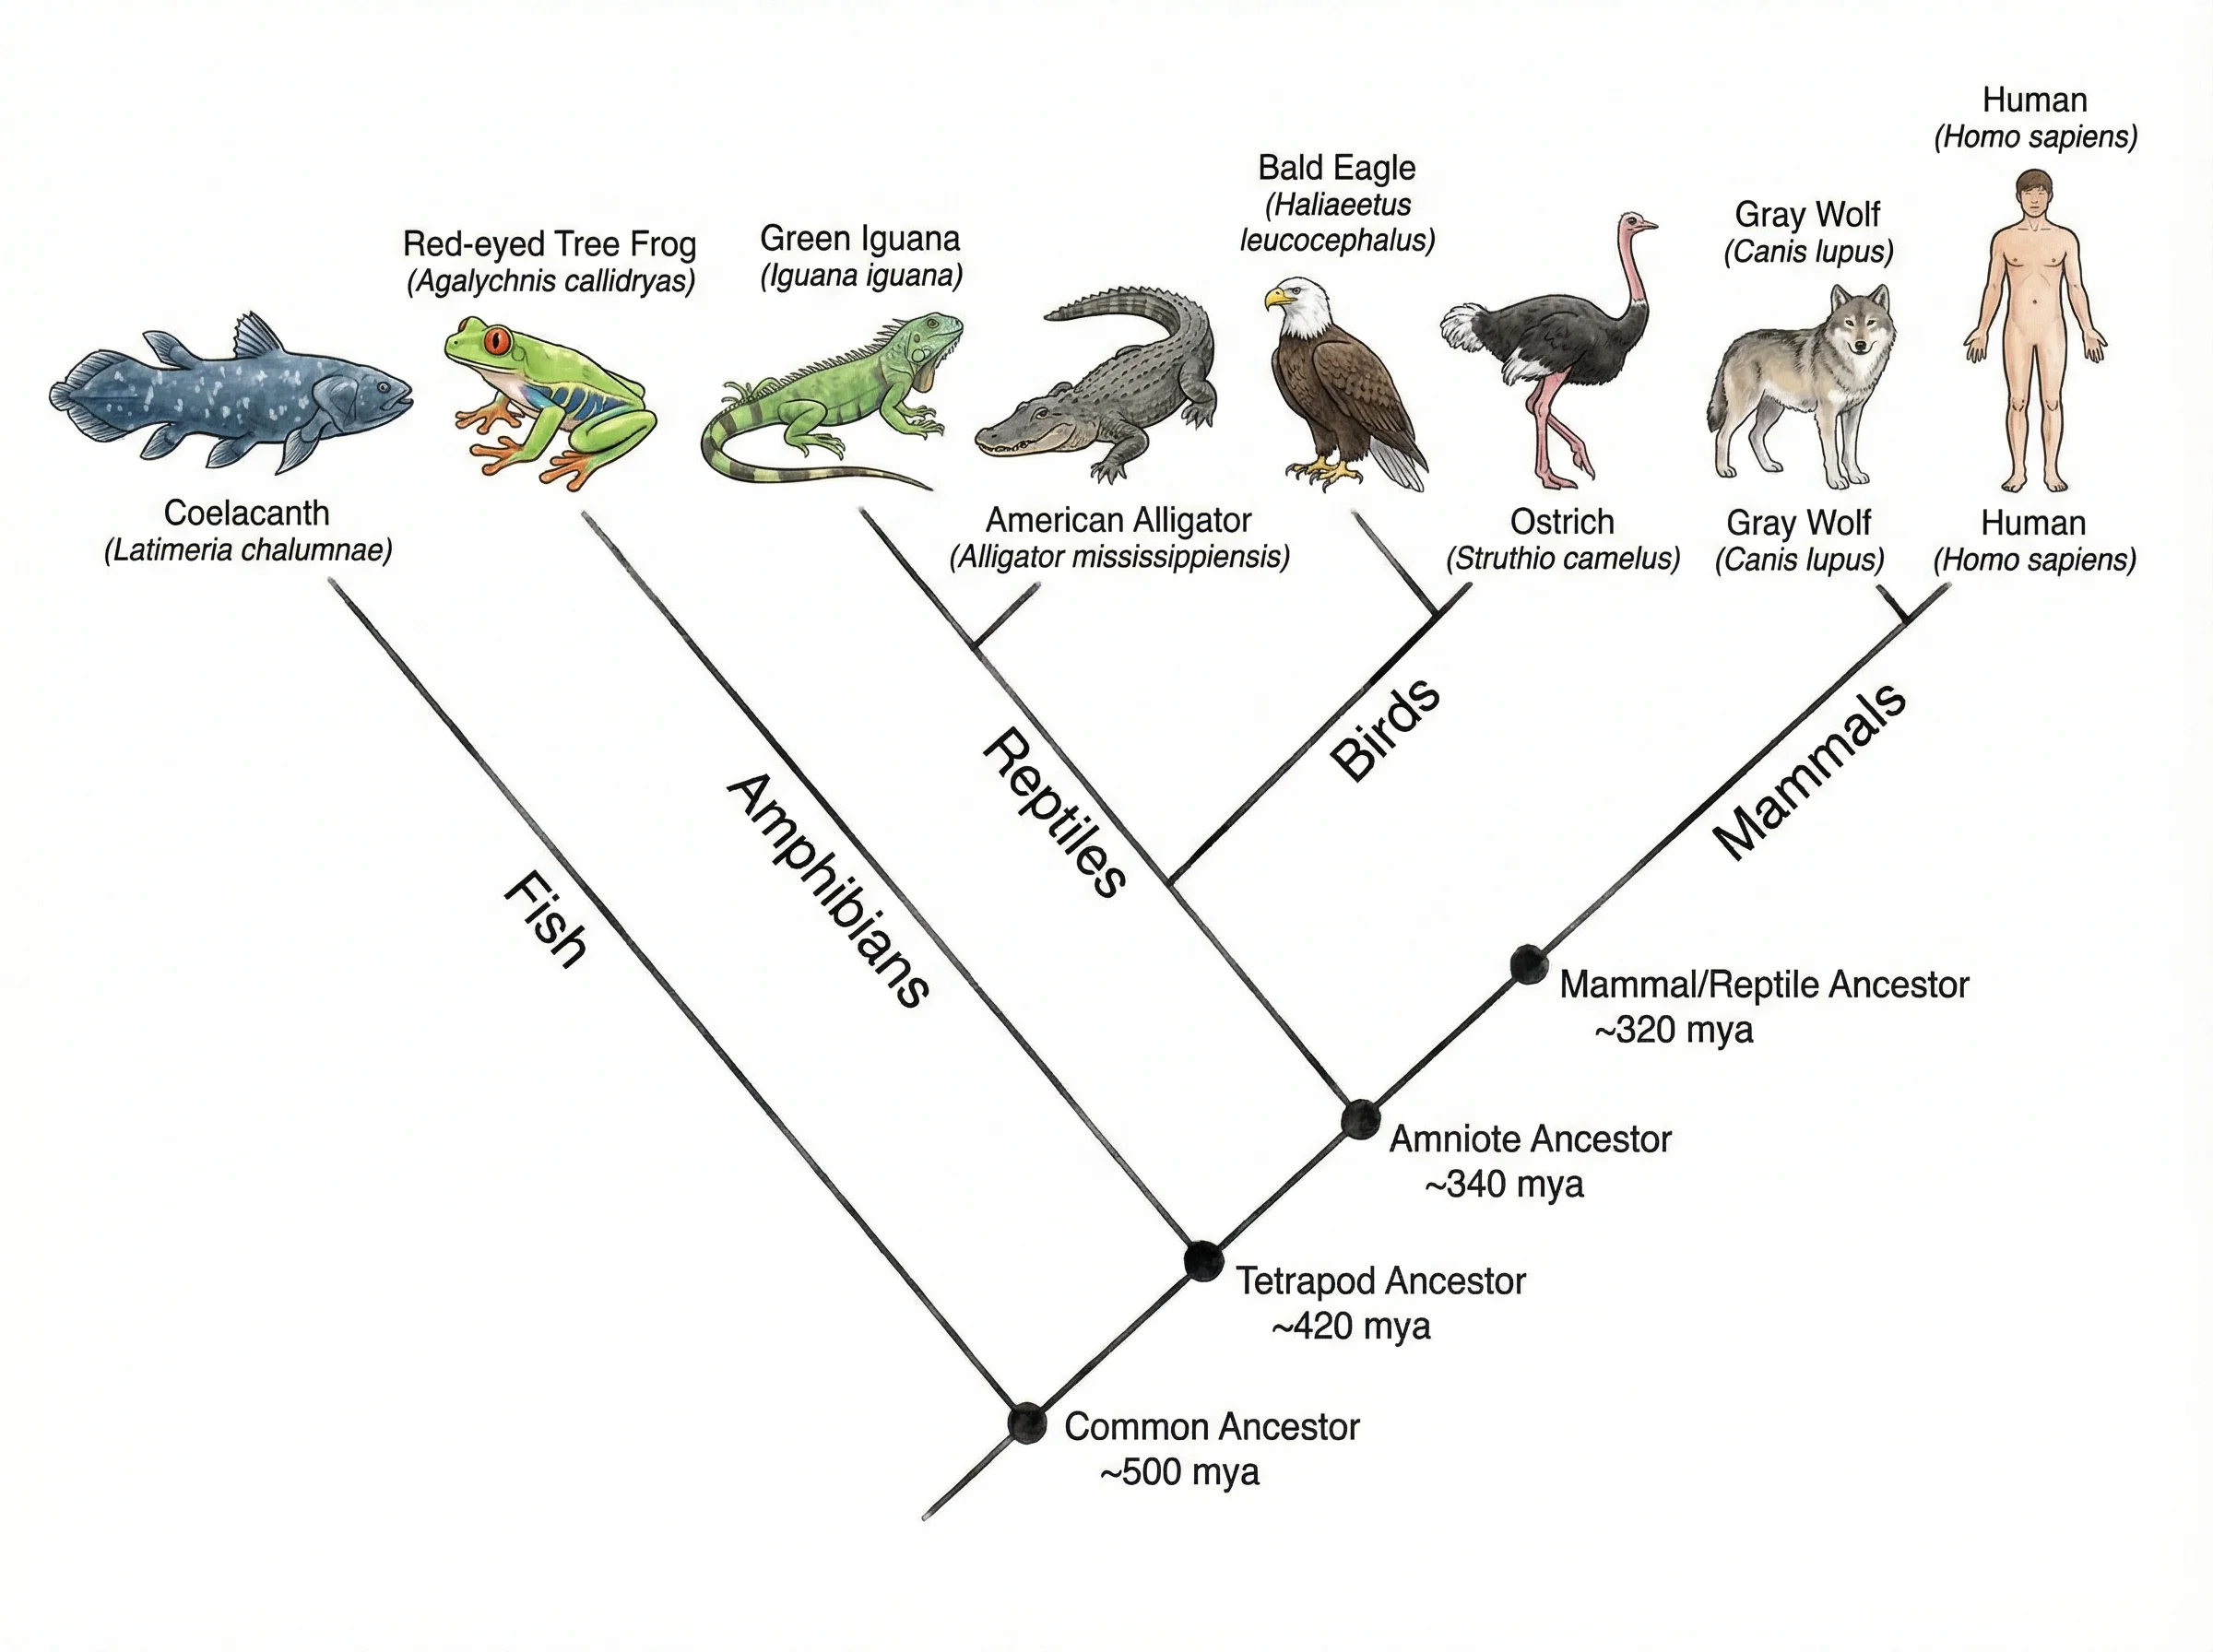
Tree Diagram Generator
Make any branching tree diagram — taxonomy, decision, or probability trees — from a simple description.
 Biology
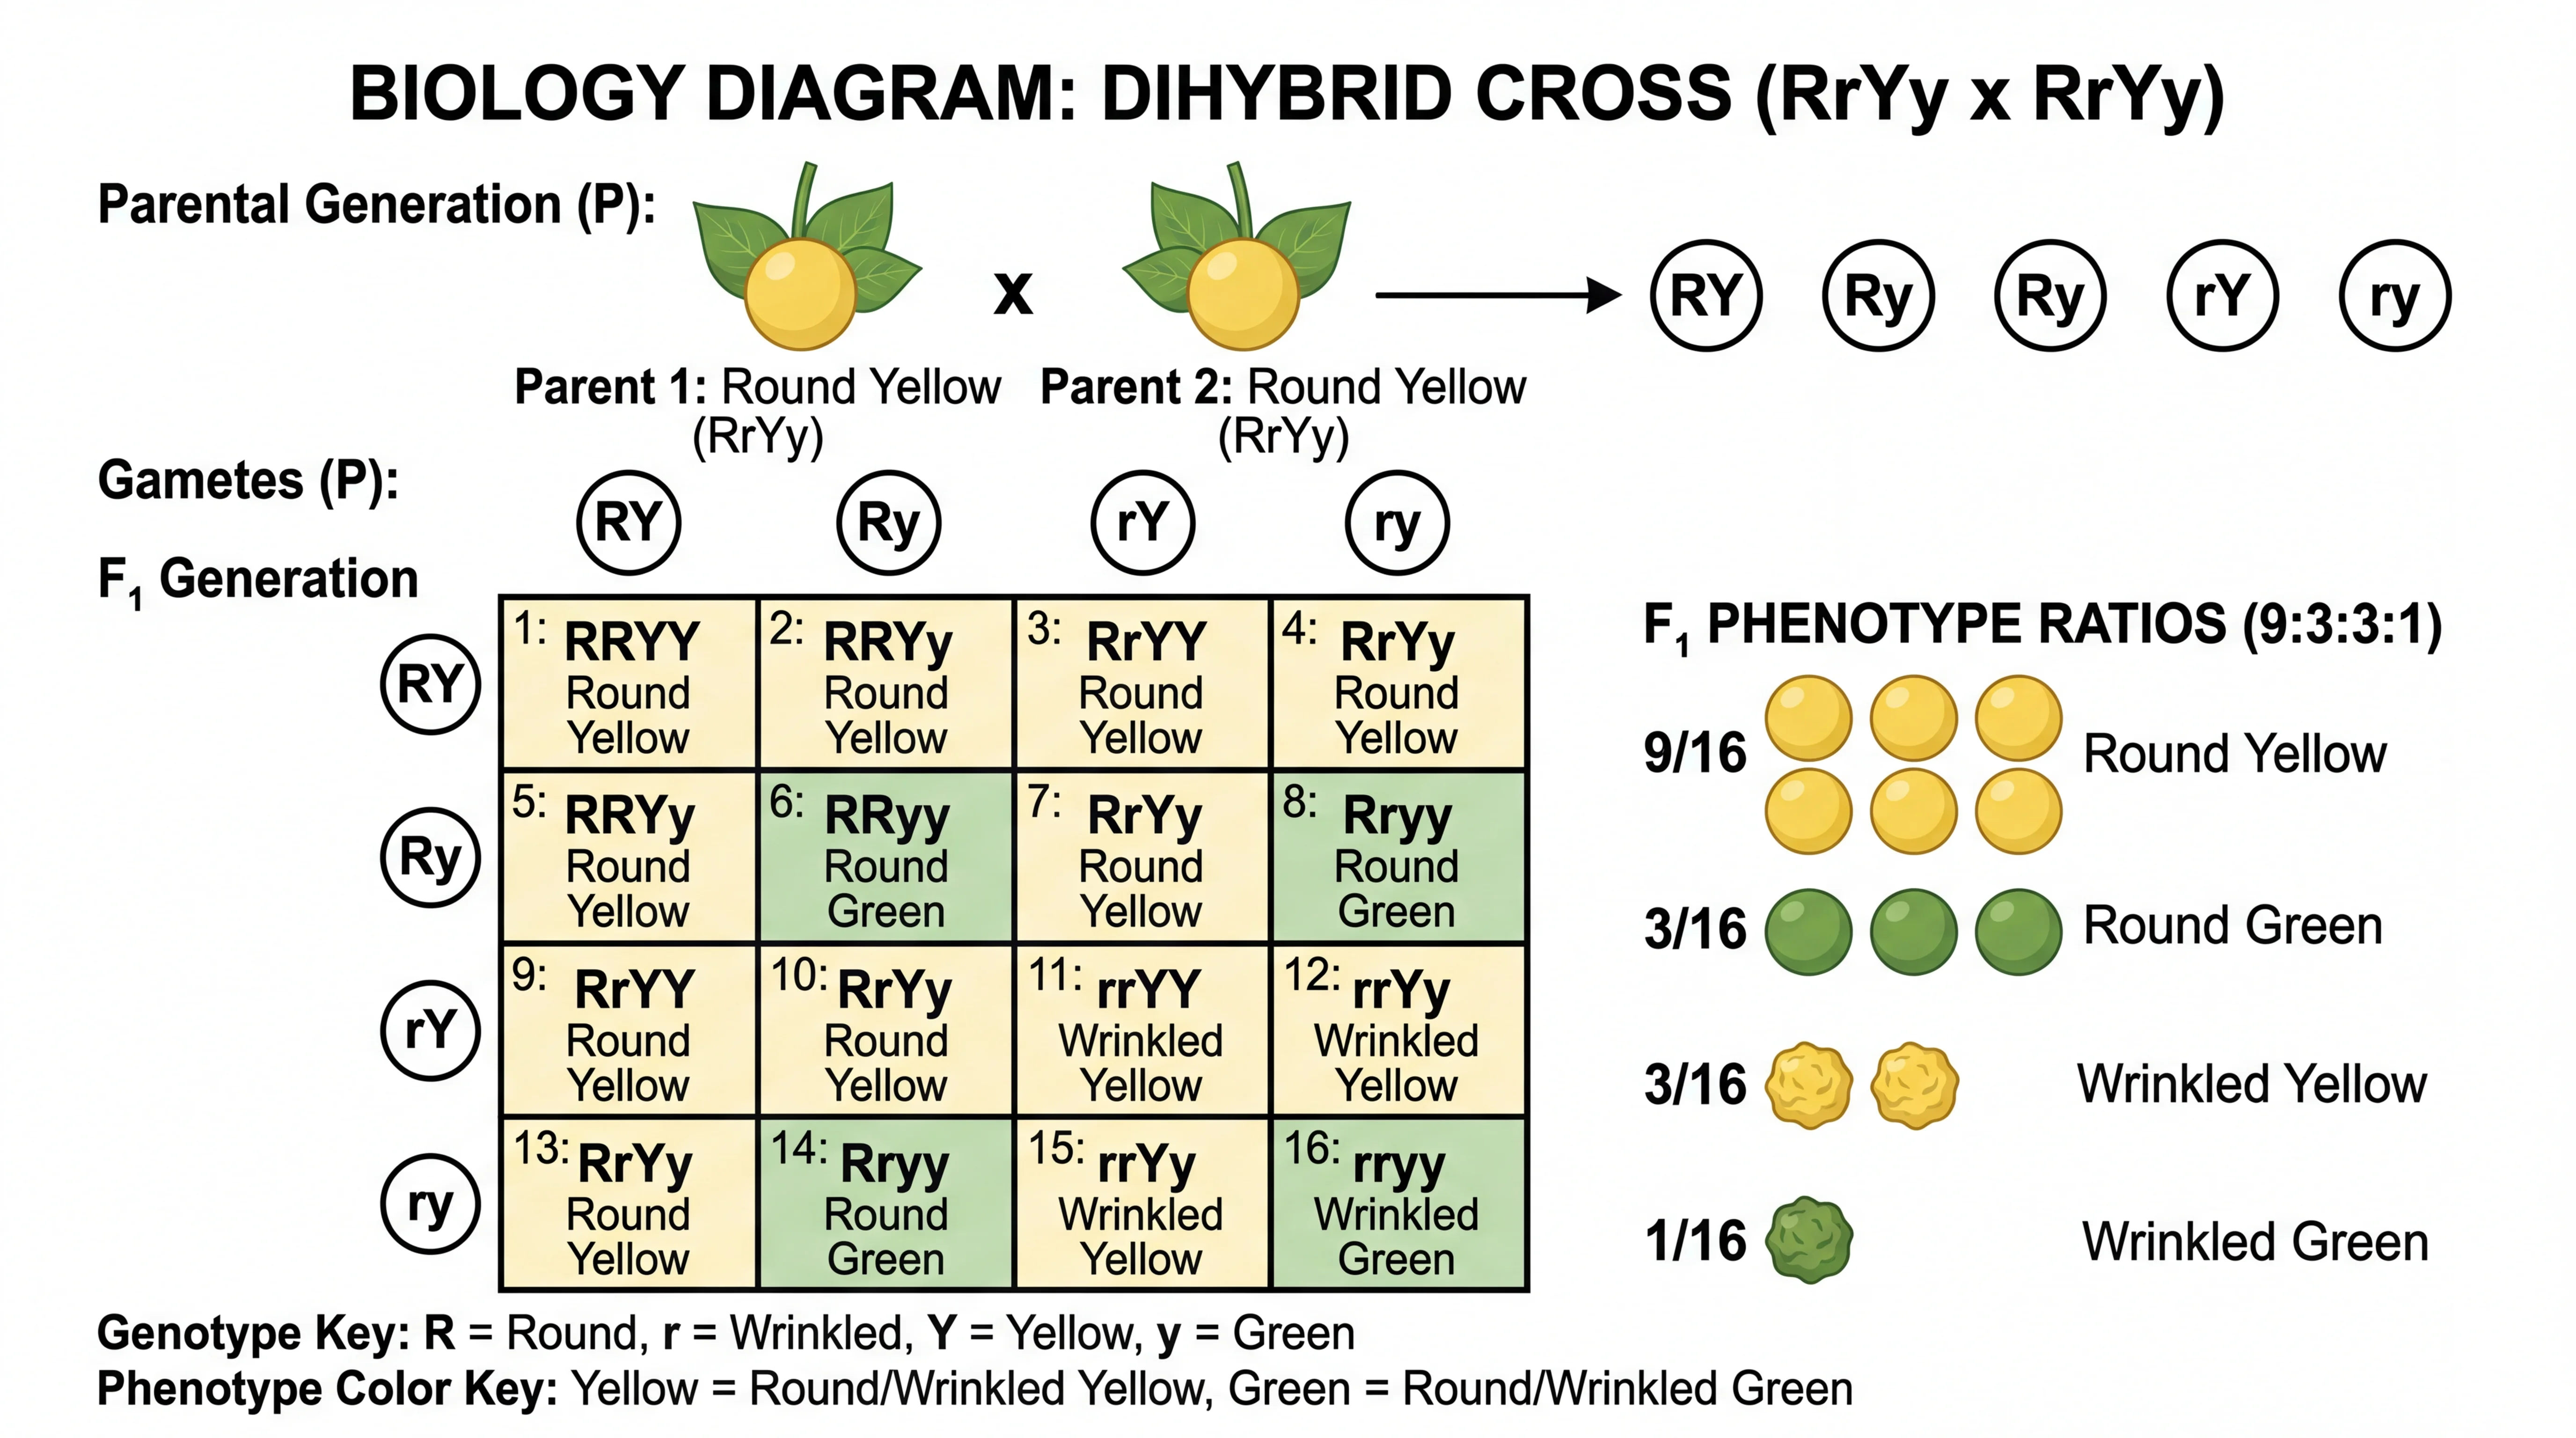
Biology Drawing Generator
Generate labeled biology illustrations — from cells and genetics to ecosystems and processes.