Sine Graph Generator Sin, Cos & Tan
Graph sine, cosine, and tangent functions with amplitude, period, phase shift, and vertical shift. Radians or degrees, labeled in π. Export SVG or PNG.
Function
y = A · sin(B · (x − C)) + D
Angle mode
Graph window
Readout
y = sin(x)
- Period
- 2π
- Amplitude
- 1
- Midline
- y = 0
Trig Graph Examples
Common ways to graph and label sine, cosine, and tangent functions
Labeled Sine Graph
A standard sine wave on a coordinate plane with the x-axis labeled in π-fractions.
Cosine Graph
A cosine wave starting at its maximum value of 1 when x = 0.
Amplitude and Period
A stretched sine wave with its amplitude and one full period highlighted.
Phase Shift
A sine wave shifted horizontally to illustrate a phase (horizontal) shift.
Tangent Graph
A tangent graph with its repeating branches and dashed vertical asymptotes.
Sine vs Cosine
A sine wave and a cosine wave drawn together to compare their shapes.
What is a sine graph?
A sine graph is the smooth, repeating wave you get when you plot y = sin(x). As x increases, the value of sine rises and falls forever between −1 and 1, tracing a curve that crosses the x-axis at every multiple of π. A standard sine wave passes through the origin (0, 0), reaches its peak of +1 at x = π/2, returns to 0 at x = π, dips to its lowest point of −1 at x = 3π/2, and completes one full cycle back at 2π. Because the pattern repeats, sine (and its cousins cosine and tangent) describe anything that oscillates: sound waves, alternating current, tides, springs, and light. This generator plots all three trigonometric functions exactly from their equation, with the x-axis labeled in radians using π-fractions so the graph matches what you see in a textbook.
Amplitude, period, phase shift, and vertical shift
- Every sine or cosine curve can be written as y = A·sin(B(x − C)) + D, and each letter transforms the basic wave in a specific way.
- A is the amplitude — the vertical stretch. It is the distance from the midline up to a peak (or down to a trough), so y = 2 sin(x) rises to +2 and falls to −2. A negative A flips the wave upside down.
- B controls the period, the horizontal length of one full cycle, through the formula period = 2π / |B|. A larger B squeezes more waves into the same space: B = 2 halves the period to π, while B = 0.5 doubles it to 4π.
- C is the phase shift, a horizontal slide. Writing (x − C) moves the whole wave C units to the right (or left when C is negative). D is the vertical shift, which raises or lowers the midline to y = D. Together, A, B, C, and D let you match any sinusoid.
Sine vs cosine
- Sine and cosine are the same wave shifted horizontally. The cosine graph y = cos(x) starts at its maximum: at x = 0 it equals +1, then falls to 0 at π/2, to −1 at π, and back to +1 at 2π. Sine, by contrast, starts at 0 and rises first.
- In fact cos(x) = sin(x + π/2), so cosine is simply sine shifted a quarter-period to the left. Both have the same amplitude, period, and midline — only the starting point differs. Switching the function selector between sin and cos in this tool shows the two curves side by side.
- Knowing this relationship makes graphing faster: sketch a sine wave, and you already know the cosine wave is the same curve nudged over by π/2.
Graphing tangent and its asymptotes
- Tangent behaves very differently from sine and cosine. Because tan(x) = sin(x) / cos(x), the function shoots off to infinity wherever cos(x) = 0 — at x = π/2, 3π/2, and every odd multiple of π/2. At those x-values the graph has a vertical asymptote, a line the curve approaches but never touches.
- Between consecutive asymptotes the tangent curve rises from −∞ to +∞, passing through zero at every multiple of π. Its period is π (not 2π), so the branches repeat twice as often as a sine wave. This tool draws each branch as a separate piece and marks the asymptotes as dashed vertical lines, so the curve never appears to jump straight across the gap.
- When you graph tangent, the amplitude and midline controls do not apply the same way — there is no maximum or minimum to mark — so the tool hides those markers and shows the asymptotes instead.
Tips for graphing trig functions
- Start by identifying A, B, C, and D from the equation before you draw. Find the period with 2π / |B|, mark the midline y = D, then place the peaks and troughs one amplitude above and below it.
- Choose an x-window that shows at least one full period — for a standard wave, −2π to 2π works well and lines up neatly with the π-fraction ticks. Widen the y-window for tall amplitudes so the peaks are not clipped.
- Use the presets to see the four canonical cases instantly, then tweak one parameter at a time to build intuition for how each transformation changes the wave. Export a clean SVG or PNG for worksheets, slides, and homework.
Frequently Asked Questions
Related Math Tools
 Education
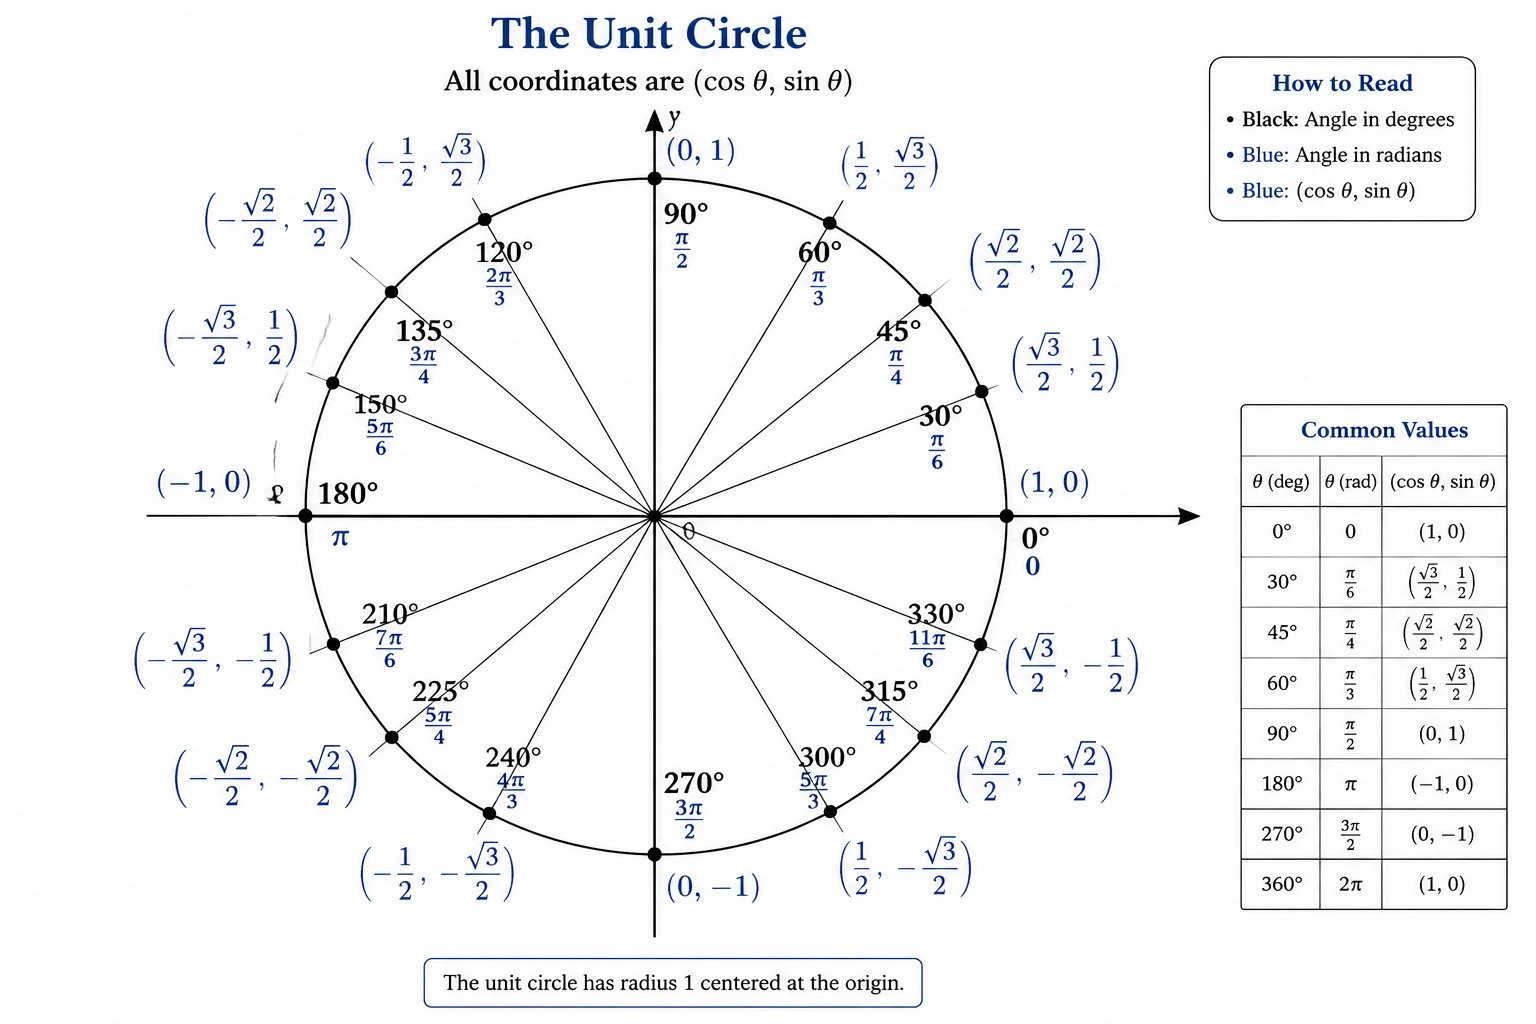
Unit Circle Generator
Draw a labeled unit circle with degrees, radians, and exact sine and cosine coordinates for trigonometry.
 Education
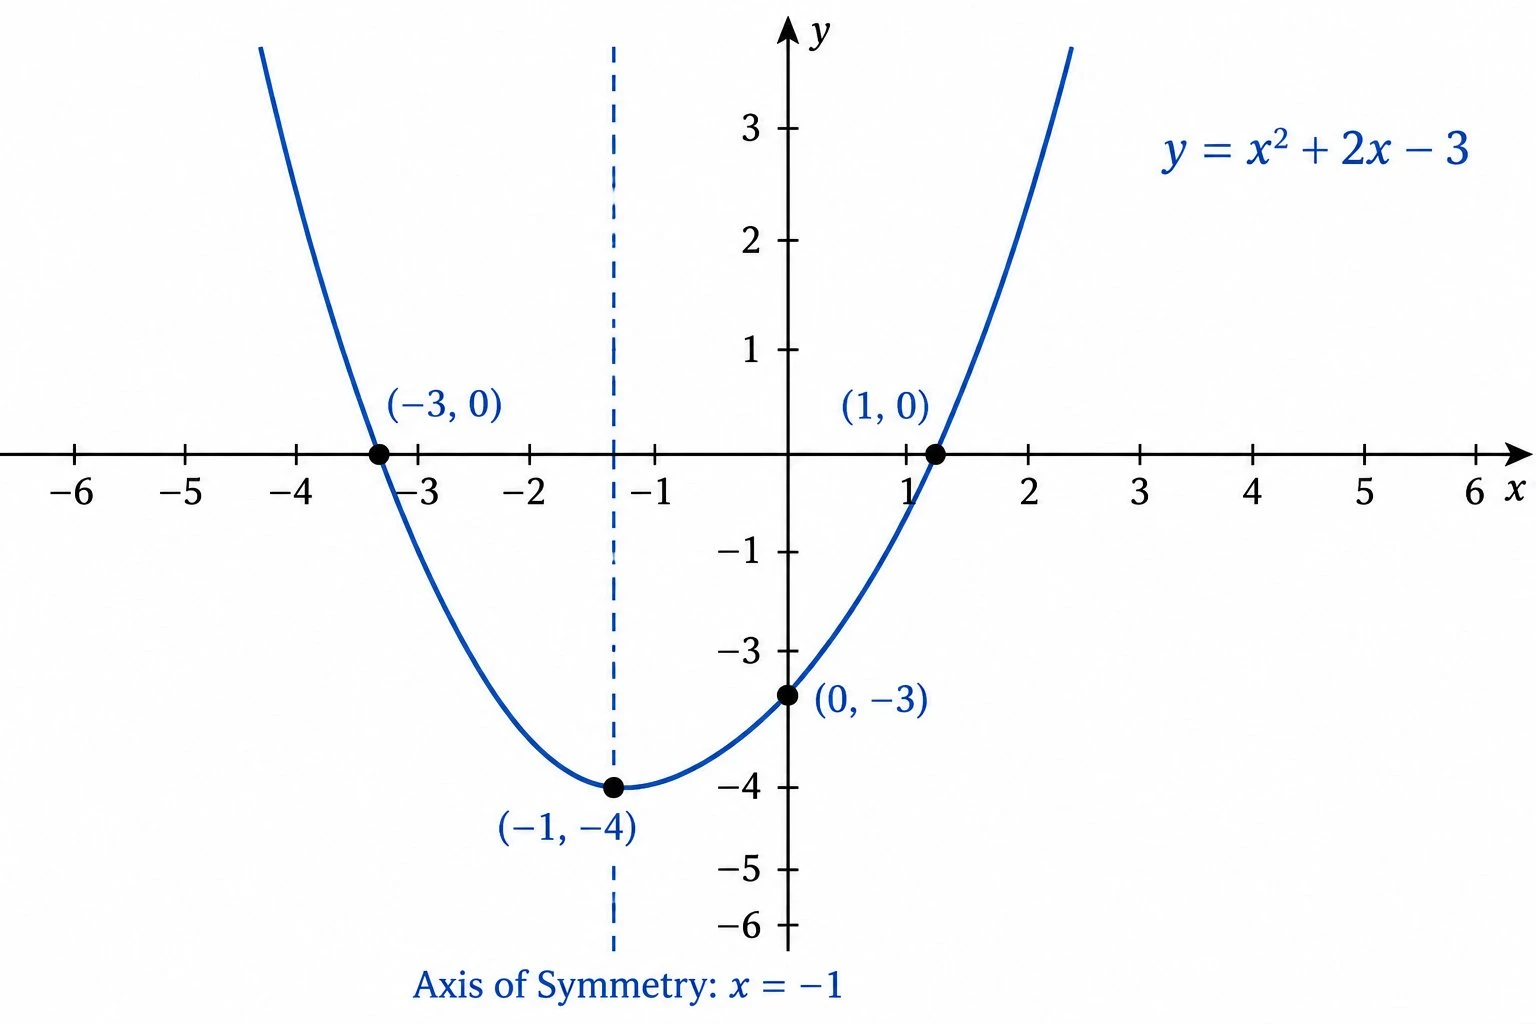
Parabola Graph Generator
Graph a parabola from its equation with the vertex, axis of symmetry, roots, and y-intercept labeled.
 Education
Coordinate Plane Generator
Create clean, printable Cartesian planes: plot ordered pairs, graph lines by slope and intercept, and label the four quadrants.