Parabola Graph Generator to Graph a Parabola with Vertex & Roots
Graph a parabola from its equation and label every key feature. Enter a quadratic in standard form y = ax² + bx + c or vertex form y = a(x − h)² + k, and the tool plots a smooth curve with the vertex, axis of symmetry, x-intercepts (roots), y-intercept, and optional focus and directrix — then export SVG or PNG. Deterministic precise mode plus an AI sketch mode.
y = a·x² + b·x + c
Graph window
Readout
- Vertex
- (0, -4)
- Axis
- x = 0
- Y-intercept
- (0, -4)
- Roots
- x = -2, x = 2
- Direction
- Opens up
Parabola Graph Examples
Common ways to graph and label a parabola on a coordinate plane
Labeled Parabola Graph
A parabola on a numbered coordinate plane with vertex, axis, and roots labeled.
Parabola in Vertex Form
A parabola plotted from vertex form y = a(x − h)² + k with the vertex highlighted.
Axis of Symmetry
A parabola with its dashed vertical axis of symmetry running through the vertex.
Roots and X-Intercepts
A parabola crossing the x-axis at its two roots, marked as labeled points.
Focus and Directrix
A parabola with its focus point and dashed directrix, vertex midway between them.
Standard vs Vertex Form
The same parabola shown as standard form and vertex form side by side.
What is a parabola?
A parabola is the U-shaped curve you get when you graph a quadratic function y = ax² + bx + c, where a is not zero. Every parabola is symmetric about a vertical line and has a single turning point called the vertex — a lowest point if the curve opens upward or a highest point if it opens downward. The sign of the leading coefficient a decides the direction: when a is positive the parabola opens up, and when a is negative it opens down. The size of a controls how wide or narrow the curve is: a small value like 0.25 gives a wide, gentle parabola, while a large value gives a steep, narrow one. Parabolas describe the path of a thrown ball, the shape of a satellite dish, and countless other real-world curves.
Standard form vs vertex form
- The same parabola can be written two ways. Standard form, y = ax² + bx + c, makes the y-intercept obvious — it is simply c, the point (0, c). Vertex form, y = a(x − h)² + k, makes the vertex obvious — it sits at (h, k).
- The two forms are interchangeable. To go from vertex form to standard form, expand: y = a(x − h)² + k becomes y = ax² − 2ahx + (ah² + k), so b = −2ah and c = ah² + k. This tool accepts either form and converts internally, so every computed feature stays consistent no matter which you type.
- Use standard form when a problem gives you a, b, and c directly, and vertex form when you already know the turning point and want to shift or stretch it.
Finding the vertex and axis of symmetry
- For a parabola in standard form, the x-coordinate of the vertex is h = −b / (2a). Substitute that back into the equation to get the y-coordinate, or use k = c − b² / (4a) directly.
- The axis of symmetry is the vertical line x = h that passes through the vertex. The parabola is a mirror image of itself across this line, which is why two points with x-values equally far from h always share the same height.
- For example, y = x² + 2x − 3 has a = 1 and b = 2, so h = −2 / 2 = −1 and k = −3 − 4/4 = −4. The vertex is (−1, −4) and the axis of symmetry is x = −1.
Roots, x-intercepts, and the discriminant
- The roots (also called x-intercepts or zeros) are the x-values where the parabola crosses the x-axis, found by solving ax² + bx + c = 0 with the quadratic formula x = (−b ± √(b² − 4ac)) / (2a).
- The expression under the square root, D = b² − 4ac, is the discriminant, and its sign tells you how many real roots exist before you finish the calculation. If D is positive there are two distinct real roots; if D equals zero the vertex sits on the x-axis and there is exactly one root; if D is negative the parabola never touches the x-axis and there are no real roots.
- For y = x² + 2x − 3, D = 4 − 4(1)(−3) = 16, which is positive, so there are two roots: x = (−2 ± 4) / 2, giving x = −3 and x = 1.
Focus and directrix
- Every parabola can also be defined geometrically as the set of points equally distant from a fixed point, the focus, and a fixed line, the directrix. For y = a(x − h)² + k, the focus is at (h, k + 1/(4a)) and the directrix is the horizontal line y = k − 1/(4a).
- The vertex always lies exactly halfway between the focus and the directrix. The quantity 1/(4a) is the focal distance: a wide parabola (small a) has a focus far from the vertex, while a narrow parabola has one close to it.
- Toggle "Focus & directrix" in the tool to see both drawn on the graph — useful for conic-sections lessons and for showing why satellite dishes and headlights use parabolic shapes to focus signals at a single point.
Frequently Asked Questions
Related Math Tools
 Education
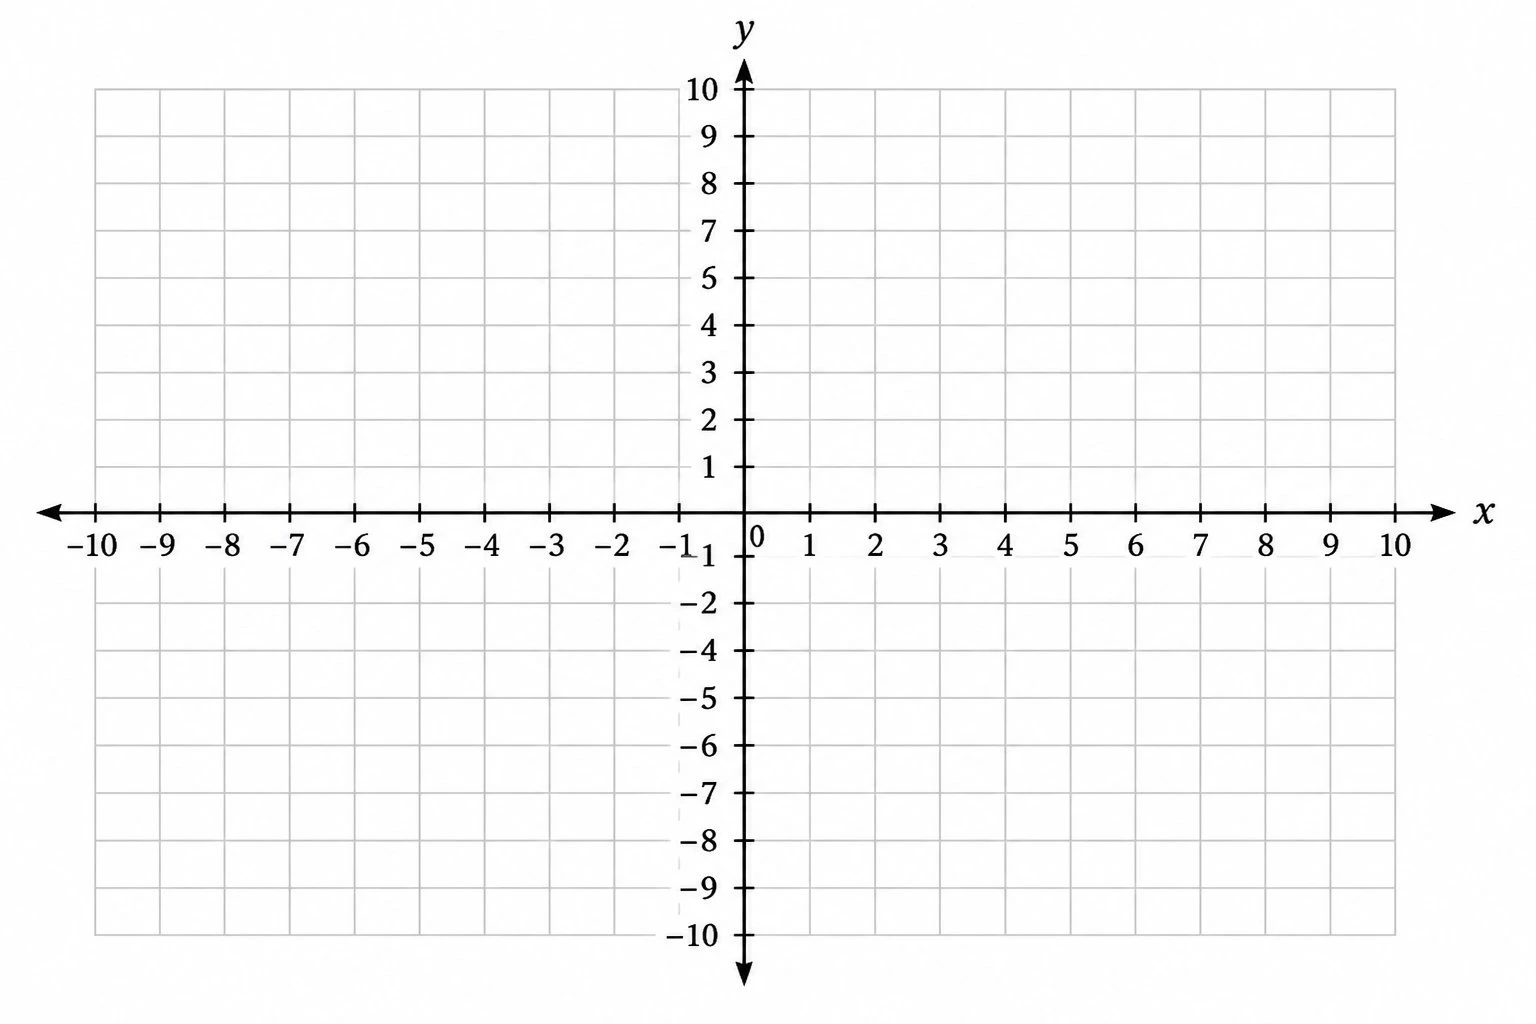
Coordinate Plane Generator
Create clean, printable Cartesian planes: plot ordered pairs, graph lines by slope and intercept, and label the four quadrants.
 Education
Number Line Generator
Create precise number lines: plot points, graph inequalities and intervals, and mark fractions or decimals.
 Education
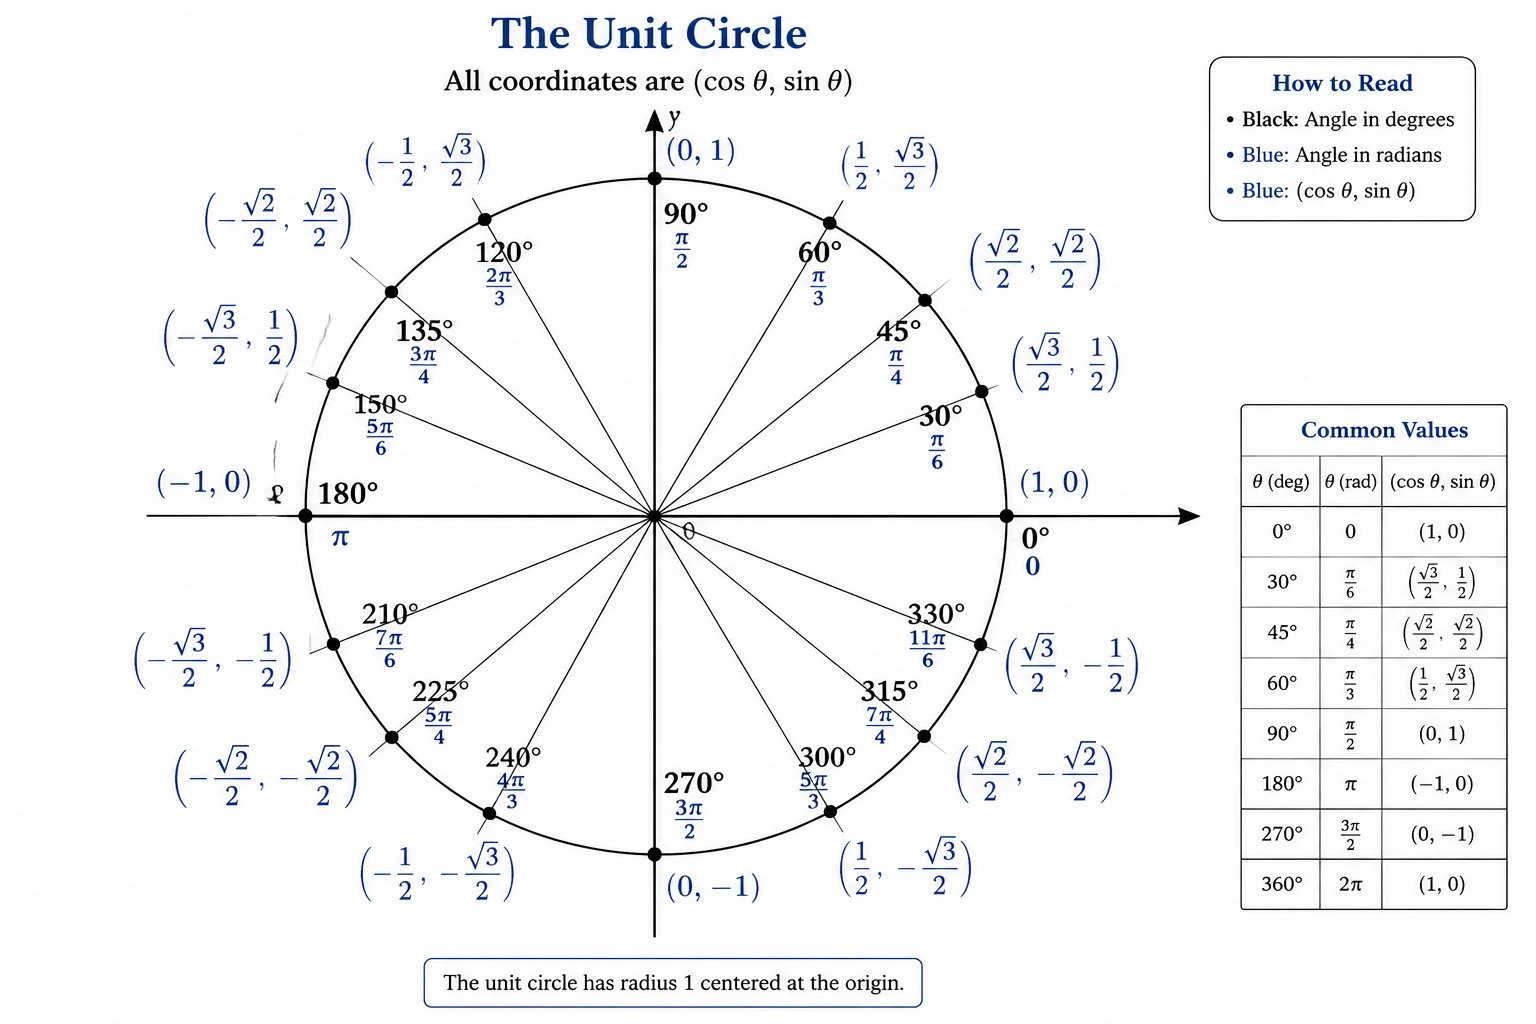
Unit Circle Generator
Draw a labeled unit circle with degrees, radians, and exact sine and cosine coordinates for trigonometry.