Coordinate Plane Generator to Plot Points & Graph Lines
Create clean, printable coordinate planes (Cartesian graphs). Plot ordered pairs, graph lines by slope and intercept, draw segments, label the four quadrants, and set exact gridline spacing — then export SVG or PNG. Deterministic precise mode plus an AI sketch mode.
Add points, lines, or segments, or pick a preset above.
Coordinate Plane Examples
Common Cartesian-plane layouts for points, lines, and quadrants
Labeled Coordinate Plane
A standard Cartesian plane with numbered axes and evenly spaced gridlines.
The Four Quadrants Labeled
The plane divided into four quadrants labeled I–IV around the origin.
Plotting Ordered Pairs
Ordered pairs (x, y) plotted as labeled points on a numbered grid.
Graphing a Line
A straight line graphed from its slope and intercept across the grid.
First Quadrant Grid
A first-quadrant-only grid from 0 to 10 for plotting positive values.
Blank Coordinate Plane Worksheet
A blank, printable numbered coordinate plane for classroom worksheets.
What is a coordinate plane?
A coordinate plane, also called the Cartesian plane, is a flat two-dimensional grid formed by two perpendicular number lines. The horizontal line is the x-axis and the vertical line is the y-axis; they cross at the origin, the point (0, 0). Every location on the plane is named by an ordered pair (x, y): the first number tells you how far to move left or right along the x-axis, and the second tells you how far to move up or down along the y-axis. Because the spacing is uniform, the plane lets you plot points, graph equations, measure distances, and see relationships between two variables at a glance.
The four quadrants
- The two axes divide the plane into four regions called quadrants, numbered counter-clockwise starting from the top right.
- Quadrant I (top right) holds points where x and y are both positive. Quadrant II (top left) has negative x and positive y. Quadrant III (bottom left) has both negative. Quadrant IV (bottom right) has positive x and negative y.
- Points that lie exactly on an axis belong to no quadrant. In the Precise plane mode you can toggle quadrant labels (I–IV) on and off, which is handy for teaching the sign pattern.
Plotting ordered pairs (x, y)
- To plot a point, always read the x-coordinate first and the y-coordinate second — the order matters, since (2, 3) and (3, 2) are different locations.
- Start at the origin, move right (positive x) or left (negative x) to the correct column, then move up (positive y) or down (negative y) to the correct row, and mark the point there.
- In the tool, add a Point, type its x and y values, optionally give it a label such as (2, 3), and pick a color. The renderer maps the value to its exact pixel position on the grid so the dot lands precisely.
Graphing lines and slope
- A straight line is usually written in slope-intercept form, y = mx + b, where m is the slope (rise over run) and b is the y-intercept (where the line crosses the y-axis).
- For y = 2x + 1, the line crosses the y-axis at (0, 1) and rises 2 units for every 1 unit it moves right, so it also passes through (1, 3). To graph it, plot the intercept, use the slope to step to a second point, and connect them.
- In the tool, add a Line and enter its slope and intercept — the renderer draws the full line clipped neatly to the edges of the window. Check "vertical" for a line of the form x = c, which has no slope.
Tips for clean, printable graphs
- Match the axis range to your data: use a symmetric window like −10…10 for mixed signs, or a first-quadrant 0…10 grid when every value is positive.
- Keep the step small enough to read but large enough that labels do not crowd — a step of 1 or 2 works for most classroom grids.
- Use color to separate different points or lines, turn gridlines on for plotting and off for a cleaner figure, and export SVG for crisp printing or PNG (rendered at 2x) for slides and documents.
Frequently Asked Questions
Related Math Tools
 Education
Number Line Generator
Create precise number lines: plot points, graph inequalities and intervals, and mark fractions or decimals.
 Visualization
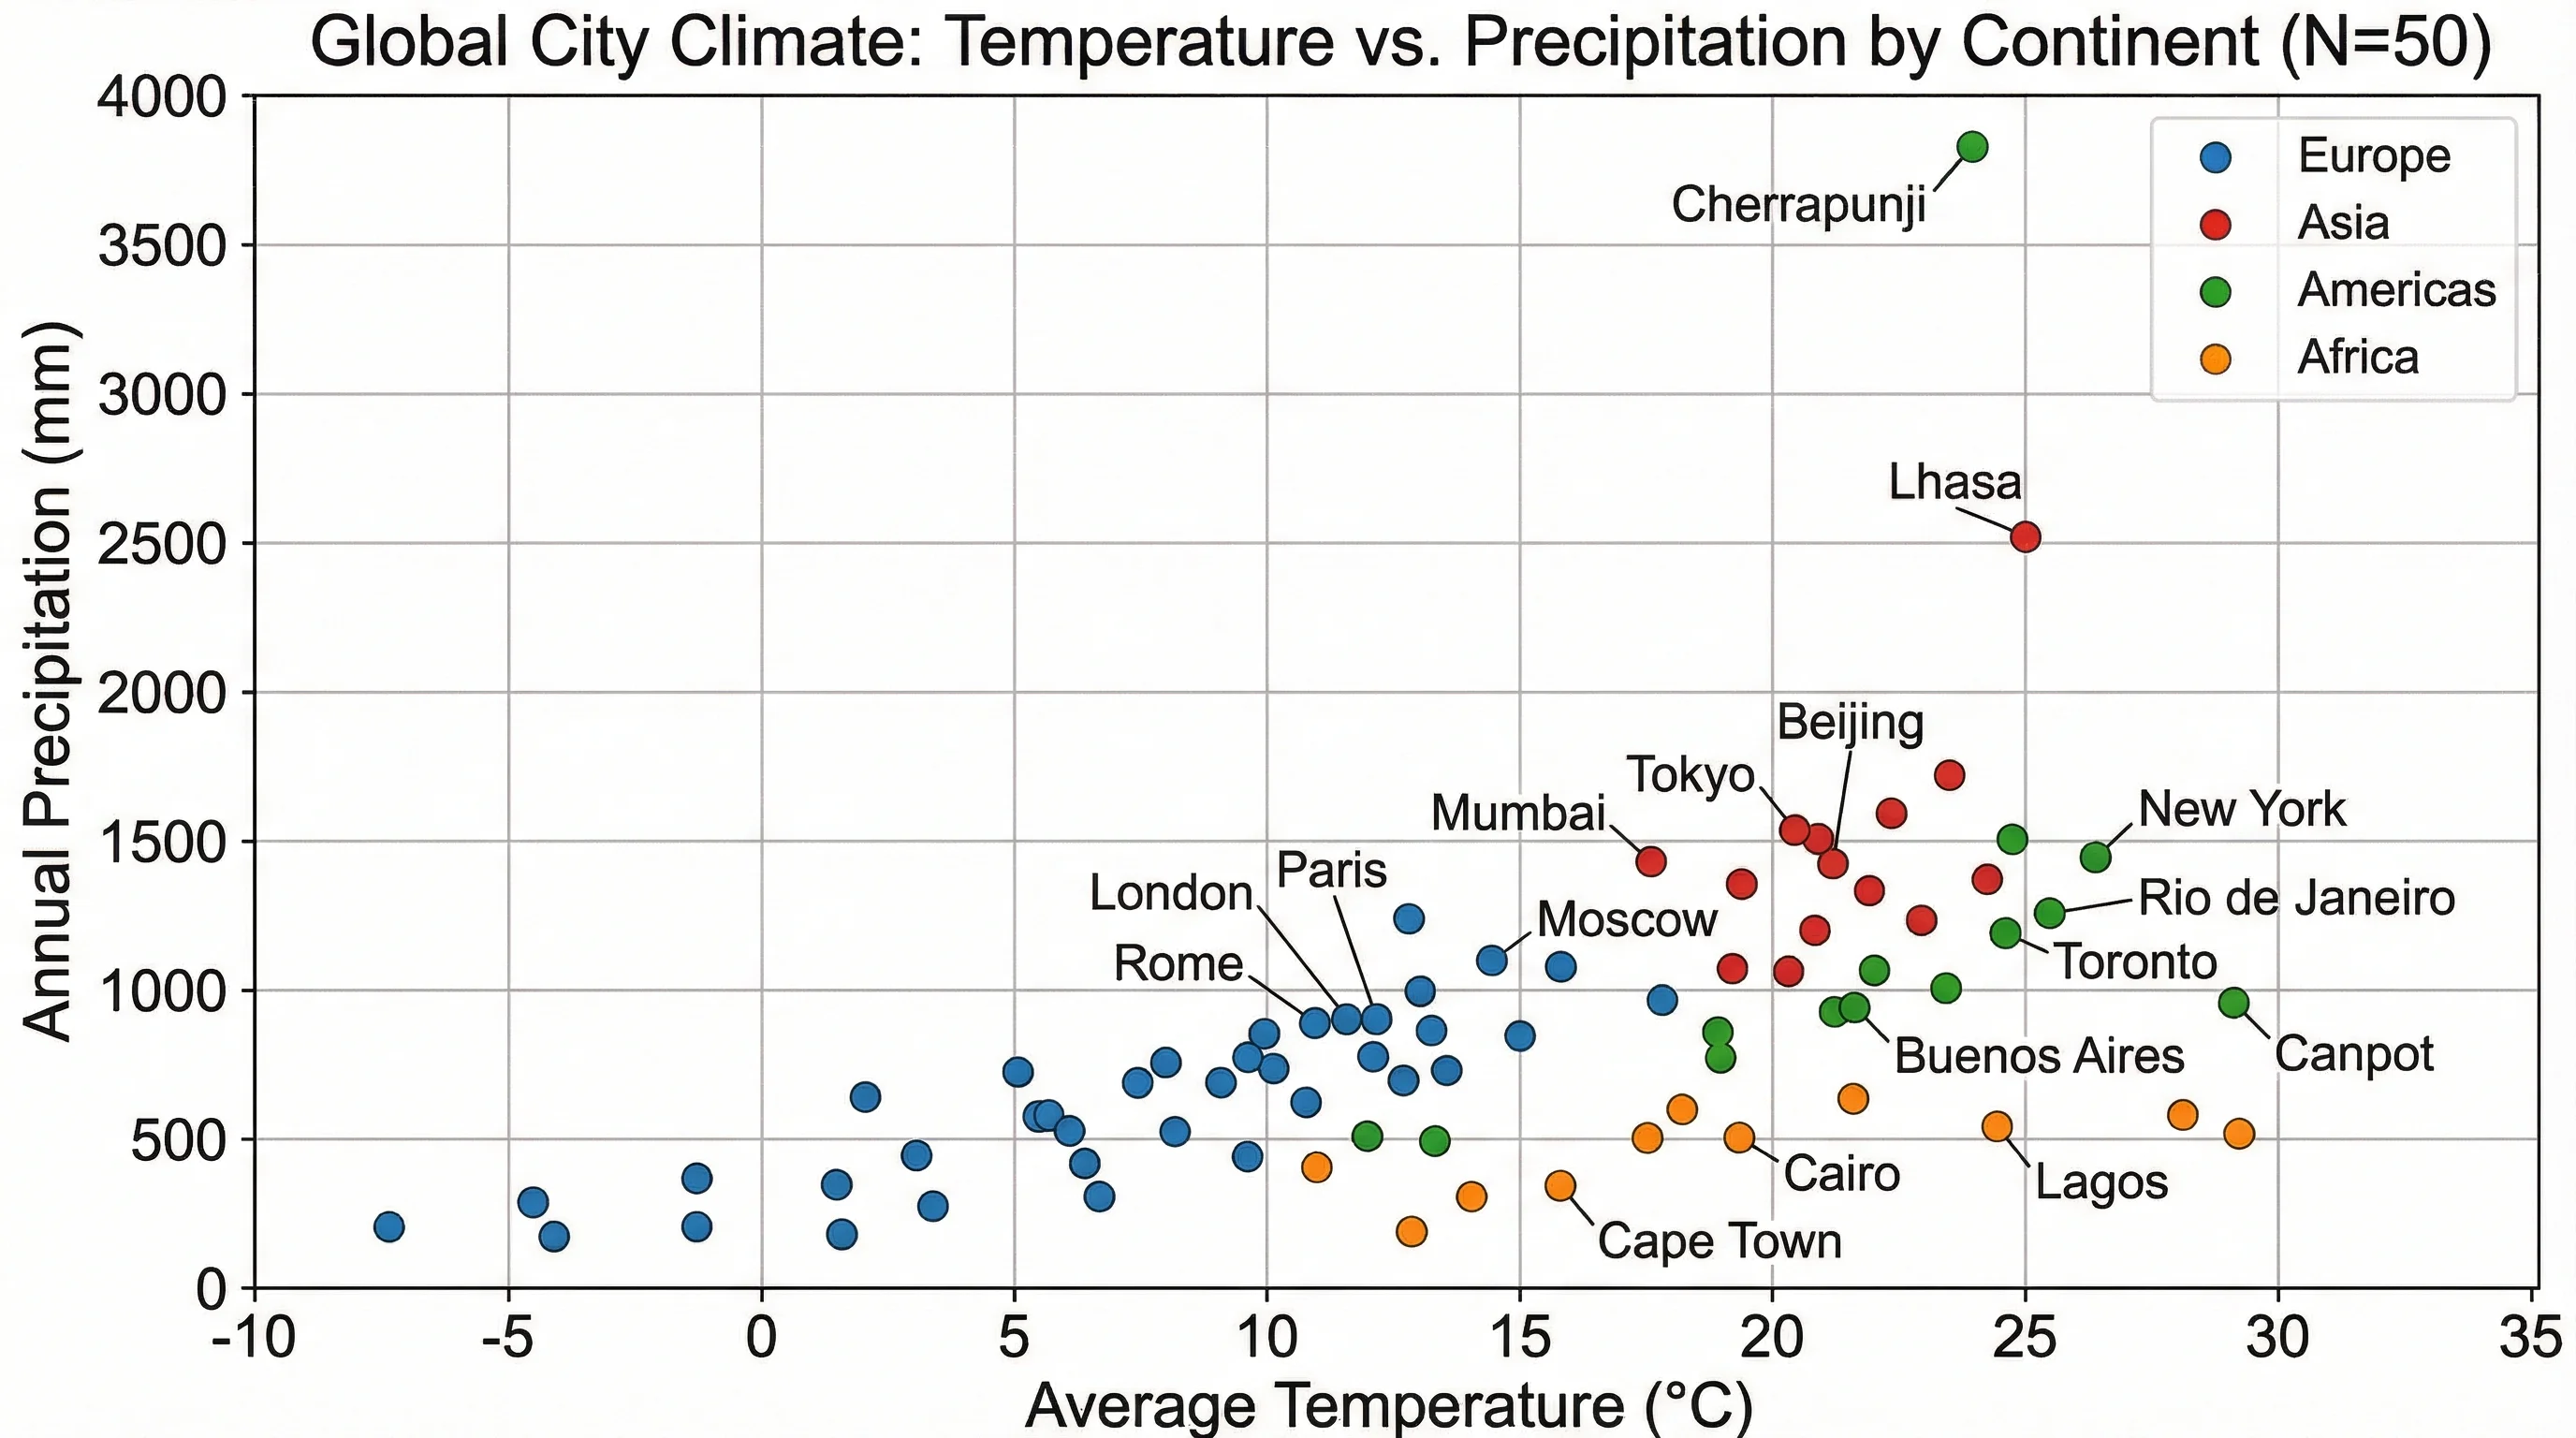
Scatter Plot Maker
Plot paired x-y data points, show correlation, and label axes for statistics and science.
 Education
Tape Diagram Generator
Model part-part-whole relationships, fractions, and ratios with labeled bar (tape) diagrams for math problems.