Probability Spinner Generator Custom Fraction Probabilities
Make a custom probability spinner: 2–12 colored sectors, exact fraction probabilities, spin simulation, printable worksheets, and SVG export.
Sectors (3)
| Sector | Fraction | Decimal | Percent |
|---|---|---|---|
| Red | 1/2 | 0.5 | 50% |
| Blue | 1/4 | 0.25 | 25% |
| Green | 1/4 | 0.25 | 25% |
Simulate spins (experimental vs. theoretical)
Probability Spinner Examples
Common ways to build a spinner for probability lessons
Unequal Sectors (1/2, 1/4, 1/4)
The default example: red takes 2 of 4 parts, so P(red) = 1/2 while blue and green are each 1/4 — unequal sectors make unequal probabilities visible.
Experimental vs. Theoretical Results
After 1000 simulated spins, the experimental frequencies sit close to the theoretical probabilities — the law of large numbers in action.
Four Equal Color Sectors
Four equal sectors give every color the same 1/4 probability — the classic starting point for introducing uniform probability.
Prize Wheel Spinner
A bright prize-wheel style spinner for classroom games and reward draws — each sector still has an exact 1/8 probability.
Two-Sector Coin Flip Spinner
A two-sector spinner works like a coin flip: each outcome has probability 1/2, ideal for the very first probability lessons.
Animal-Themed Spinner
A themed spinner keeps young learners engaged while they count outcomes and compare them with the expected 1/6 per animal.
What is a probability spinner?
A probability spinner is a circle divided into colored sectors with a pointer (needle) pivoted at the center. Give the needle a flick and it lands on a random sector — the larger the sector, the more likely the needle stops there. Spinners are one of the most popular probability manipulatives in elementary and middle-school math because the geometry is the math: a sector that covers half the circle genuinely has a one-half chance of winning. This generator lets you build a spinner with 2 to 12 sectors, set each sector’s label, color, and size in equal “parts,” and see the exact probability of every outcome as a fraction, decimal, and percentage.
Theoretical probability: the fraction formula
- The theoretical probability of landing on a sector is the share of the circle it covers. If you divide the wheel into equal parts and a sector takes w of the n total parts, then P(sector) = w/n. With the default spinner — red ×2, blue ×1, green ×1 — the wheel has 4 parts in total, so P(red) = 2/4 = 1/2, and P(blue) = P(green) = 1/4.
- Two rules always hold, and this tool enforces both: every probability is between 0 and 1, and the probabilities of all sectors add up to exactly 1 (something must happen on every spin). The probability table under the wheel reduces each fraction to lowest terms automatically — 2/4 is shown as 1/2 — and gives the matching decimal and percentage so students can practice converting between all three forms.
- A useful classroom check: ask students to write the sum of all sector probabilities before revealing the table. If their fractions do not add to 1, a sector was miscounted — a self-checking moment that needs no answer key.
Experimental probability and the law of large numbers
- Theoretical probability says what should happen; experimental probability records what actually happened. After N spins, the experimental probability of a sector is (number of times it won) / N. With only 10 spins, the experimental results can look nothing like the theory — a 1/4 sector might win 5 times or not at all.
- That gap closes as spins accumulate. This tool simulates 10, 100, or 1000 spins and shows the experimental frequency next to the theoretical probability for every sector. At 10 spins the mismatch is obvious; at 1000 spins the experimental percentages settle close to the theory. This is the law of large numbers: short runs are noisy, long runs converge — one of the most important ideas in all of probability.
- The simulation uses a seeded random generator, so repeating the same run gives the same results. That makes it safe to use as a projected demo or an answer key: every student who runs “Spin ×1000” on the same spinner sees the identical outcome table.
Classroom activities with spinners
- Prediction first: build a spinner with unequal sectors, hide the probability table, and have students predict which color will win most often — then reveal the fractions and let the geometry explain why. Follow up with 100 simulated spins to test the predictions.
- Fair or unfair? Design two spinners for a game — one equal, one rigged with a dominant sector — and ask students which game they would rather play and why. It is a natural lead-in to expected value and to skepticism about real-world games of chance.
- Worksheet practice: switch on worksheet mode to get the wheel plus fill-in probability questions (P of each sector, and the sum of all probabilities), ready to print or export as SVG. Pair it with a tally chart so students can record real spins by hand and compare their small-sample results against the 1000-spin simulation.
Frequently Asked Questions
Related Math Tools
 Education
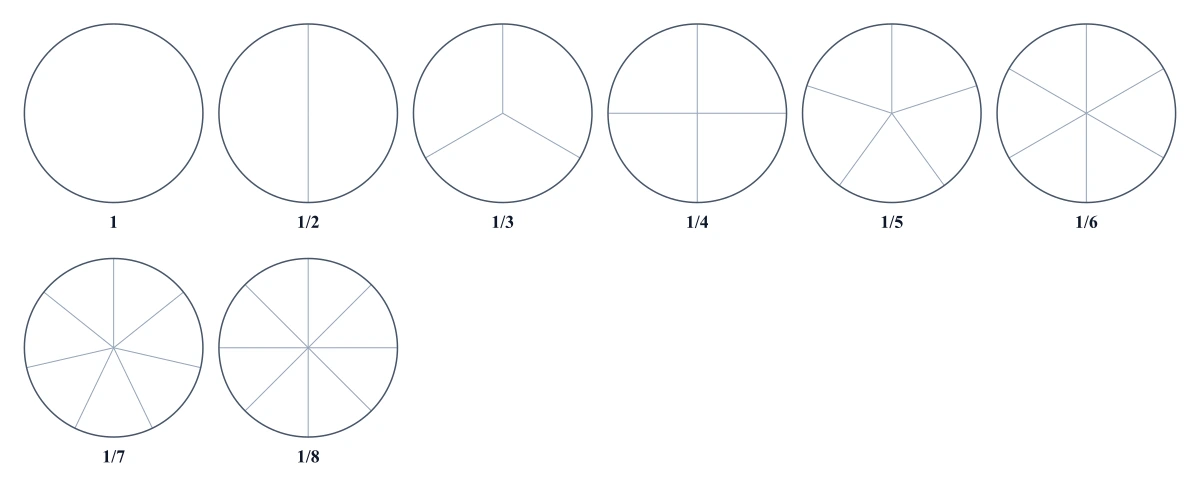
Fraction Circles Generator
Create printable fraction circle manipulatives: pick denominators, shade a fraction, and export SVG or PNG.
 Education
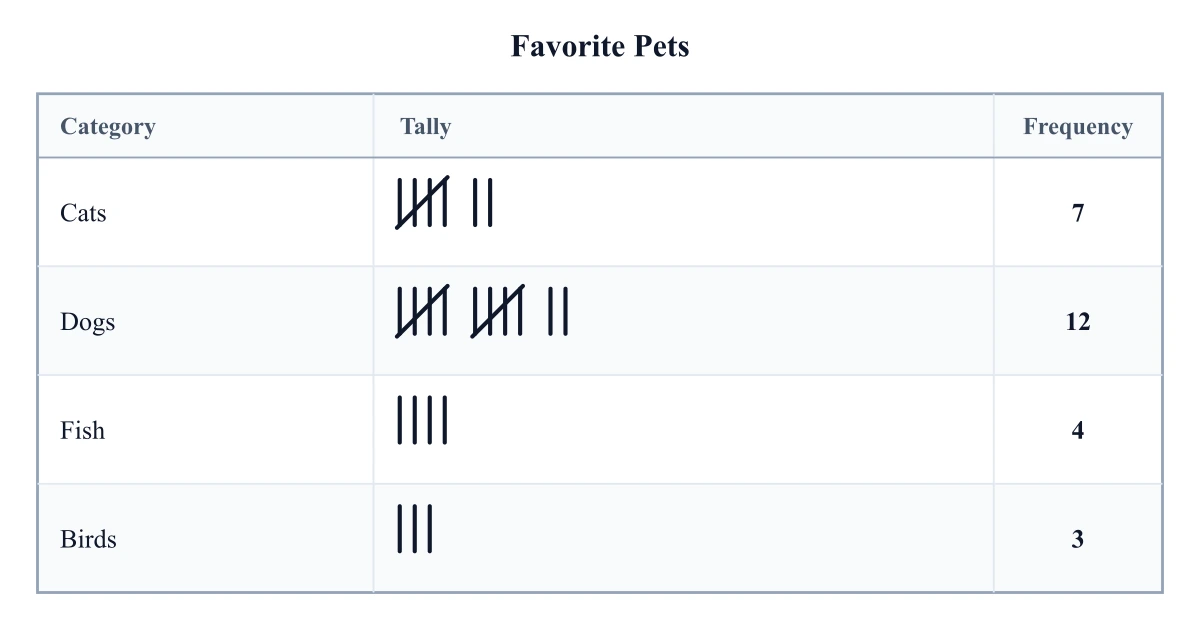
Tally Chart Generator
Make printable tally charts for data collection: record outcomes, count frequencies, and export for class.
 Education
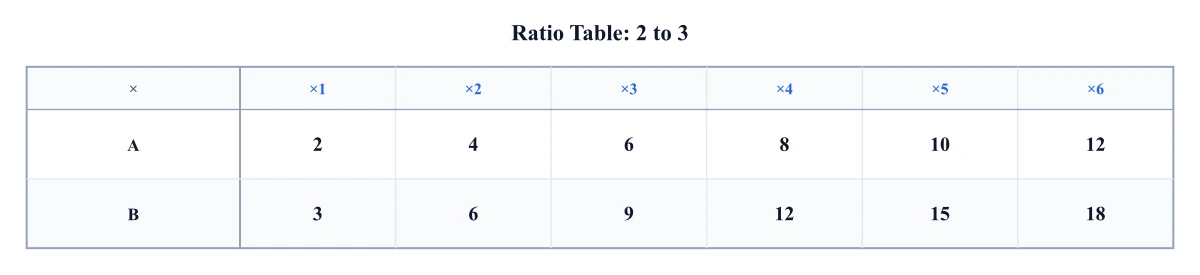
Ratio Table Generator
Build ratio tables with equivalent ratios and unit rates, ready to print for proportional reasoning practice.