Ratio Table Generator Ratio
Build a ratio table from any base ratio: generate equivalent ratios by scaling, add labels, blank cells for a worksheet, and export SVG or PNG.
6 equivalent ratios of 2:3
Ratio Table Examples
Common ways to build a ratio table
Labeled Ratio Table (2 : 3)
A clean two-row ratio table: the base ratio 2:3 scaled by ×1 through ×6 into six equivalent ratios, with a multiplier row above each column.
Unit Rate Ratio Table (Hours : Miles)
A unit-rate ratio table: 1 hour to 60 miles scaled across five columns, showing how a ratio table doubles as a speed/distance/time model.
Ratio Table Worksheet
A worksheet-style ratio table with the last column left blank, a common way teachers turn the table into a fill-in practice problem.
Recipe Scaling Ratio Table
A recipe-scaling ratio table — a favorite real-world example for teaching how equivalent ratios keep a recipe balanced at any size.
Speed Ratio Table
A speed/unit-rate ratio table example, showing hours and miles traveled as a proportional relationship.
Paint Mixing Ratio Table
A paint-mixing ratio table — another everyday proportional-reasoning example, scaling a color ratio up for a bigger batch.
What is a ratio table?
A ratio table lists a base ratio, such as 2 to 3, next to a series of equivalent ratios formed by scaling both numbers by the same amount. Multiply 2 and 3 by 2 and you get 4 and 6; multiply by 3 and you get 6 and 9 — every column keeps the same underlying relationship even though the numbers grow. Written as a two-row grid, with the first quantity on top and the second underneath, a ratio table makes it easy to see a whole family of equivalent ratios at once, compare them, and read off values that were never entered directly. This generator builds an exact ratio table from any base ratio, scaling by 1 through however many columns you choose.
Equivalent ratios, explained
- Two ratios are equivalent when one can be produced from the other by multiplying (or dividing) both terms by the same non-zero number. The ratio 2:3 and the ratio 8:12 are equivalent because 8:12 is just 2:3 scaled by 4 — the relationship between the two quantities has not changed, only the size.
- A ratio table makes this visible by generating a whole run of equivalent ratios from one base ratio: column 1 is the original ratio, and every later column is that same ratio scaled by its multiplier. Because every value is exact multiplication, there is never any rounding hidden in the table — the relationship holds column to column.
- This is also why ratio tables are the standard bridge between ratios and proportions: any two columns in the table form a true proportion, since both express the same underlying ratio at a different scale.
Using ratio tables for proportional reasoning
- Ratio tables are one of the main models used to teach proportional reasoning, because they turn an abstract relationship into a concrete, extendable pattern. Given a partial table, students can find a missing value by recognizing the scale factor between two known columns, rather than by cross-multiplying a fraction — a more intuitive first step into solving proportions.
- They also make unit rates easy to read: the column where one row equals 1 gives the "per one" rate directly. A ratio table for hours to miles at a constant speed, for example, has its unit rate sitting right in the first column.
- Because the table scales in both directions — up to larger quantities or down toward a unit rate — it works equally well for scaling a recipe up, converting units, or comparing two rates of speed.
Recipe scaling and unit rate examples
- A common classroom use is recipe scaling: if a recipe calls for 2 cups of flour to 3 cups of sugar, a ratio table shows exactly how much of each ingredient a bigger batch needs — double the recipe and you need 4 cups of flour to 6 cups of sugar, triple it and it is 6 to 9, and so on.
- Another common use is a unit rate, such as speed: if a car travels 60 miles every hour, a ratio table with hours on top and miles below shows the distance traveled after 2, 3, 4, or 5 hours, all built from the same 1-hour unit rate.
- Both examples use the exact same underlying structure — a base ratio scaled by a whole-number multiplier — which is why the ratio table model transfers so easily across recipes, unit rates, unit conversions, and speed/distance/time problems.
Free tool, printable and exportable
- Enter any base ratio, add labels for each row (like "Cups of flour" and "Cups of sugar", or "Hours" and "Miles"), and choose how many columns to generate.
- Turn on worksheet mode to blank out the last two columns for a fill-in practice problem, add an optional title, and pick an accent color for the multiplier row.
- Everything renders in your browser and exports as a crisp SVG or a high-resolution PNG, so the ratio table prints sharply at any size and drops cleanly into worksheets, slides, or handouts.
Frequently Asked Questions
Related Math Tools
 Education
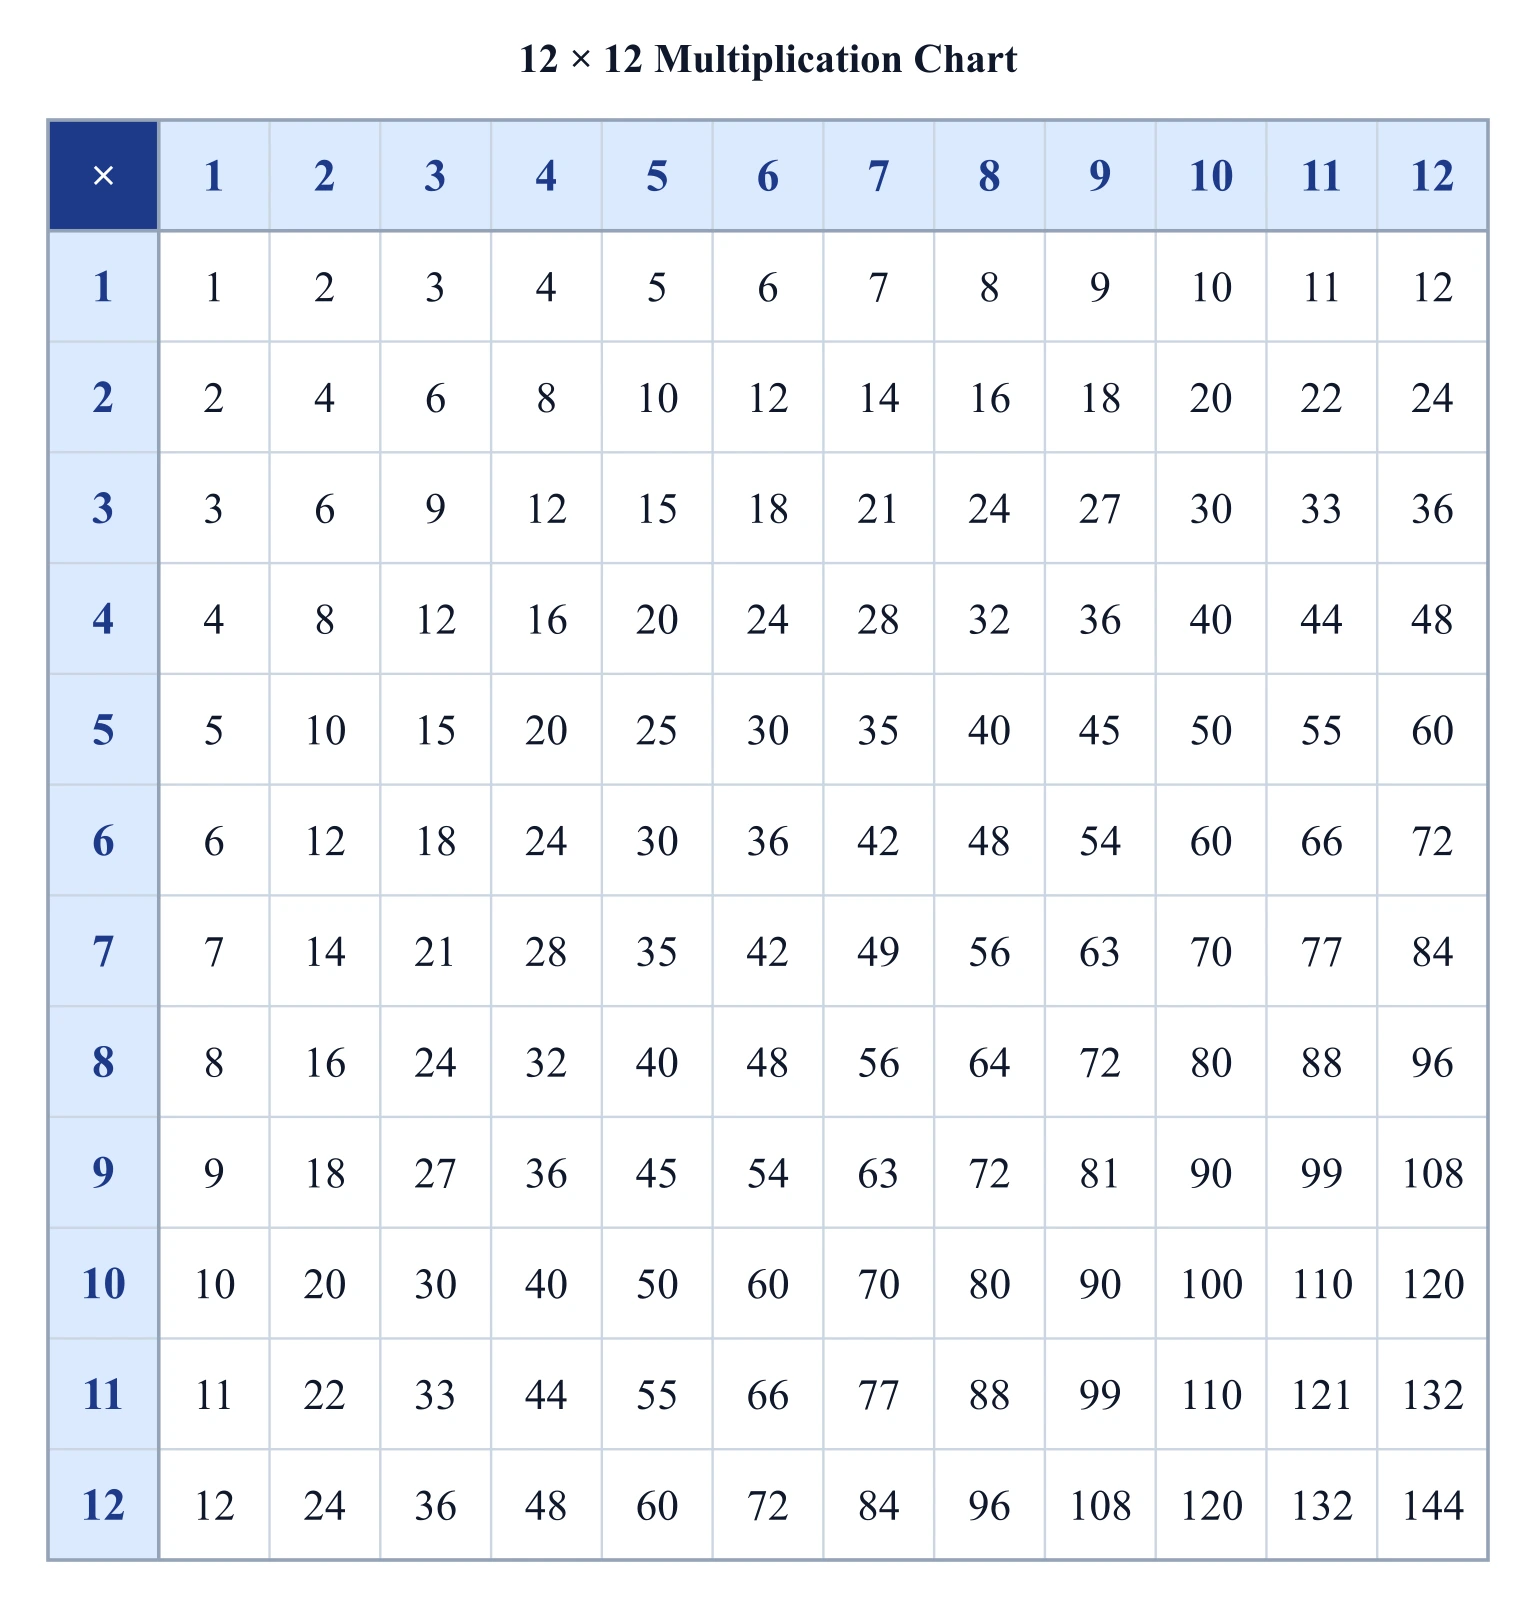
Multiplication Chart Generator
Create a printable multiplication chart: pick the grid size, highlight any times table, and export a clean SVG or PNG.
 Education
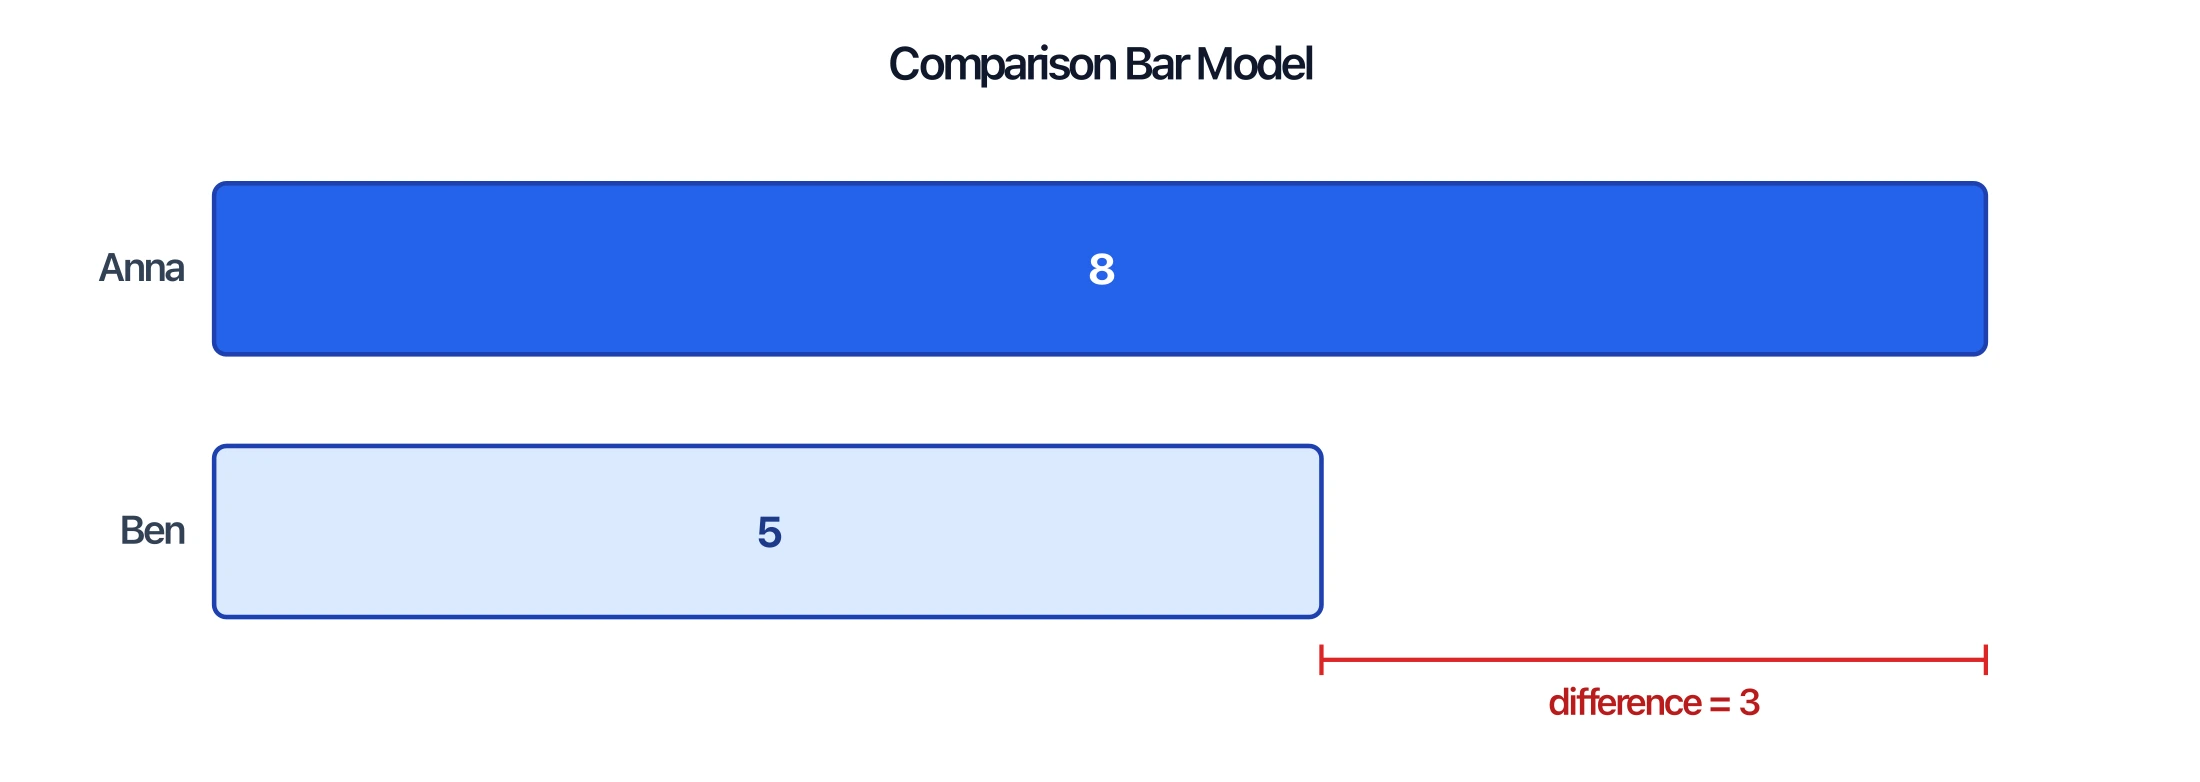
Tape Diagram Generator
Build tape diagrams (bar models) for ratios, fractions, and word problems — comparison and part-whole layouts, exportable as SVG or PNG.
 Education
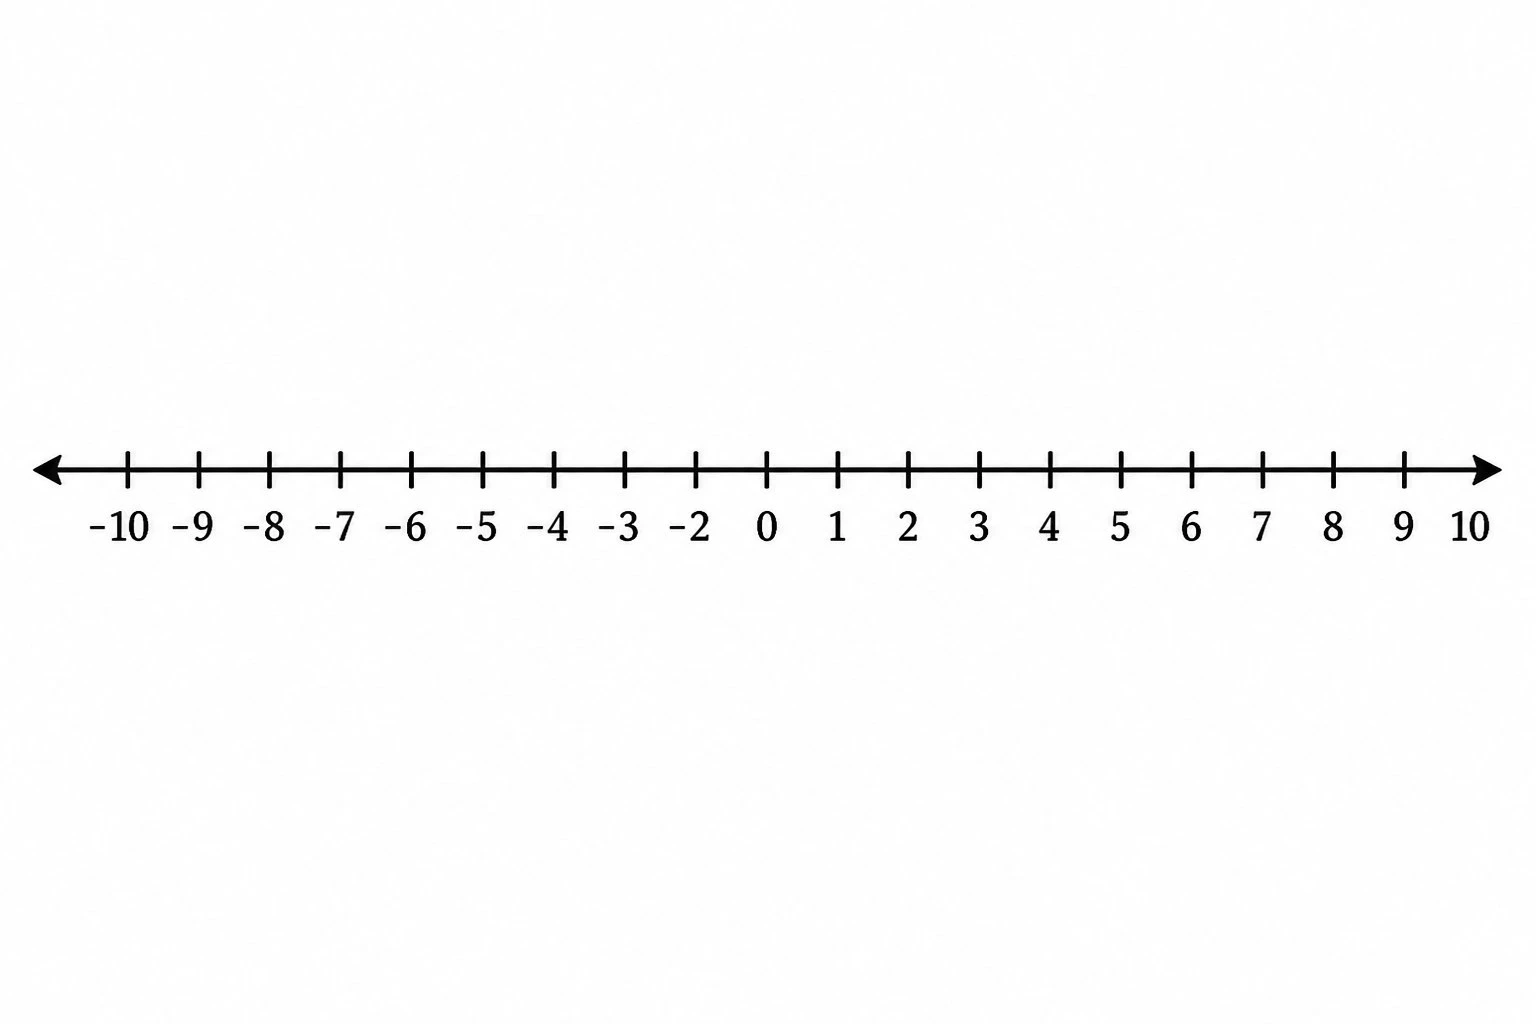
Number Line Generator
Create precise number lines: plot points, graph inequalities and intervals, and mark fractions or decimals.