PPT Text to Visual Converter for Slide Text
Turn dense PowerPoint text into a clean visual with AI. Paste your slide bullet points or describe the idea, and generate a chart, diagram, or infographic to replace the wall of text — landscape, square, or portrait.
PPT Text to Visual Converter
Free to try ·
Your presentation visual will appear here
AI-generated visual — review the labels before adding it to your slide
PPT Text to Visual Examples
Slide text turned into charts, diagrams, timelines, and infographics
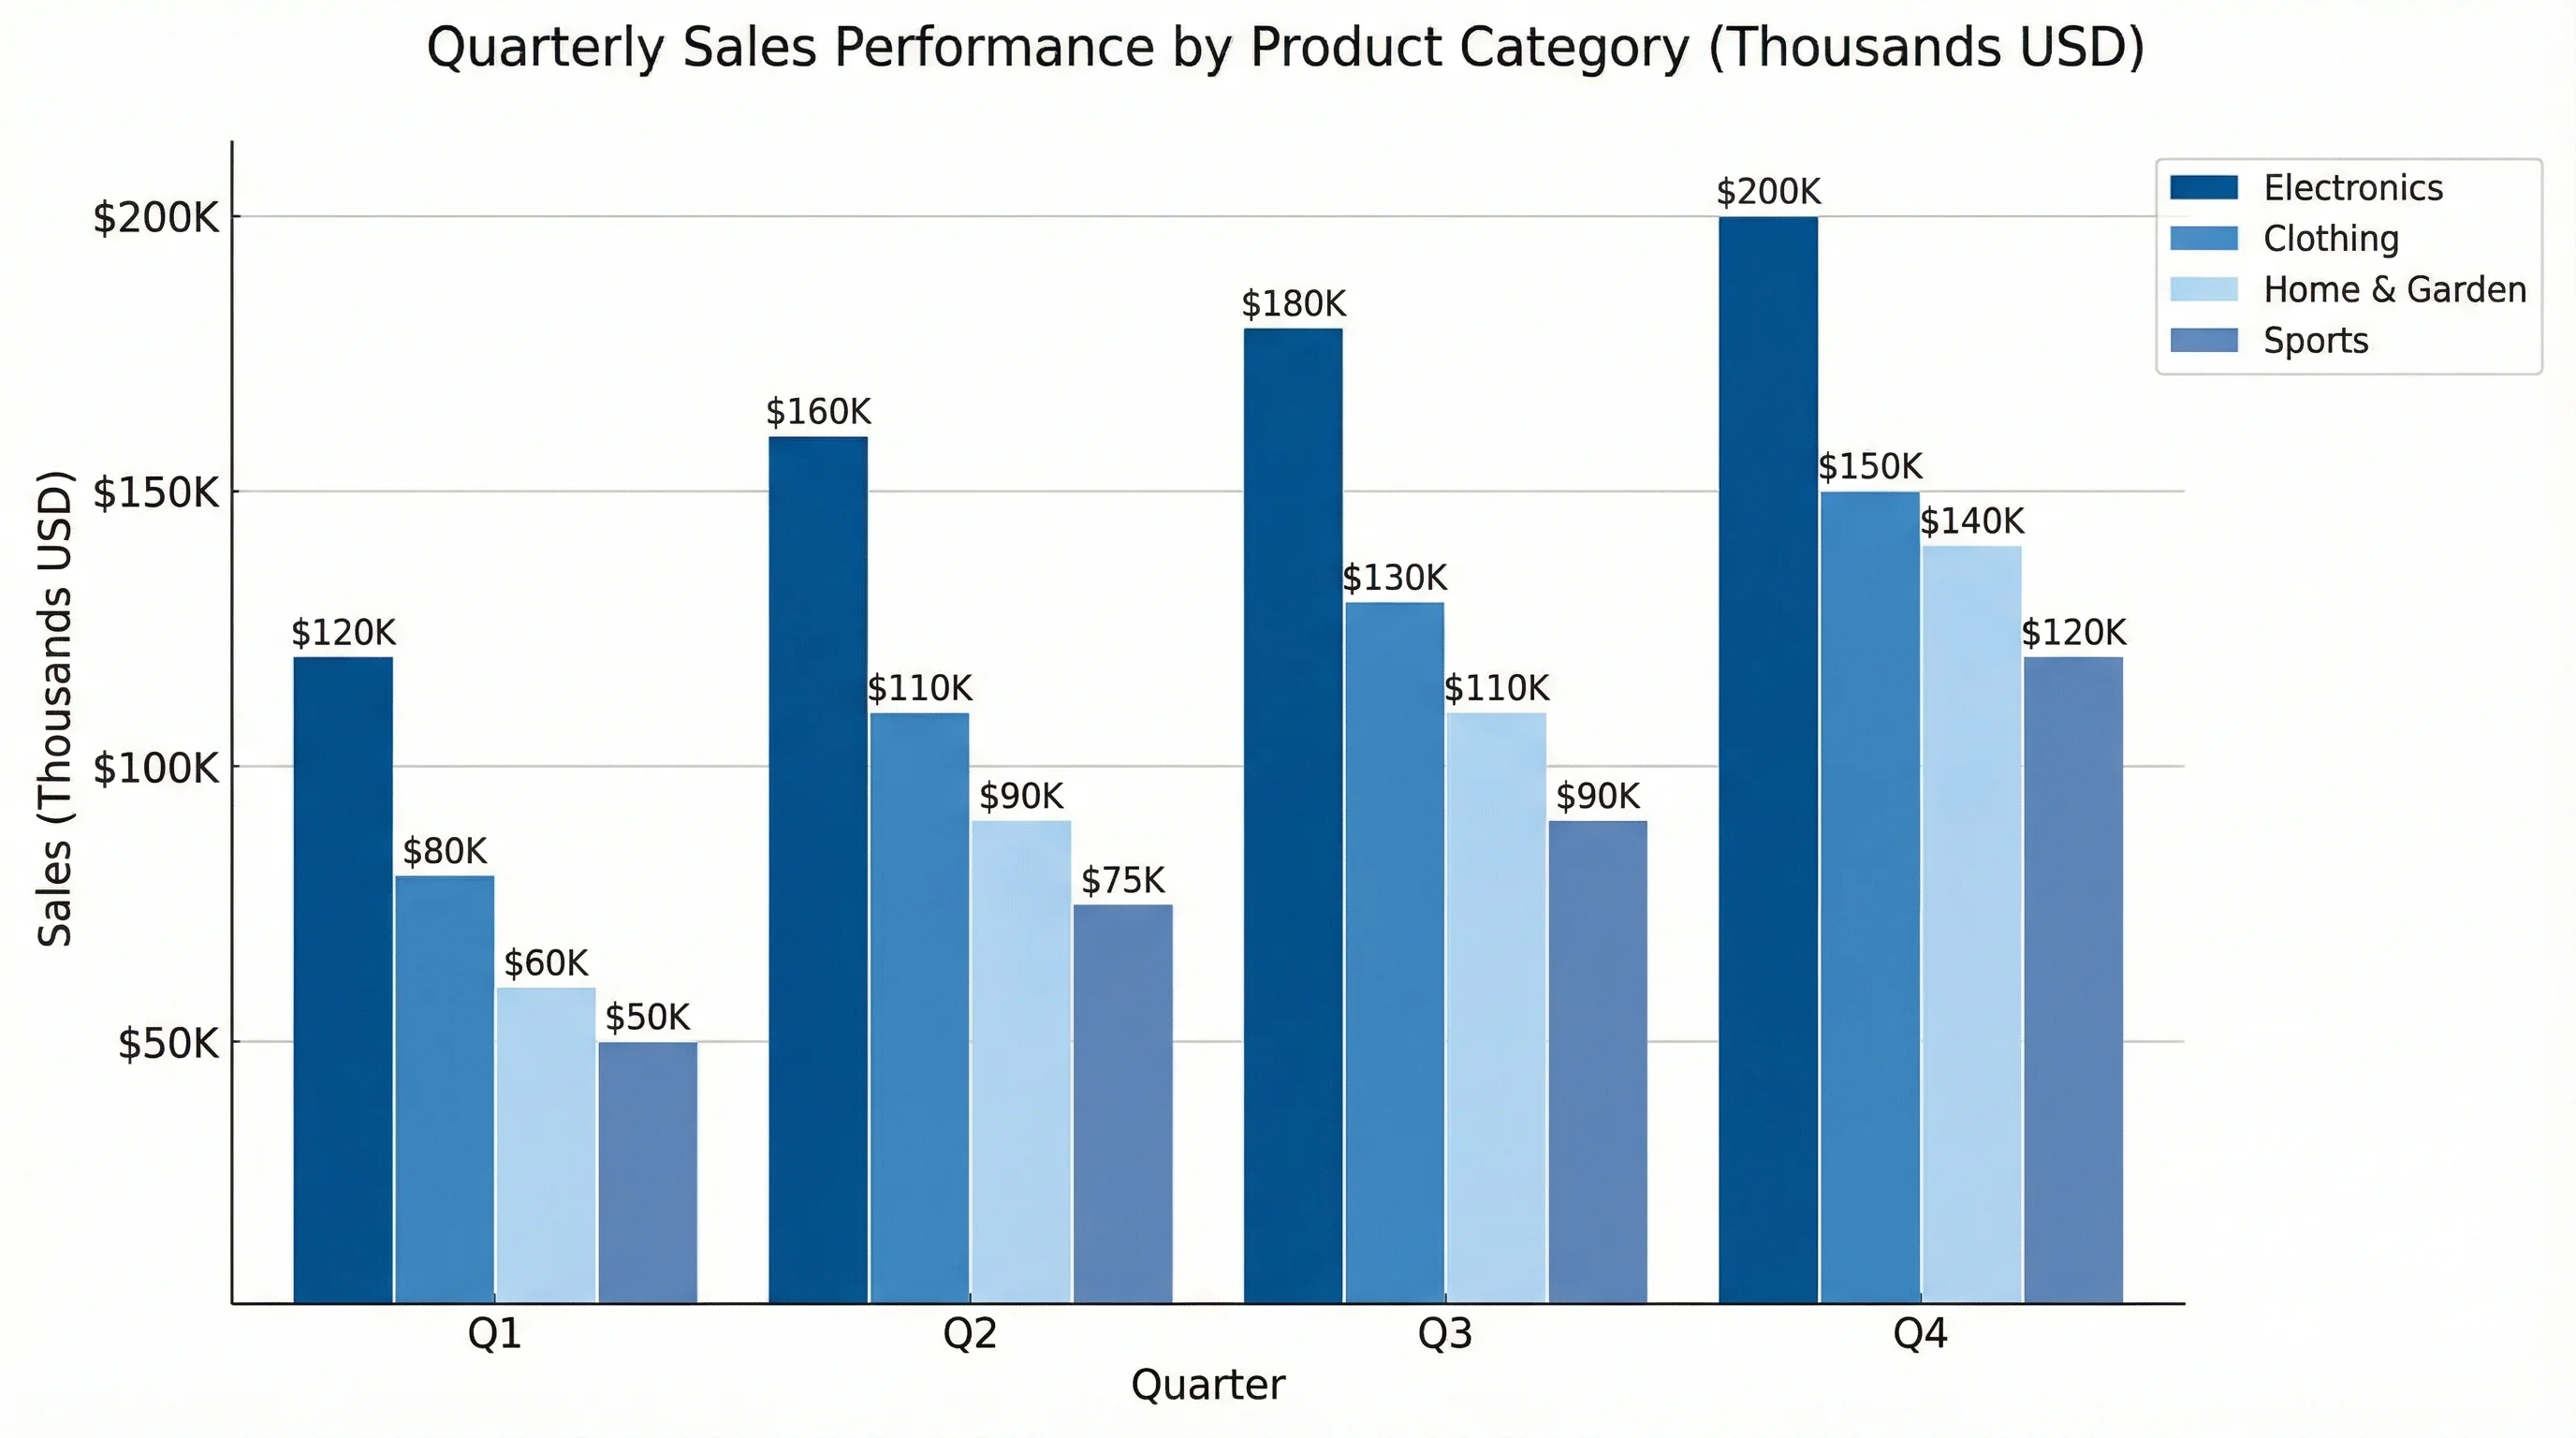
Bullet Points to Chart
A slide full of numbers becomes one clean comparison chart your audience reads in a second.
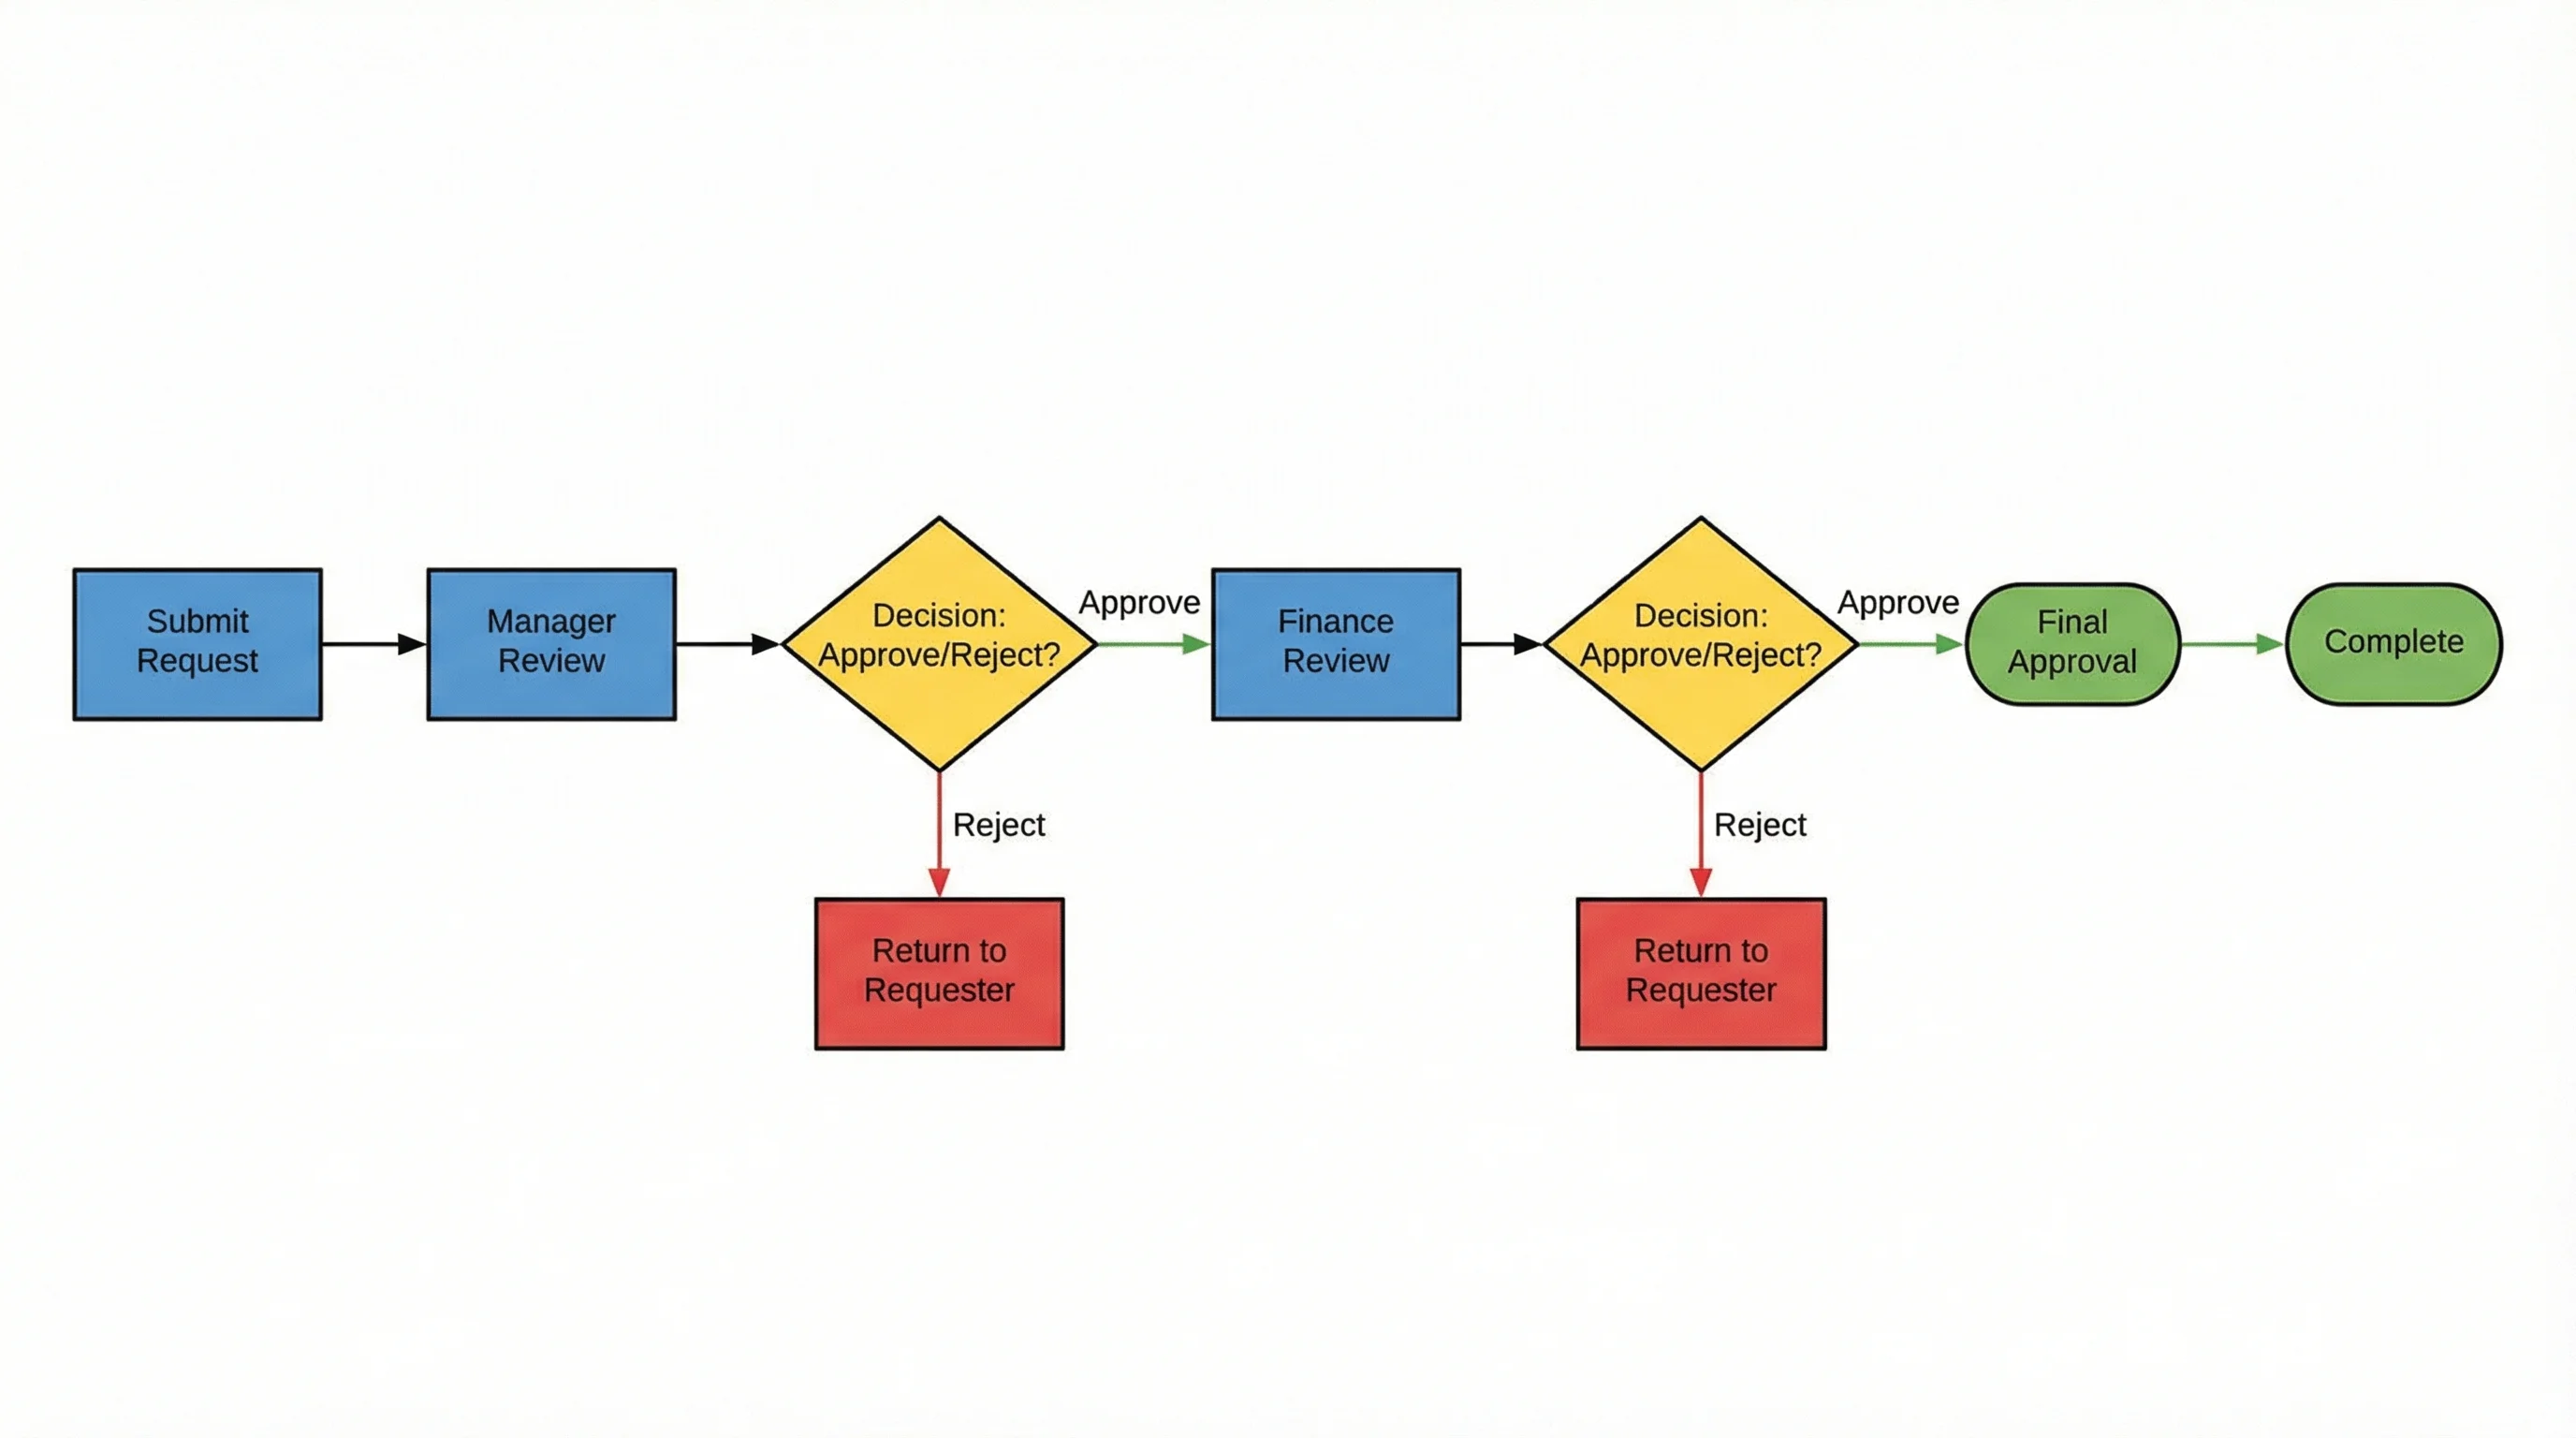
Steps to Process Diagram
A numbered list of steps turns into a flow diagram that shows the sequence at a glance.
Text to Relationship Map
Describe how things connect and get a relationship map instead of three lines of explanation.
Dates to Timeline
A list of dates and milestones becomes a horizontal timeline that reads left to right.
Roles to Org Chart
Names and titles in a paragraph become a clear hierarchy chart for a team or company slide.
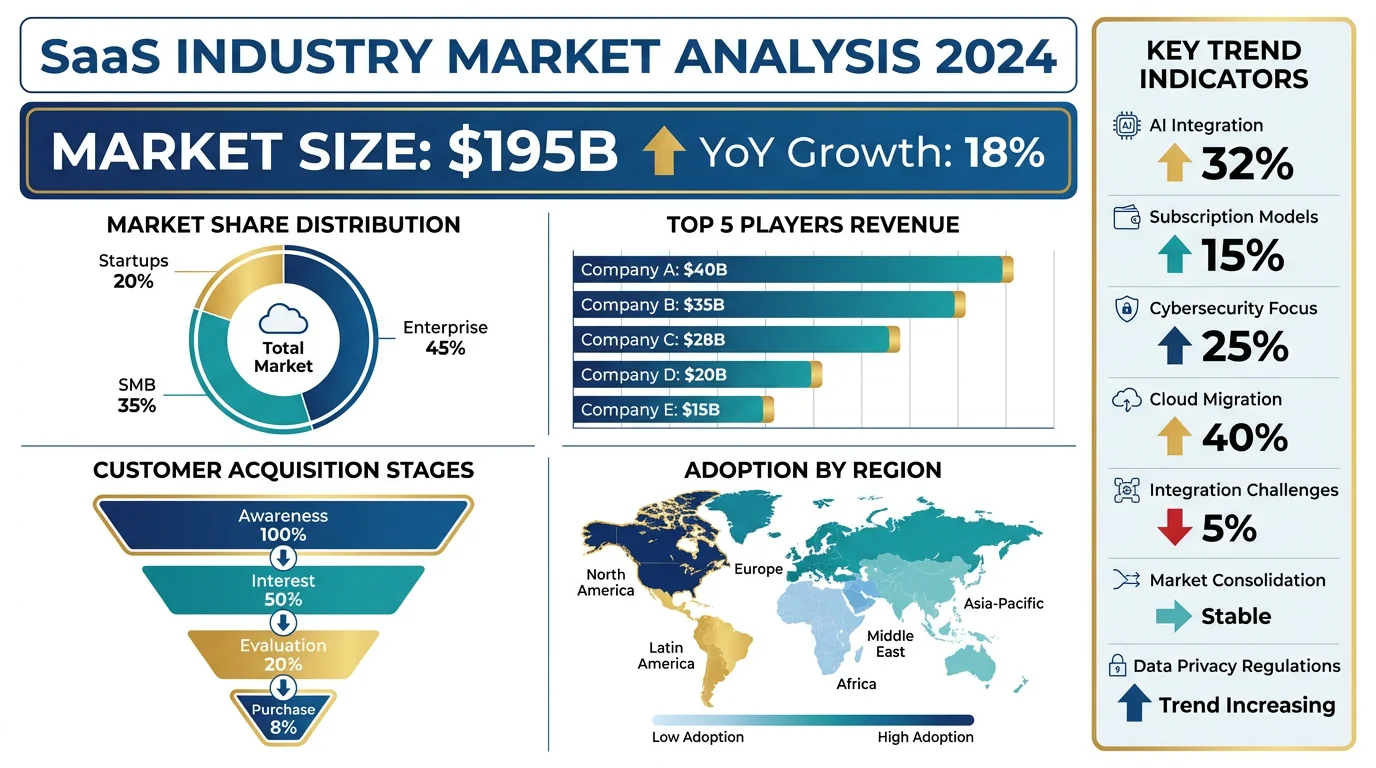
Stats to Infographic
Four scattered statistics become a tidy infographic with one number per tile.
Turn PowerPoint text into a visual
Wall-of-text slides lose the room. This tool turns the text from a PowerPoint slide into a single clear visual — a chart, a process diagram, a relationship map, or an infographic — so the idea lands instead of being read aloud bullet by bullet. Paste the slide text or describe the point you want to make, choose a shape that fits the screen, and the AI generates a presentation-ready graphic you can drop straight back into your deck.
How to convert slide text to a graphic
- Copy the text from your slide — the bullet points, the list of steps, or the numbers — or just describe the idea in plain English.
- Paste or type it into the prompt box and say what kind of visual you want: a chart, a flow diagram, a timeline, an org chart, or an infographic.
- Pick an aspect ratio — 16:9 for a slide, 1:1 for social, or 3:4 for a portrait handout.
- Generate the visual, then download it and place it on your slide in place of the text block.
What kinds of visuals you can make
The converter is built for the visuals presenters actually need: bar and comparison charts for numbers, process and flow diagrams for steps and workflows, timelines and roadmaps for plans, org charts and hierarchies for teams, relationship maps for how ideas connect, and stat infographics for key metrics. Describe the data or the relationship in words and the AI lays it out with a clean hierarchy, a consistent color scheme, and a white background that sits comfortably on a slide.
Why dense slides need a visual
Audiences cannot read a paragraph and listen to you at the same time, so a bullet-heavy slide competes with your voice and usually loses. Replacing the text with one visual gives people a single thing to look at while you talk, and a chart or diagram carries the relationship — bigger, sequence, share, hierarchy — far faster than a sentence. The goal is not to decorate the slide; it is to move the detail off the screen and into a shape the eye can grasp at a glance.
Great for teaching and lectures
Teachers and lecturers face the same problem on a larger scale: a definition or a process is far easier to follow as a labeled diagram than as a block of text on a projector. Turn a list of steps into a flow diagram, a set of dates into a timeline, or a comparison into a chart, and students get a visual they can copy into their notes. Because you can generate a portrait (3:4) version, the same visual also works as a handout or a worksheet, not just an on-screen slide.
An honest note on AI-generated visuals
This is an AI image generator, so the visuals are illustrative rather than data-precise: it lays out a chart or diagram from your description, but it does not plot exact values from a spreadsheet or guarantee perfectly rendered text and numbers. Treat the output as a polished visual concept — review the labels, and for a strictly accurate chart from real data, plug your numbers into a dedicated chart tool. For replacing a dense slide with a clear, presentation-ready graphic, describing what you want and generating it is fast and works well.
Frequently Asked Questions
Related Presentation Tools
 Visualization
AI Infographic Generator
Turn your key points and stats into a clean, shareable infographic for slides.
 Visualization
AI Chart Generator
Describe your numbers and generate a presentation-ready bar, line, or pie chart.
 Visualization
AI Flowchart Generator
Convert a list of steps into a clear flowchart or process diagram for your deck.