P&ID Maker for Piping & Instrumentation Diagrams
Create piping and instrumentation diagrams (P&IDs) with AI. Describe your process — tanks, pumps, valves, heat exchangers, and instruments — and get a clean P&ID with standard ISA symbols and instrument tags. Download as PNG.
AI P&ID Maker
Free to try ·
Your P&ID will appear here
Describe vessels, pumps, valves, and instruments
P&ID Examples
Process systems drawn with standard ISA symbols and instrument tags
Tank → Pump → Heat Exchanger
A complete small system with valves, a level transmitter, and a flow control loop.
P&ID / ISA Symbols
The standard ISA symbols — valves, pumps, vessels, and instrument bubbles.
Control Loop (FT–FIC–FCV)
A feedback loop — transmitter → controller → control valve, with instrument tags.
Distillation Column
A full unit operation — column, reboiler, condenser, reflux drum, and instruments.
Stirred-Tank Reactor
A reactor with feed control, agitation, jacket cooling, and pressure/temperature loops.
Parallel Pumps
Two pumps in parallel (one spare) with isolation and check valves — a common layout.
What is a P&ID?
A P&ID (Piping and Instrumentation Diagram) is a detailed engineering drawing that shows the equipment, piping, valves, and instrumentation of a process, along with the control loops that run it. P&IDs use standardized ISA symbols and instrument tags (like TT-101 for a temperature transmitter) so that engineers, operators, and maintenance teams share one precise picture of how a plant is built and controlled.
P&ID vs PFD: what is the difference?
A Process Flow Diagram (PFD) shows the big picture — the major equipment and how material flows through the process, often with stream data. A P&ID is far more detailed: it adds every pipe, valve, instrument, and control loop. In short, the PFD is conceptual and the P&ID is the construction- and operation-level drawing. This tool focuses on P&IDs with full symbols and tags.
Common P&ID (ISA) symbols
- Valves: gate, globe, check, ball, and control valves each have their own symbol.
- Equipment: vessels and tanks, pumps, compressors, and heat exchangers.
- Instruments: circular "bubbles" denote field instruments, with letters for the measured variable and function (e.g., FT = flow transmitter, LIC = level indicating controller).
- Lines: solid lines are process piping; dashed or dotted lines are instrument signals.
Reading instrument tags
Instrument tags follow ISA-5.1: the first letter is the measured variable (T = temperature, F = flow, L = level, P = pressure) and the following letters are the function (T = transmitter, I = indicator, C = controller, V = valve). So FT-101 is flow transmitter 101, and FCV-102 is flow control valve 102. Describe your loops and the generator labels them with this convention.
How to make a P&ID with AI
Describe your process system in plain language — the vessels, pumps, heat exchangers, valves, and the control loops you need — and the tool draws a P&ID with the standard symbols and instrument tags. The more specific you are (e.g., "a level control loop on the tank that throttles the inlet valve"), the more accurate the diagram. Generate a few options, pick the clearest, and download it.
Frequently Asked Questions
Related Engineering Tools
 Engineering
Schematic Diagram Maker
Create technical schematic diagrams for systems, equipment, and processes.
 Engineering
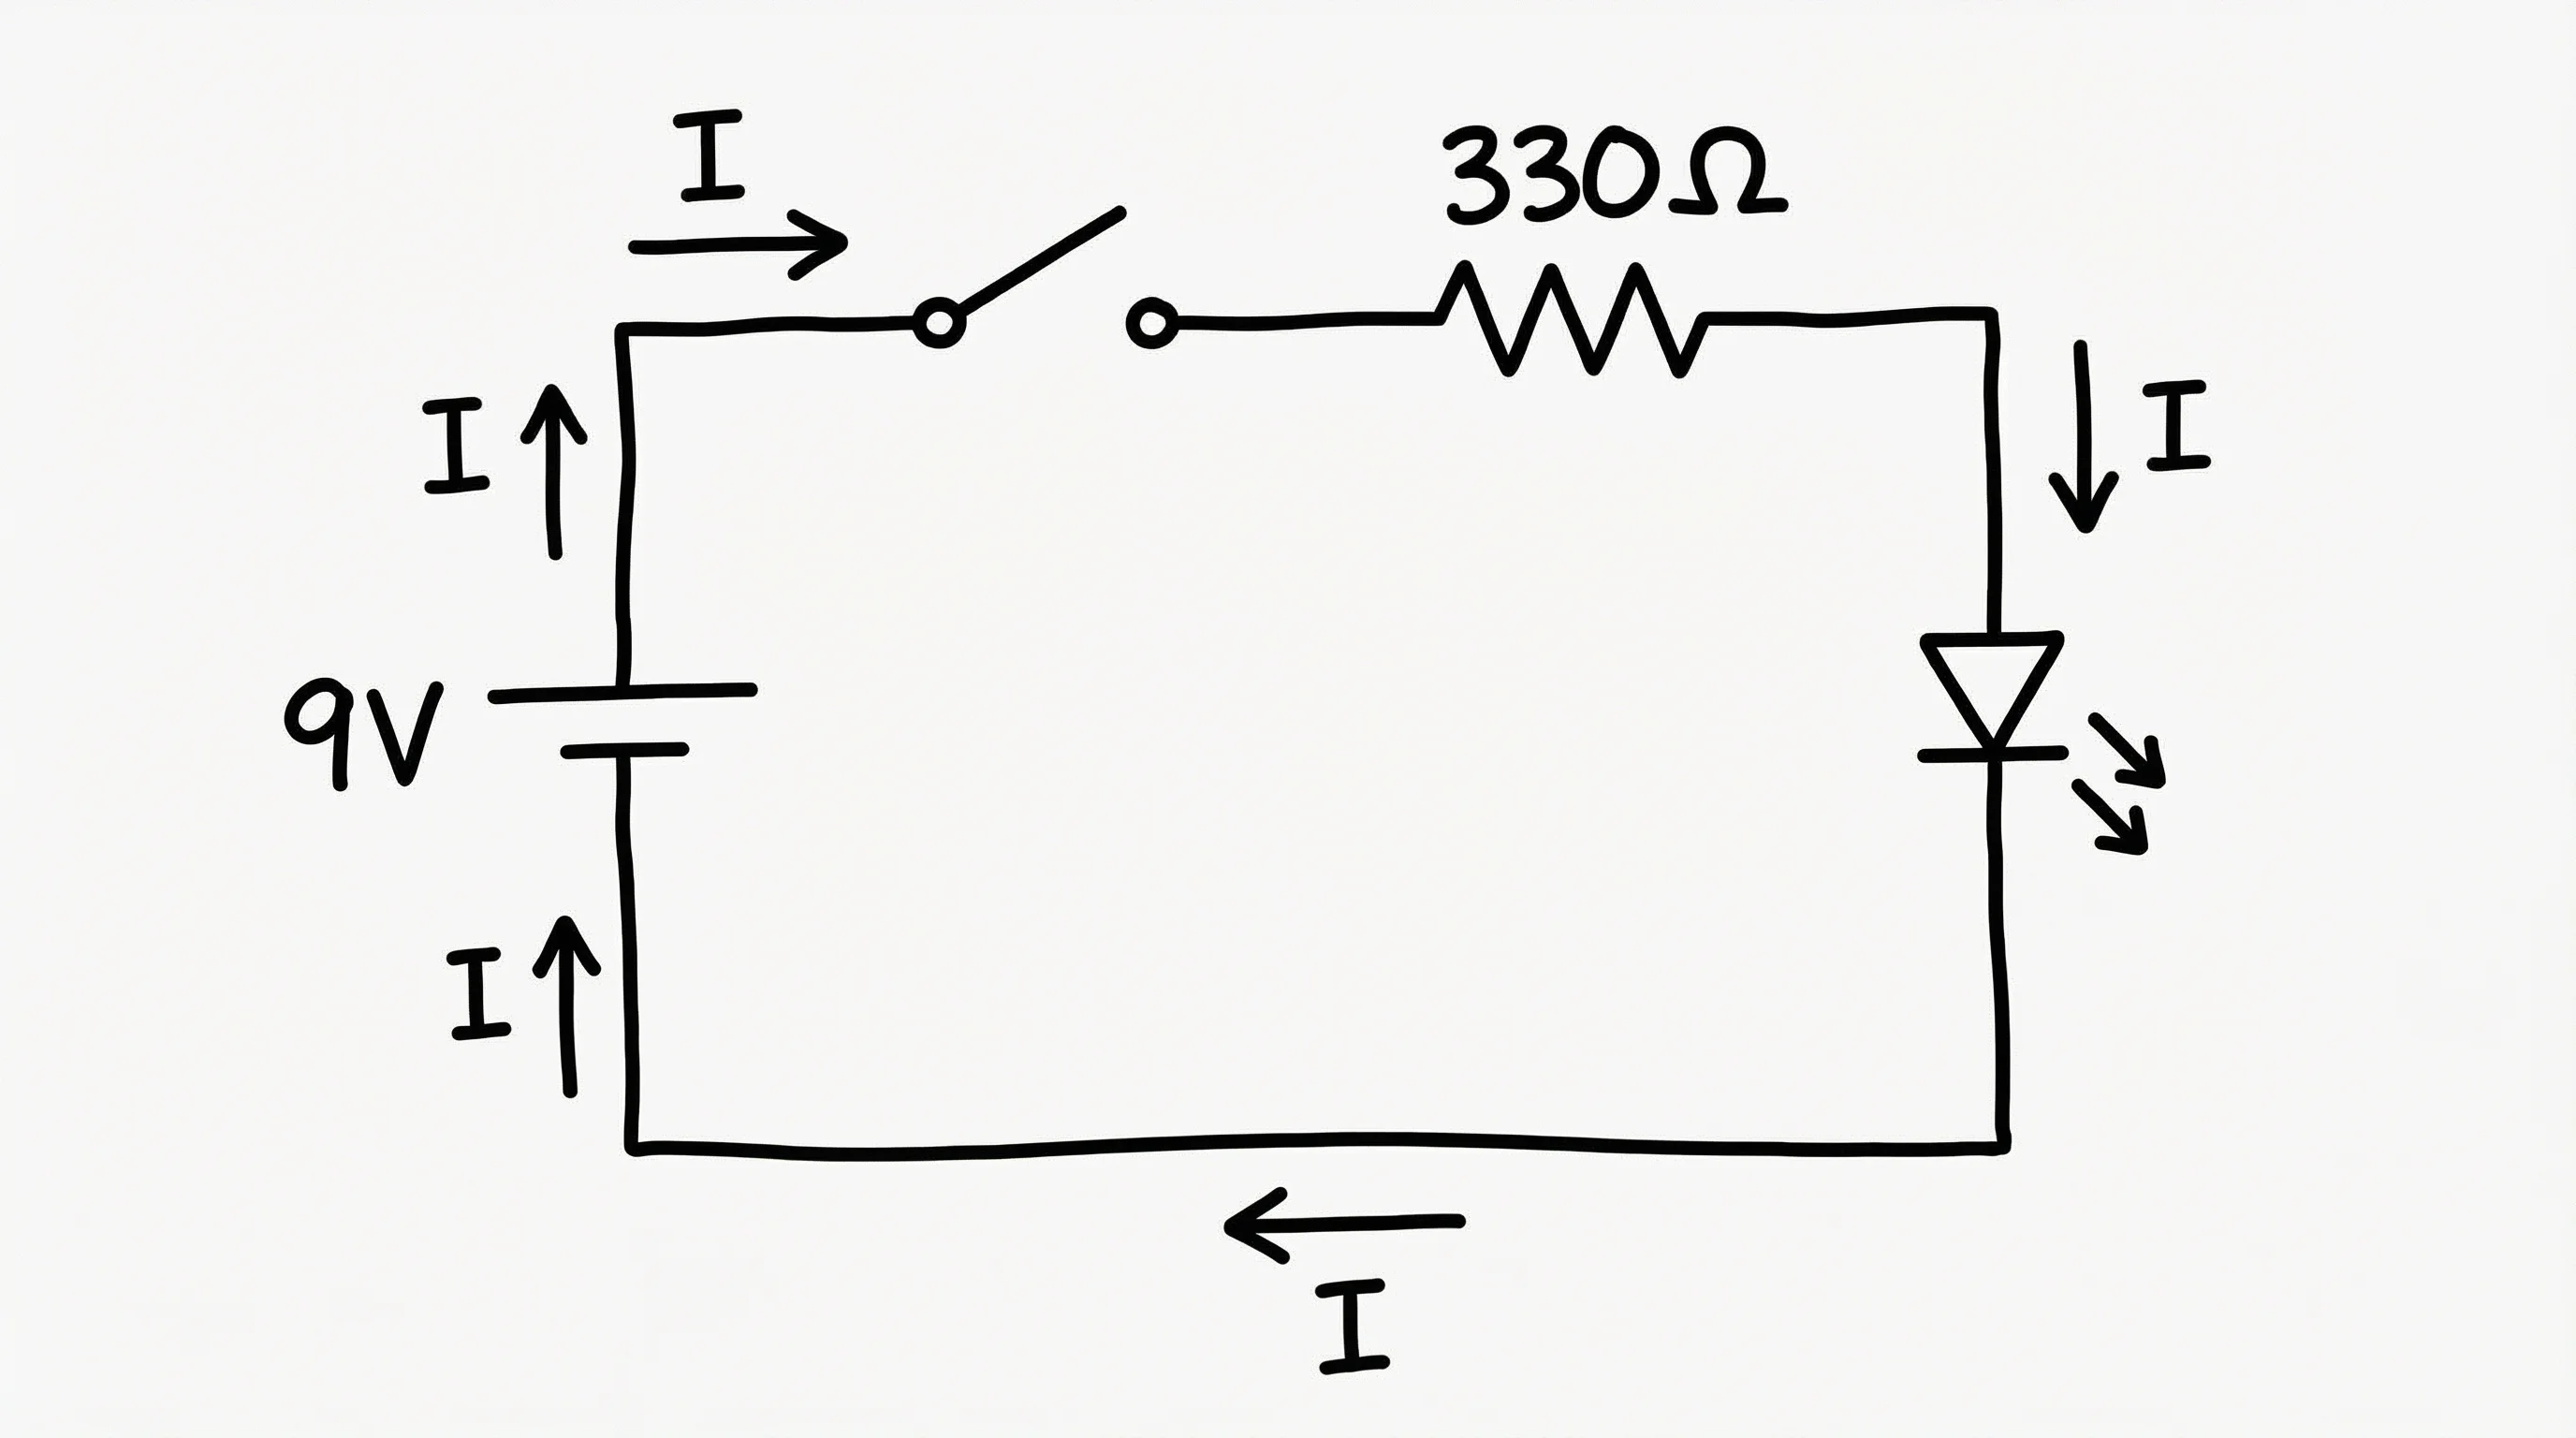
Circuit Diagram Maker
Draw electrical and electronic circuit diagrams with standard component symbols.
 Software
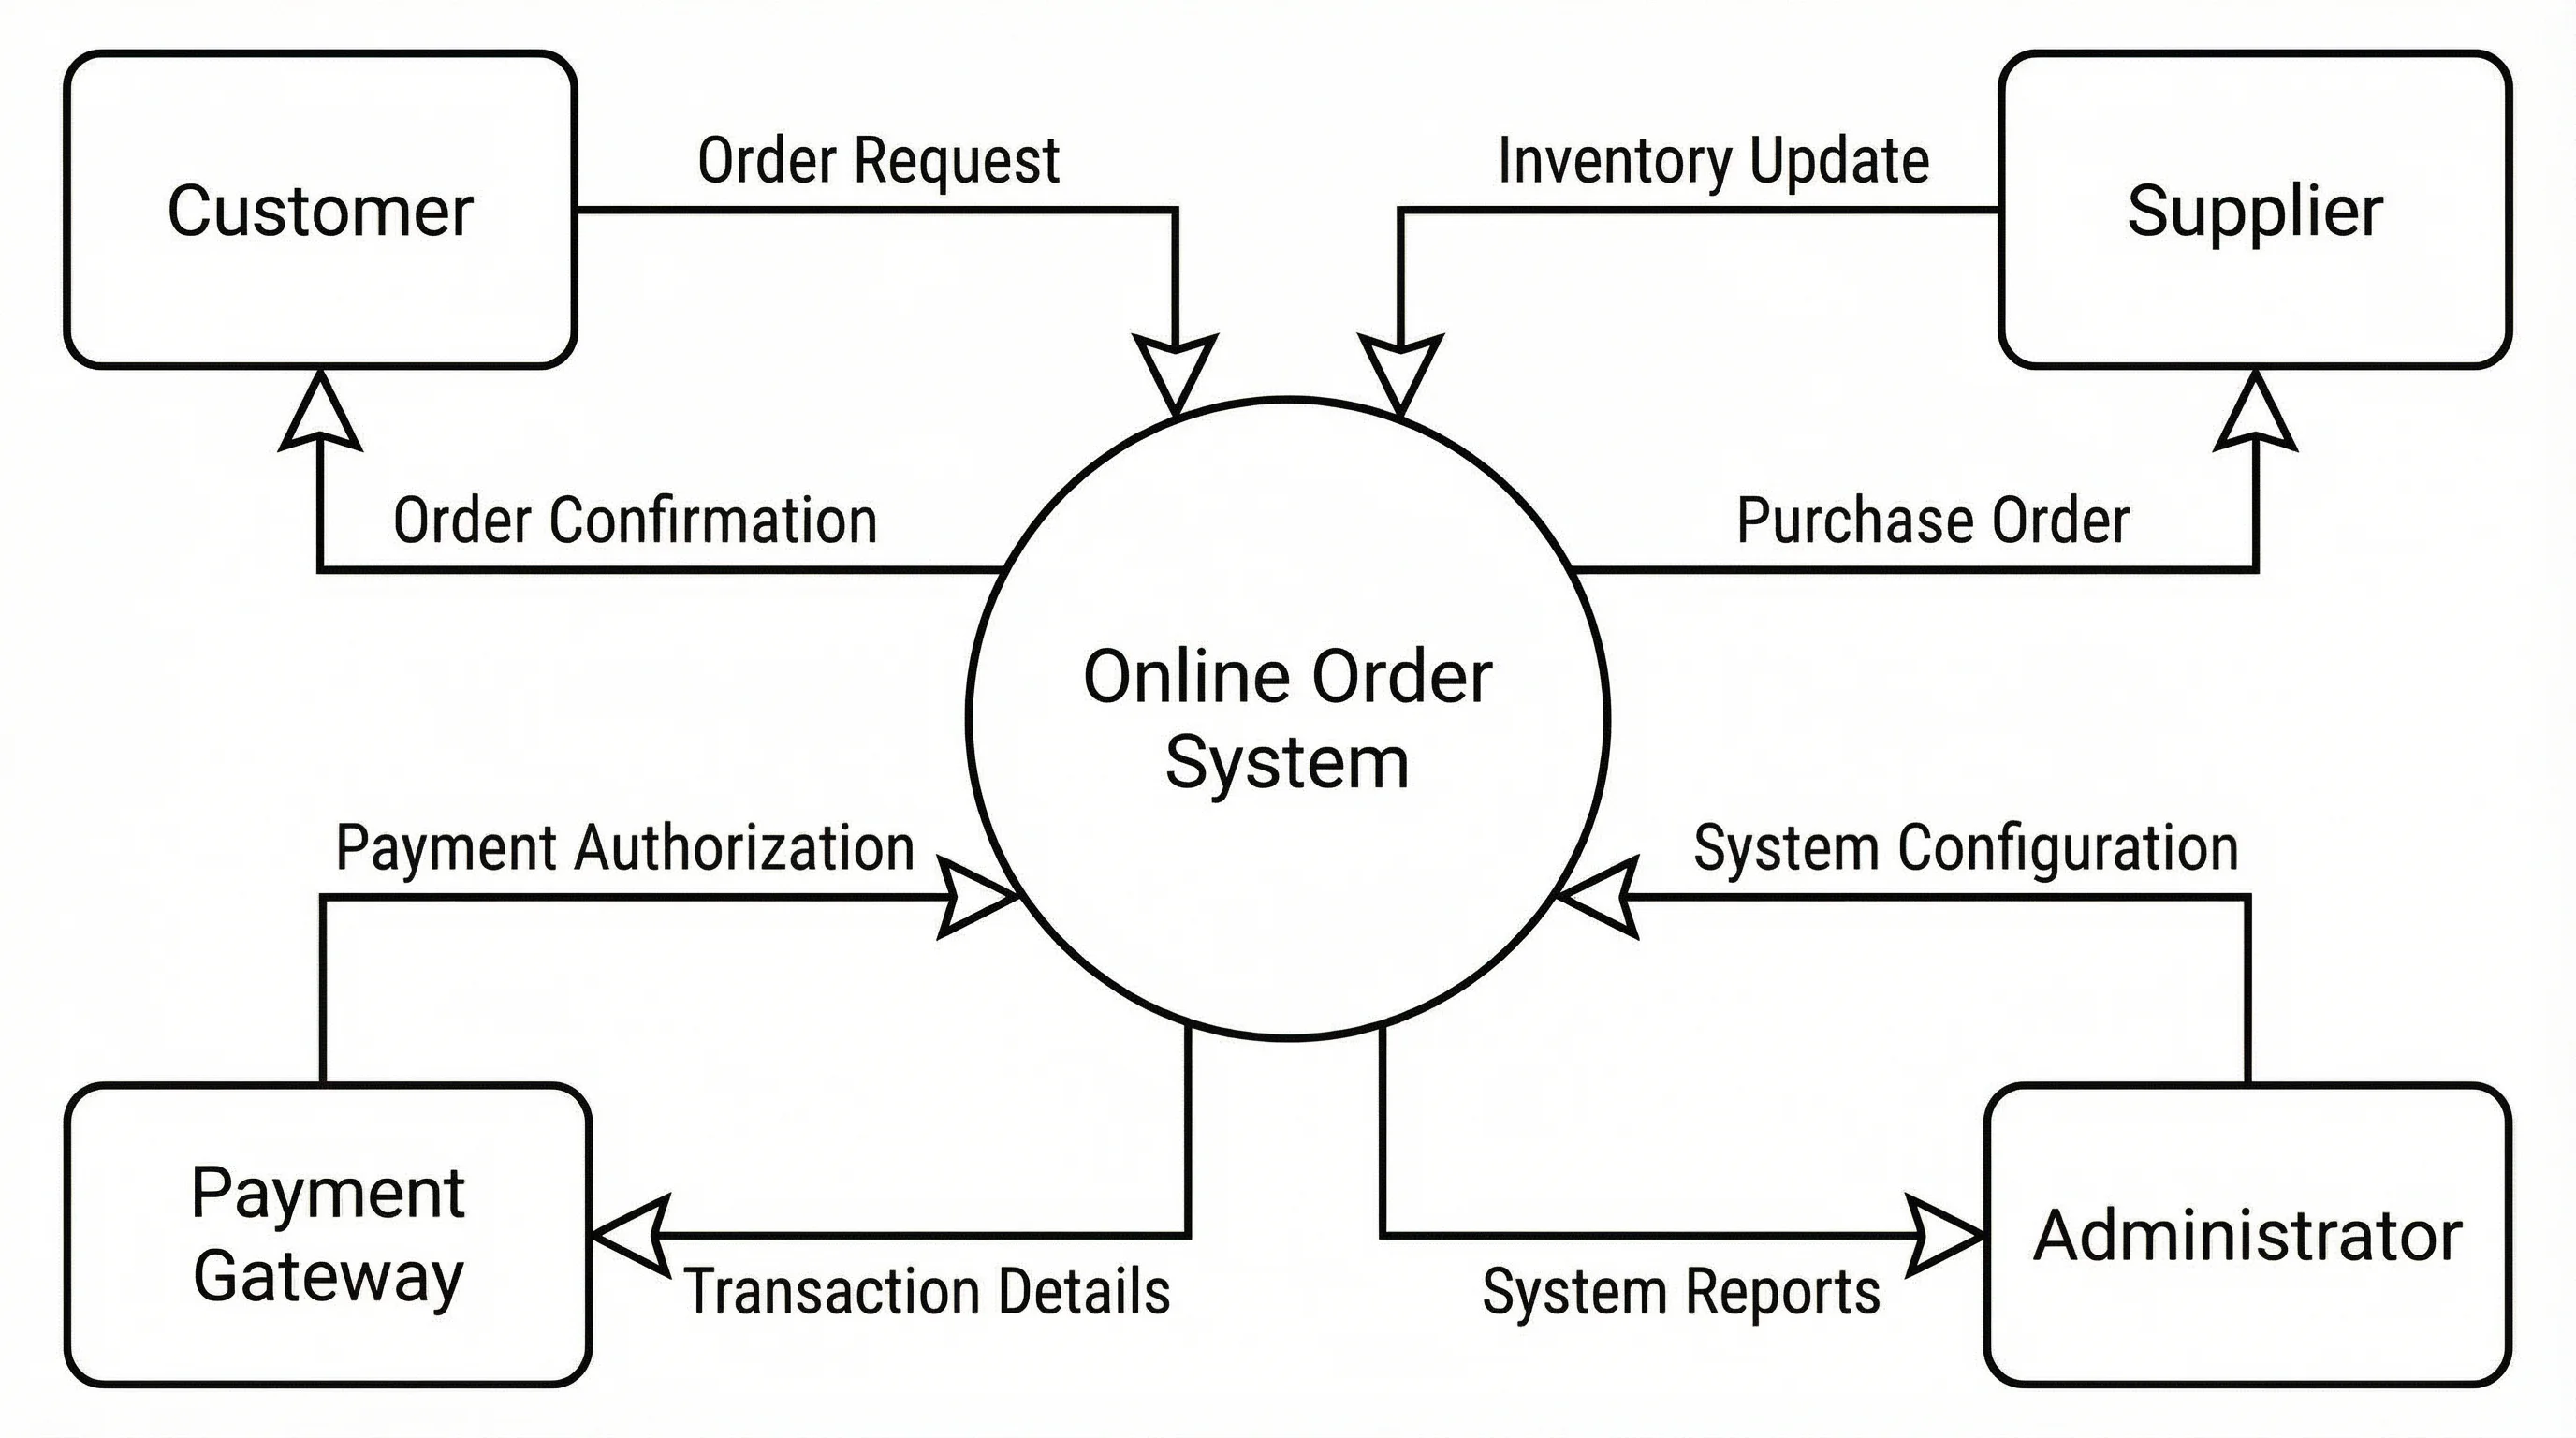
Data Flow Diagram Generator
Create data flow diagrams (DFDs) showing processes, data stores, and flows.