Pictograph Generator Make a Picture Graph
Make a pictograph (picture graph) online: pick an icon, set the key value, enter categories, and export a clean SVG or PNG — half icons included.
Categories (label & value)
Pictograph Examples
Common ways to build and label a picture graph
Labeled Pictograph
A clean pictograph with labeled category rows of repeated icons and a clear key.
Pictograph With a Key
A picture graph with a prominent key showing what each icon represents.
Pictograph With Half Icons
A pictograph that draws partial half icons to represent values between key steps.
Favorite Fruits Pictograph
A favorite-fruits picture graph with apple icons and a two-per-icon key.
Pets Survey Pictograph
A pets-survey picture graph with a labeled row of icons for each pet type.
Blank Pictograph Template
A blank picture-graph template with labeled rows and a key, ready for students to fill in.
What is a pictograph?
A pictograph — also called a pictogram or picture graph — shows data with pictures instead of bars. Each category gets its own row, and along that row a small icon is repeated to represent the category's value. A key (also called a legend) tells you how much one icon is worth: it might say "each apple = 2 students". To read a value, you count the icons in a row and multiply by the key. If a class has 8 apple-lovers and each apple stands for 2 students, the apple row shows 4 apples. Because the picture makes quantities easy to compare at a glance, pictographs are one of the first graph types students meet in elementary math, and they stay useful in infographics and reports. This generator draws every row exactly from the numbers you enter, so the icon counts and the key always agree.
Reading the key
- The key is the most important part of a pictograph, because the same picture can mean very different amounts. One icon might represent 1, 2, 5, 10, or any value the maker chose — so always read the key before counting.
- To find a category total, count the full icons in its row, multiply by the key value, then add the value of any partial icon. With a key of 5, a row of three full books plus a half book means 3 × 5 + (0.5 × 5) = 17.5.
- Choosing a good key keeps rows short and readable. If your largest value is 40, a key of 1 would draw 40 tiny icons; a key of 5 or 10 makes a cleaner graph. In this tool you set the value per icon, and every row is redrawn to match.
Drawing partial and half icons
- Real data rarely divides evenly by the key, so pictographs use partial icons for the remainder. If each icon is worth 2 and a category has 5, that is 2 full icons plus a half icon, because the leftover 1 is half of 2.
- This generator computes the fraction exactly — value ÷ key gives the number of icons, the whole-number part is drawn as full icons, and the fractional part is drawn as a single icon clipped horizontally to that width. A quarter value shows a quarter-width icon; three-quarters shows a three-quarter icon.
- Partial icons are what make pictographs precise. Without them a value of 5 with a key of 2 would round to 2 or 3 icons and lose information; the half icon keeps the graph honest.
Making a pictograph from your data
- Start with a table of categories and counts — favorite fruits, books read, pets owned, votes for each option. Type each label and its value into the tool, then pick an icon that fits the theme (apples for fruit, books for reading, hearts or stars for a survey).
- Next choose the value per icon. A small key shows detail but makes long rows; a larger key keeps the graph compact. The preview updates instantly, so try a couple of key values and keep the one that reads cleanly.
- When it looks right, export a crisp SVG for print or a high-resolution PNG for slides and worksheets. Because the drawing is generated from your numbers, the icons, labels, and key stay perfectly aligned.
Tips for teachers and students
- Ask students to predict a total before counting, then check by counting icons and multiplying by the key — it builds the multiplication-and-remainder reasoning pictographs are meant to teach.
- Use a blank template as a worksheet: give students the data and the key and have them draw the correct number of icons, including any half icon, for each row.
- Keep categories to a handful and labels short so rows line up neatly. Everything renders in your browser and exports cleanly, so the same graph works on a worksheet, a slide, or a classroom wall.
Frequently Asked Questions
Related Math Tools
 Education
Bar Chart Maker
Create clean bar charts from your data: labeled categories, values, colors, and SVG or PNG export.
 Education
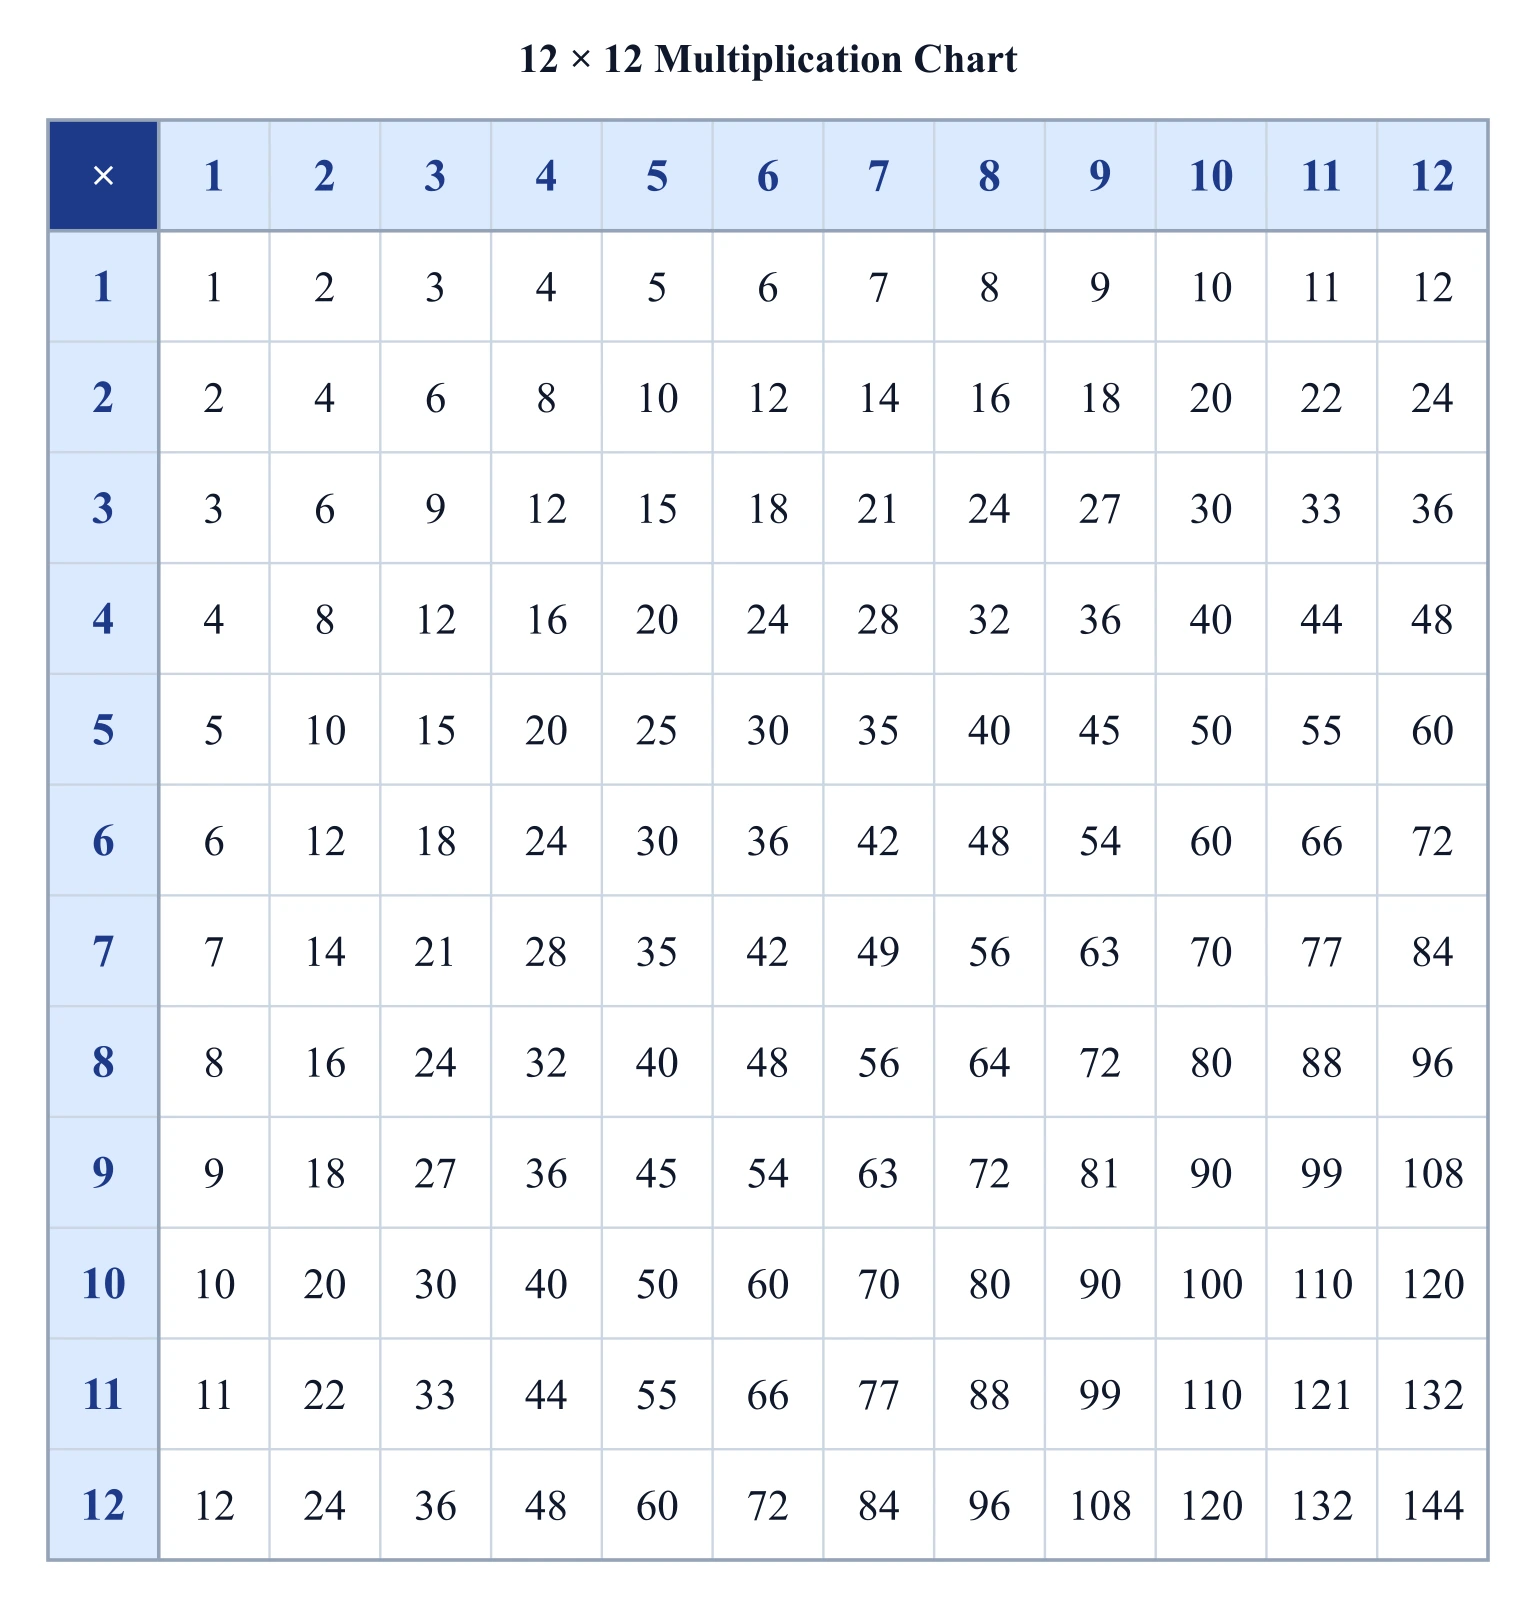
Multiplication Chart Generator
Make a printable times table grid: pick the size, highlight any times table, and export SVG or PNG.
 Education
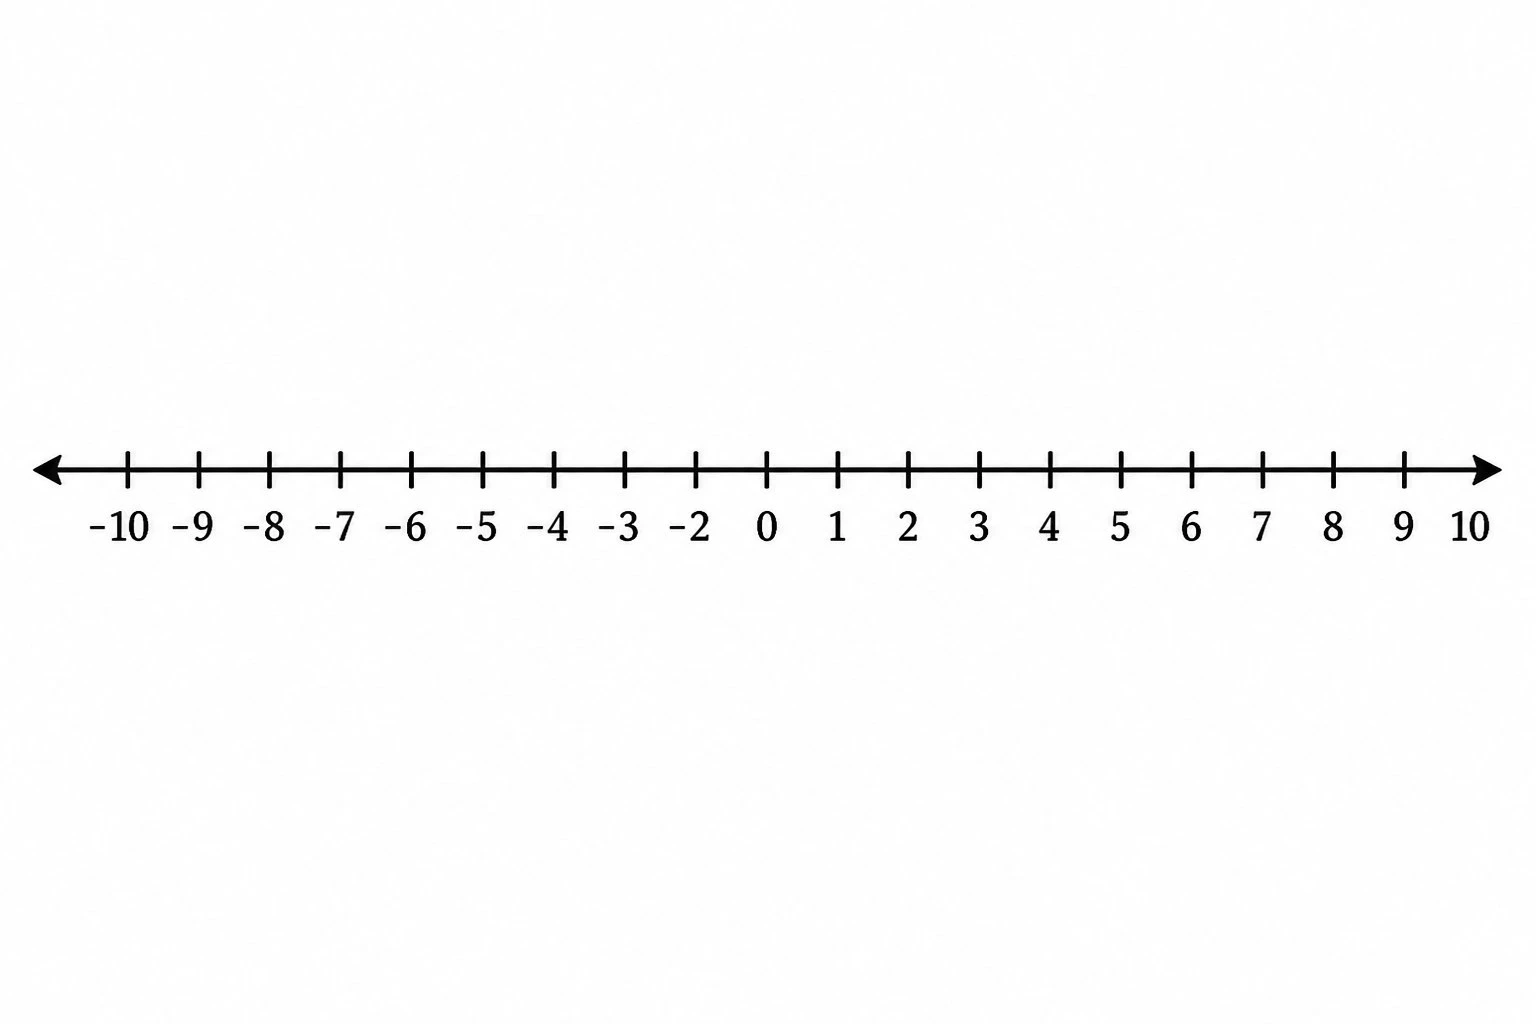
Number Line Generator
Create precise number lines: plot points, graph inequalities and intervals, and mark fractions or decimals.