Number Line Generator for Points, Inequalities & Fractions
Create clean, printable number lines. Plot points, graph inequalities and intervals, and mark fractions or decimals with exact tick spacing — then export SVG or PNG. Deterministic precise mode plus an AI sketch mode.
Add points or intervals, or pick a preset above.
Number Line Examples
Common number-line layouts for points, inequalities, and fractions
Labeled Integer Number Line
A standard labeled number line from -10 to 10 with every integer marked.
Plotting Points on a Number Line
Points marked as dots on a number line — the basis of graphing values.
Graphing Inequalities on a Number Line
An inequality graphed with an open/closed endpoint and a ray to infinity.
Fractions on a Number Line
A unit interval split into fourths and labeled 0, 1/4, 1/2, 3/4, 1.
Negative Numbers Number Line
Negative and positive integers around zero for teaching signed numbers.
Blank Number Line Worksheet
A blank, printable number line with empty labels for students to fill in.
What is a number line?
A number line is a straight horizontal line on which every point corresponds to a real number. A chosen point marks zero, numbers increase to the right and decrease to the left, and evenly spaced tick marks show the scale. Because the spacing is uniform, a number line lets you compare sizes, add and subtract by moving along it, and locate fractions, decimals, and negative numbers visually.
How to plot points on a number line
- Pick a range and a tick interval (the step) so the values you need land on or between ticks. Major ticks are labeled with their number; minor ticks subdivide each interval for finer values.
- To plot a value, place a dot at its position. A filled (closed) dot marks a value that is included; a hollow (open) dot is used for a boundary that is excluded, which matters when graphing inequalities.
- In the Precise number line mode you add points, type their values, toggle closed or open, and pick a color — the tool positions each dot exactly by mapping the value to its coordinate.
Graphing inequalities and intervals
- Inequalities are shown as a shaded segment or ray along the line. Use a closed (filled) endpoint for ≤ or ≥ and an open (hollow) endpoint for < or >.
- For x ≥ 2, put a closed dot at 2 and draw a ray extending right with an arrowhead toward +∞. For x < 5, put an open dot at 5 and shade left. A bounded interval such as 1 ≤ x < 4 uses a closed dot at 1, an open dot at 4, and a bar between them.
- In the tool, add an Interval, set its endpoints (or check −∞ / +∞ to make that side a ray), and toggle each end closed or open. The renderer draws the correct dot style and adds an arrowhead when a side runs to infinity.
Fractions and decimals on a number line
To place fractions, choose a step equal to the fraction denominator — for fourths, set the step to 1/4 so ticks fall on 0, 1/4, 1/2, 3/4, 1. Turn on fraction labels and the tool writes ticks as n/d instead of decimals. Decimals work the same way: a step of 0.1 or 0.5 spaces the ticks evenly, and any point value (like 2.5) is positioned precisely between ticks.
Tips for clean, printable number lines
- Choose a step that keeps labels readable — too many major ticks crowd the numbers, so use minor ticks for the in-between marks instead.
- Keep the range tight around the values you care about so the diagram fills the width without wasted space.
- Use color sparingly to distinguish separate points or intervals, and export as SVG for infinitely crisp printing or PNG (rendered at 2x) for slides and documents.
Frequently Asked Questions
Related Math Tools
 Education
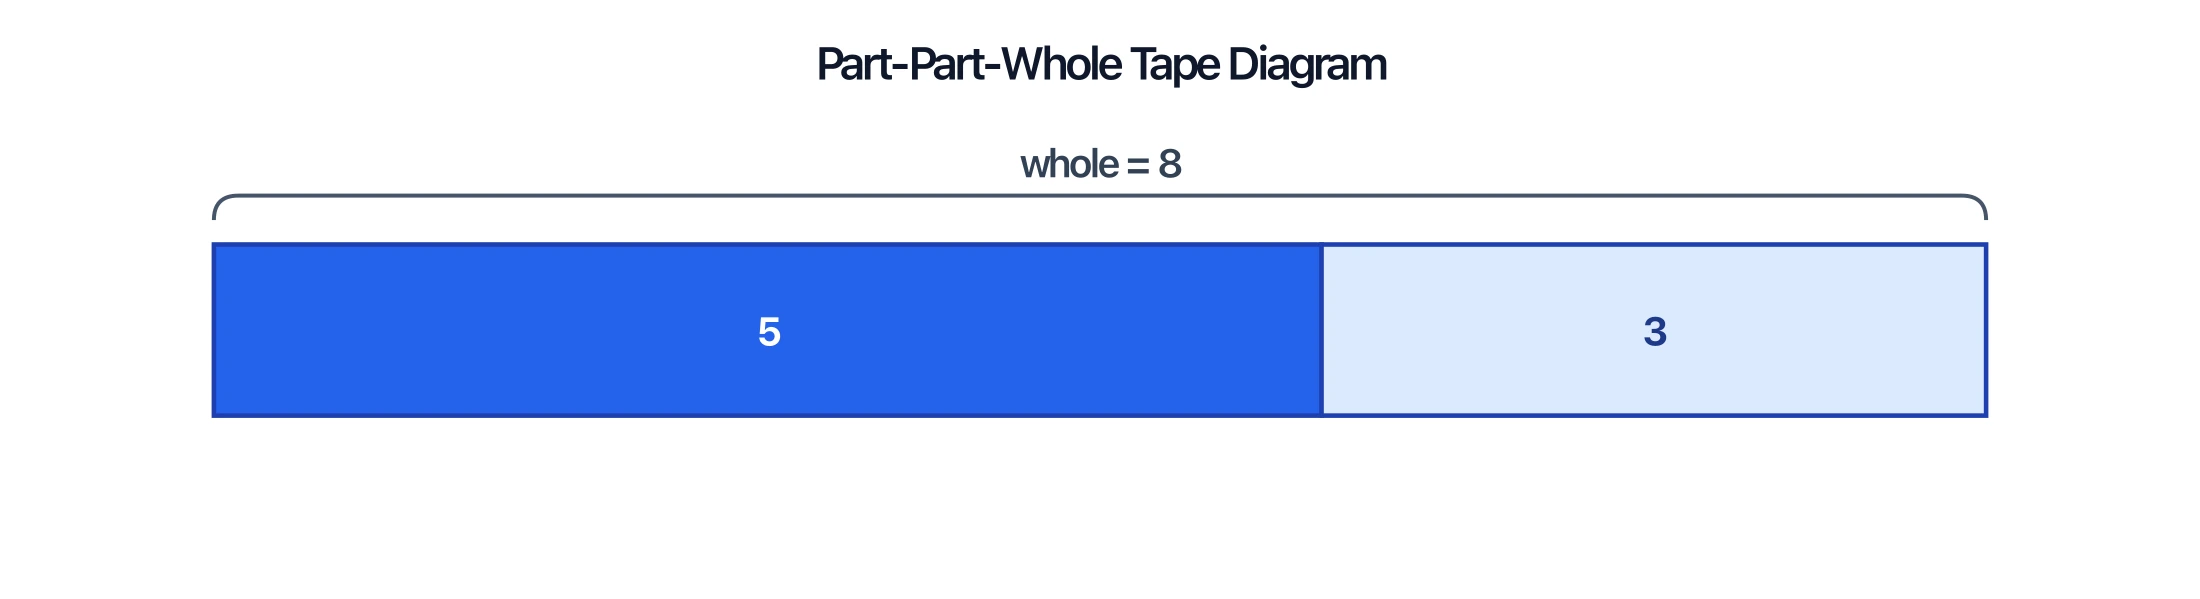
Tape Diagram Generator
Model part-part-whole relationships, fractions, and ratios with labeled bar (tape) diagrams for math problems.
 Statistics
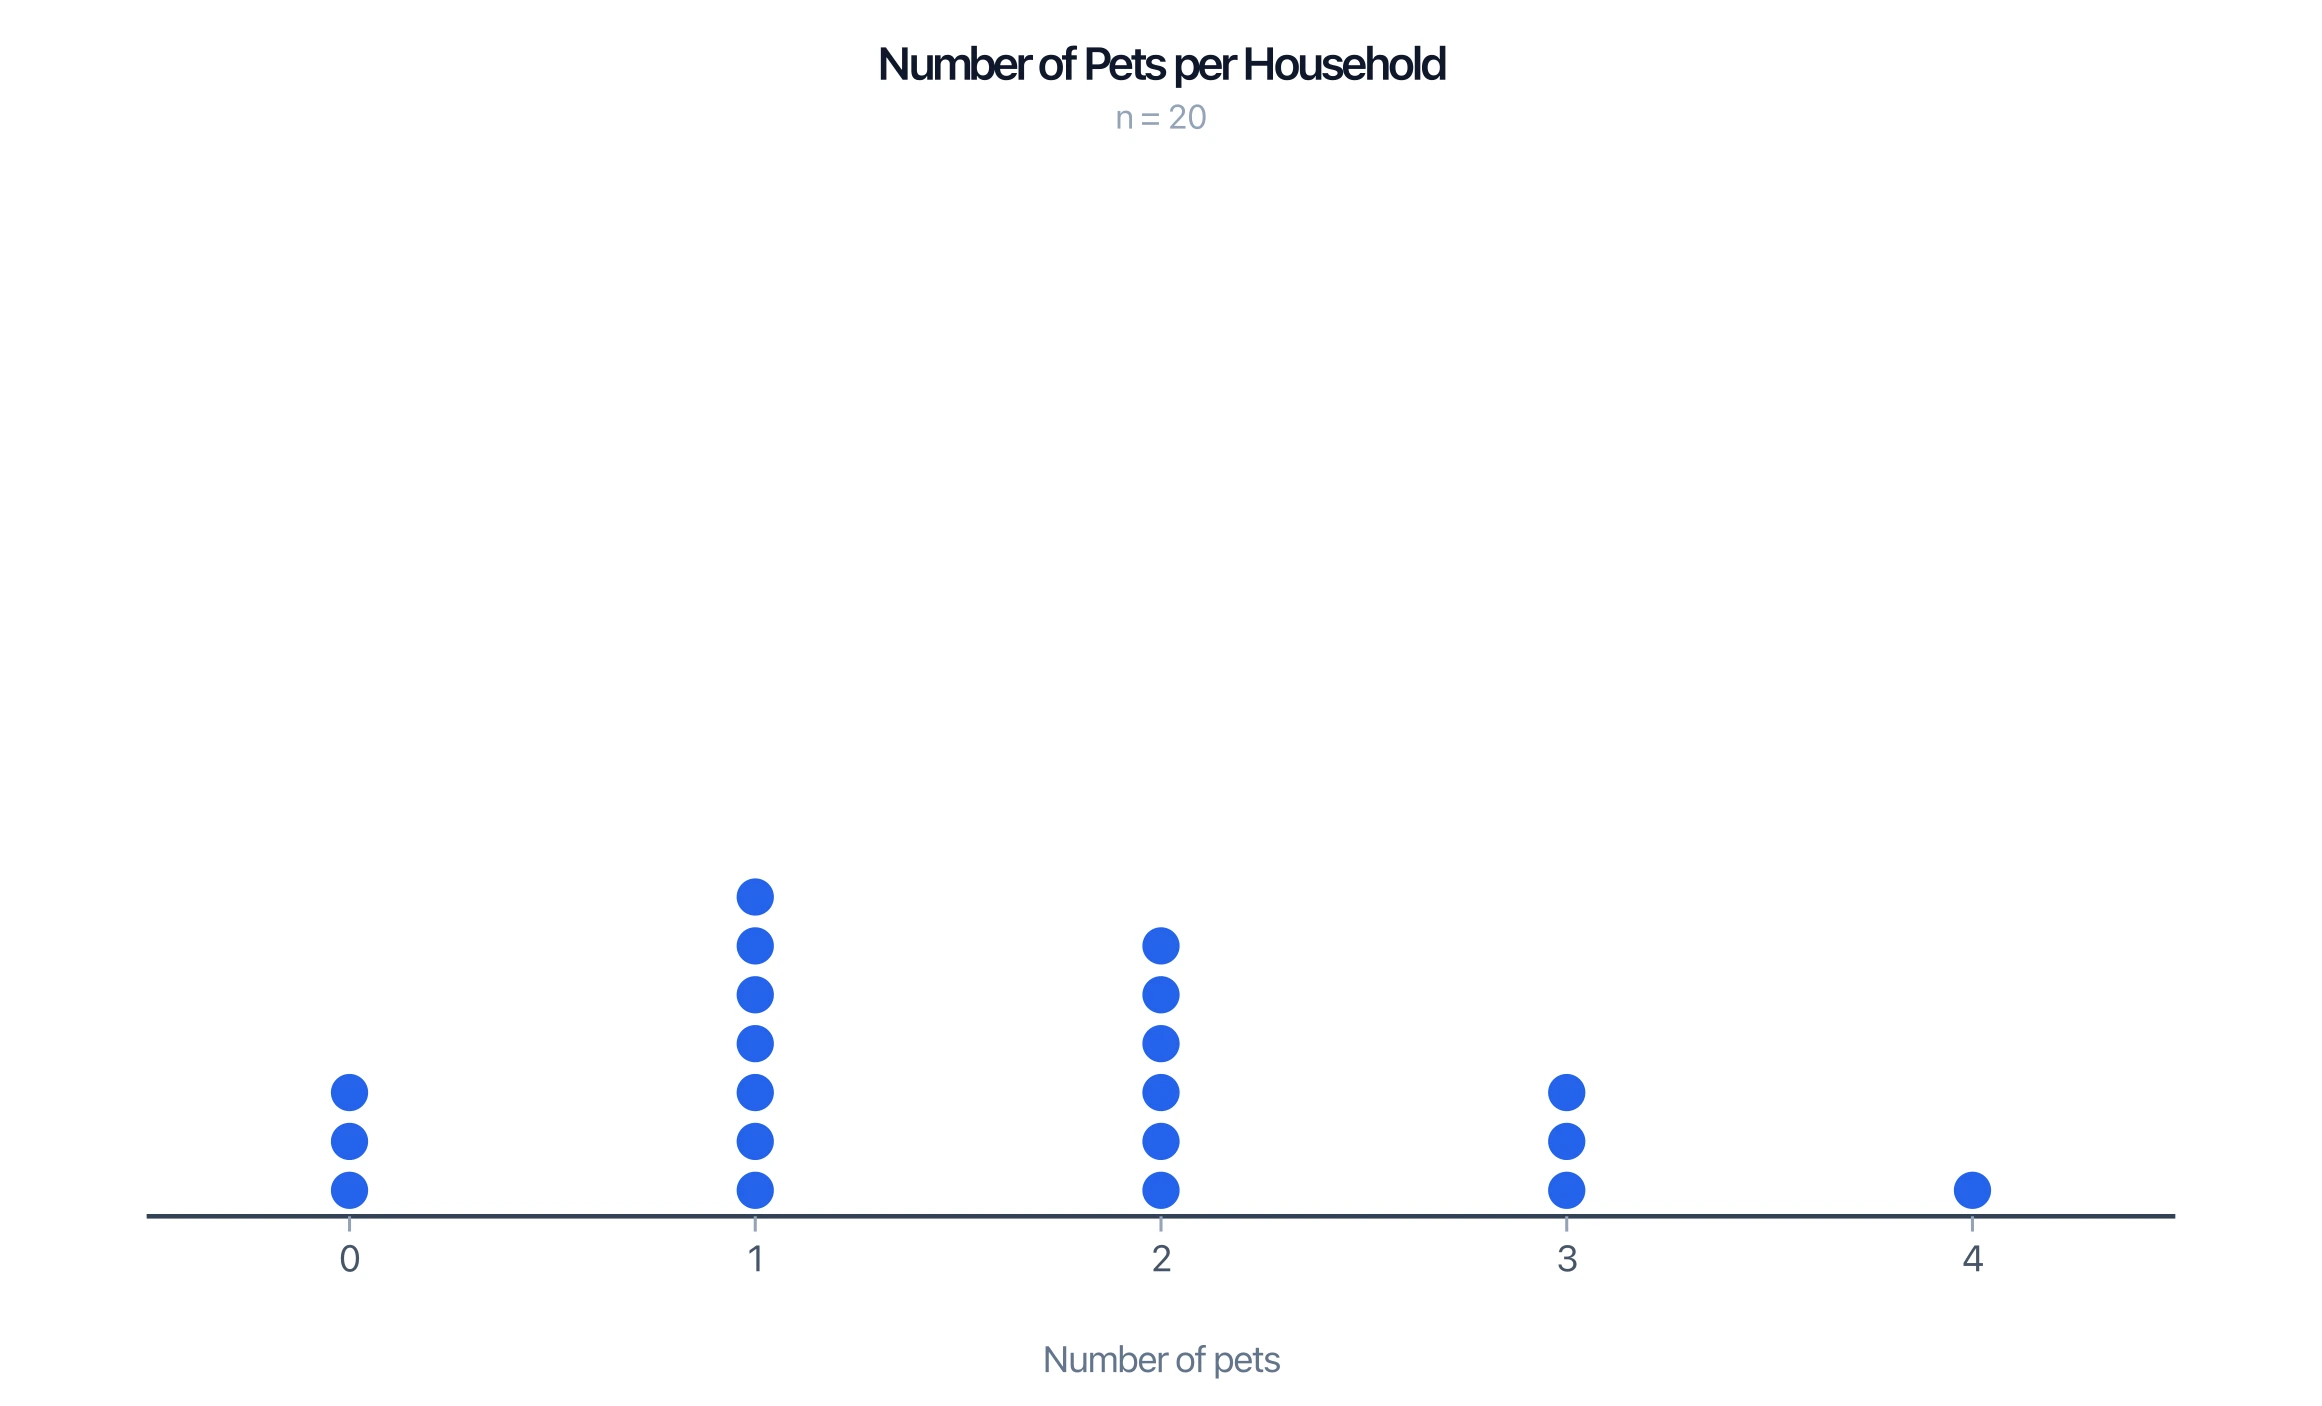
Dot Plot Generator
Turn a list of numbers into a dot plot (line plot) showing how often each value occurs.
 Visualization
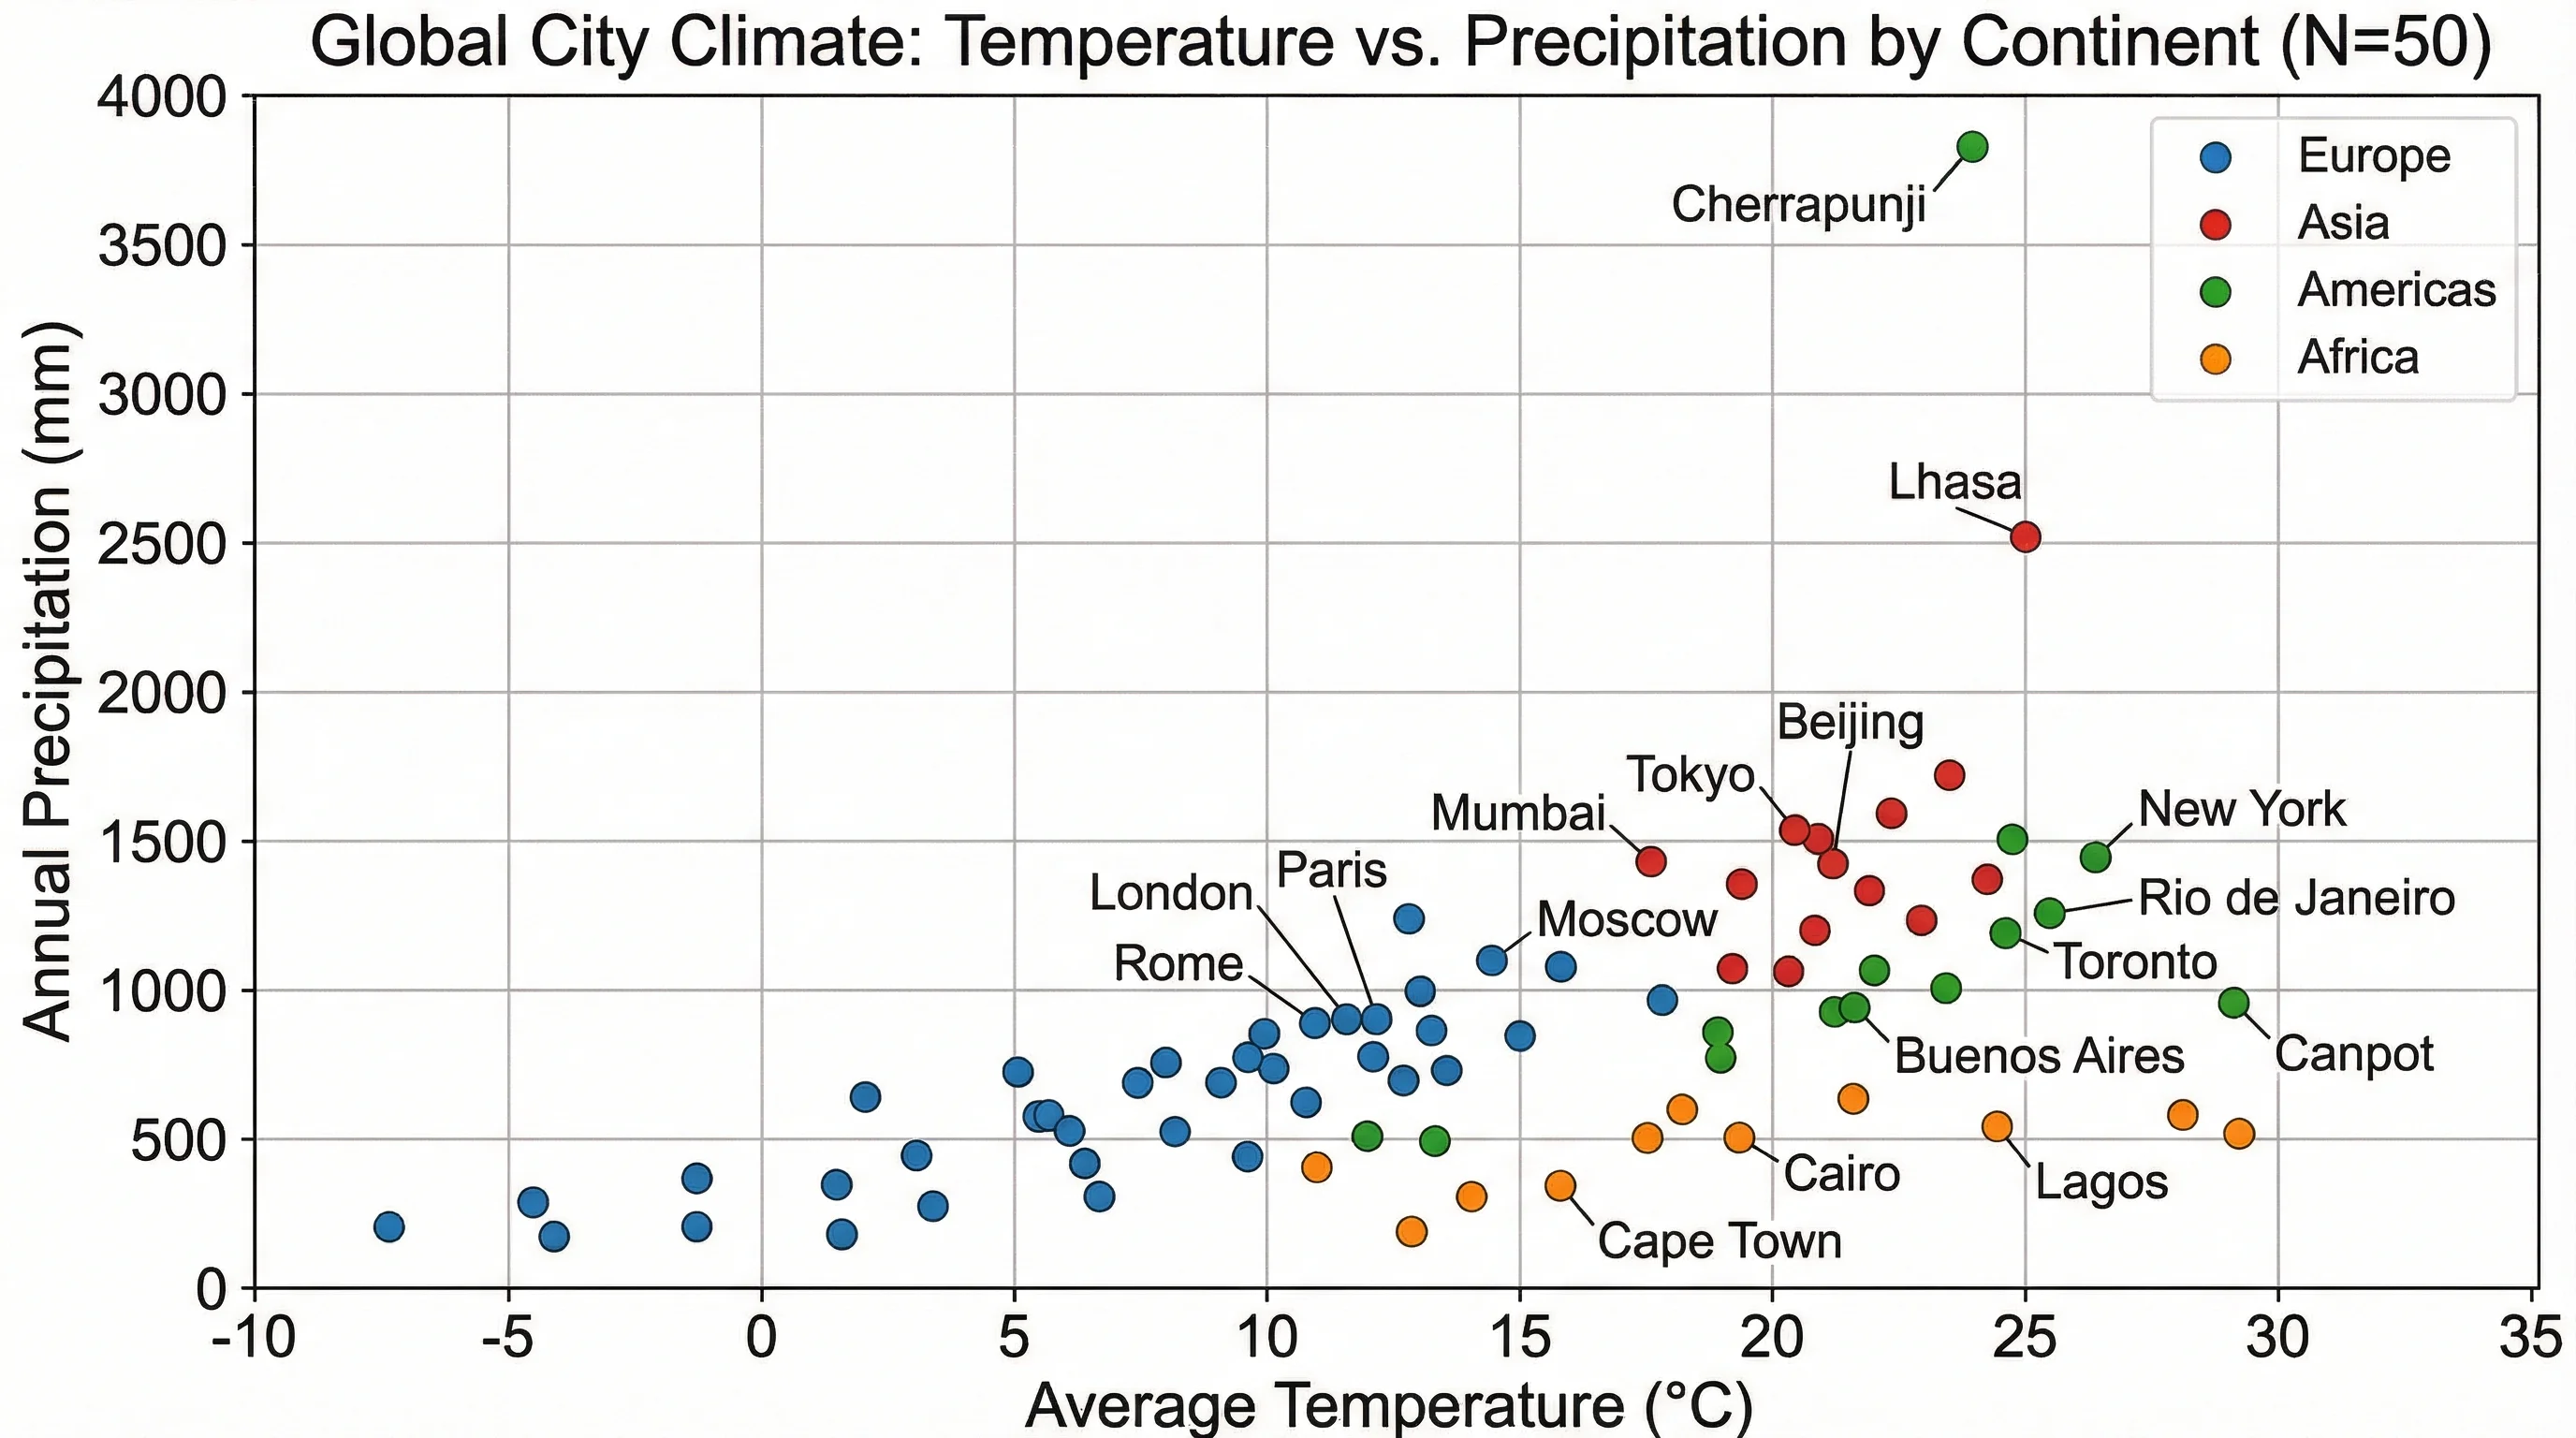
Scatter Plot Maker
Plot paired x-y data points, show correlation, and label axes for statistics and science.