Cladogram Maker for Evolutionary Relationships
Create a phylogenetic cladogram from taxa and shared derived traits. Get a labeled branching diagram with synapomorphies and an optional outgroup — free.
Cladogram Generator
Free to try ·
Your cladogram will appear here
Describe the organisms and click Generate
Cladogram Examples
Labeled branching diagrams covering vertebrates, plants, primates, and more
Vertebrate Cladogram
The textbook example — each branch point is marked with the shared derived trait (jaws, four limbs, amniotic egg, hair).
Plant Kingdom Cladogram
Major innovations — vascular tissue, seeds, and flowers — appear as synapomorphies along the branches.
Primate Cladogram
A great-ape clade showing how humans nest inside the primates, with each shared trait at the right node.
Arthropod Cladogram
An invertebrate clade — the exoskeleton and jointed appendages unite the group, with finer traits nested inside.
Animal Kingdom Cladogram
A big-picture tree where tissues, bilateral symmetry, and a body cavity each define a clade.
Dinosaur Cladogram
Shows how birds are nested inside theropod dinosaurs — a clade you can see at a glance.
What is a cladogram?
A cladogram is a branching diagram that shows how a group of organisms is related by common ancestry. Instead of ranking species from "lower" to "higher," it groups them by the order in which their lineages split apart. Each split represents a common ancestor that the descendants share, so reading a cladogram tells you who is most closely related to whom. This maker draws that branching structure for you with the taxa and their defining traits labeled, so you can show evolutionary relationships clearly without dragging boxes around by hand.
Clades, nodes, branches, and common ancestors
- Node: each branching point. A node represents the most recent common ancestor of everything above it.
- Branch: the line connecting a node to its descendants — it traces a lineage through time.
- Clade: an ancestor plus all of its descendants. A clade is any complete branch you could snip off the tree in a single cut.
- Taxa (tips): the organisms being compared sit at the ends of the branches.
- Outgroup: a more distantly related taxon placed at the base to anchor the tree and show the ancestral, "starting" state of each trait.
Synapomorphies: shared derived characteristics
Cladograms are built from synapomorphies — shared derived characteristics. A derived trait is a new feature that evolved in an ancestor and was passed on to all of its descendants, such as the amniotic egg in reptiles, birds, and mammals. Because every member of a clade inherits that trait, the trait marks the clade. Synapomorphies are placed on the branch where they first appeared. This is different from a shared ancestral trait (a symplesiomorphy), which is too old to define the smaller group. When you describe the traits to label, this tool puts each one at the branch where the lineage acquired it.
How to read and build a cladogram
- Pick your taxa and an outgroup, then list the characteristics you want to compare in a simple trait table.
- Group the organisms by the traits they share: the more derived traits two taxa share, the more recently they split.
- The taxa that share the most synapomorphies branch off closest together; the outgroup branches off first at the base.
- Read it from the base upward — each node is a common ancestor, and everything past that node forms a clade.
- Describe this in the generator and download a clean, labeled diagram for your worksheet, slide, or report.
Cladogram vs phylogenetic tree
A cladogram and a phylogenetic tree both show branching relationships, but they are not identical. A cladogram shows only the order of branching — which groups split off when — and its branch lengths carry no meaning. A phylogenetic tree (or phylogram) adds information to the branches: branch length can represent the amount of evolutionary change or the actual time elapsed. In short, a cladogram answers "who is related to whom," while a phylogenetic tree also tries to say "how much" or "how long." For class assignments and trait-based exercises, the cladogram is usually what you want, and that is what this maker produces.
Using cladograms in biology and evolution class
Cladograms are a core skill in biology and evolution courses, from middle school through AP Biology and introductory university classes. Students use them to interpret evolutionary relationships, identify clades, find the most recent common ancestor of two species, and place synapomorphies from a character table. Teachers use them to build worksheets, exam questions, and lecture slides. Describe the organisms and the traits you want labeled, and the generator returns a clean, presentation-ready cladogram you can drop straight into handouts or a presentation.
Frequently Asked Questions
Related Biology Tools
 Biology
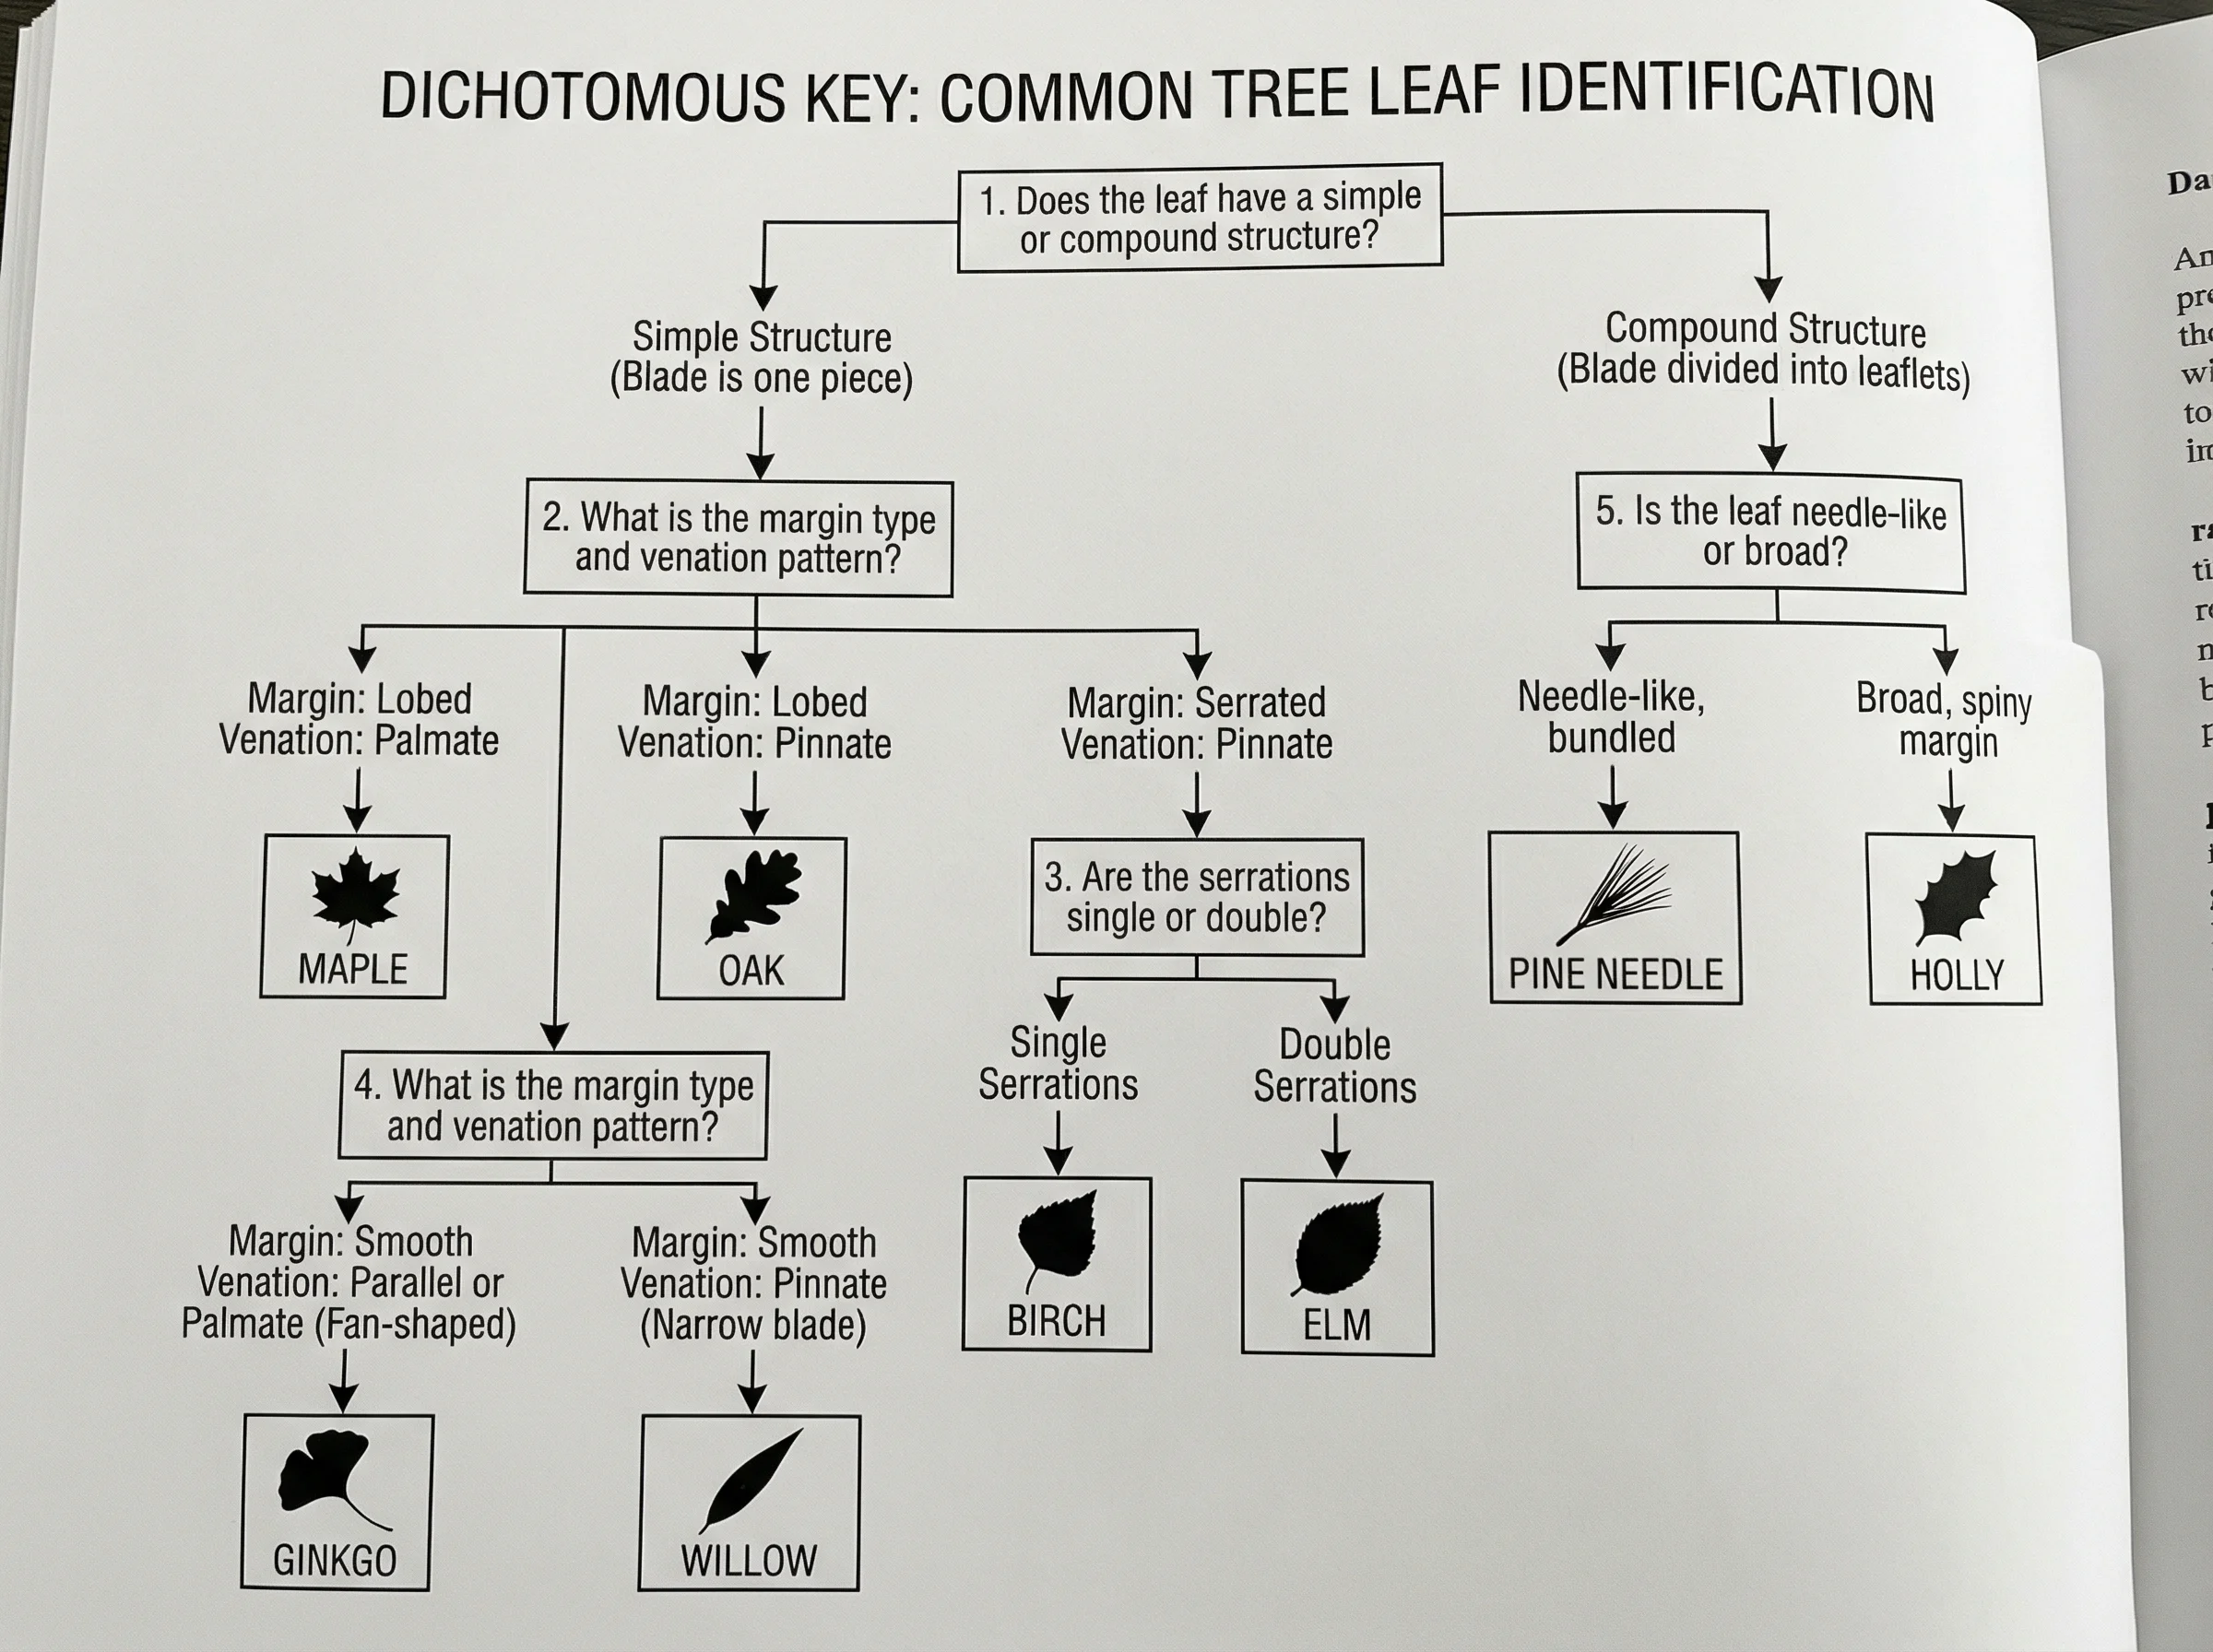
Dichotomous Key Maker
Build branching dichotomous keys to identify organisms by their traits.
 Biology
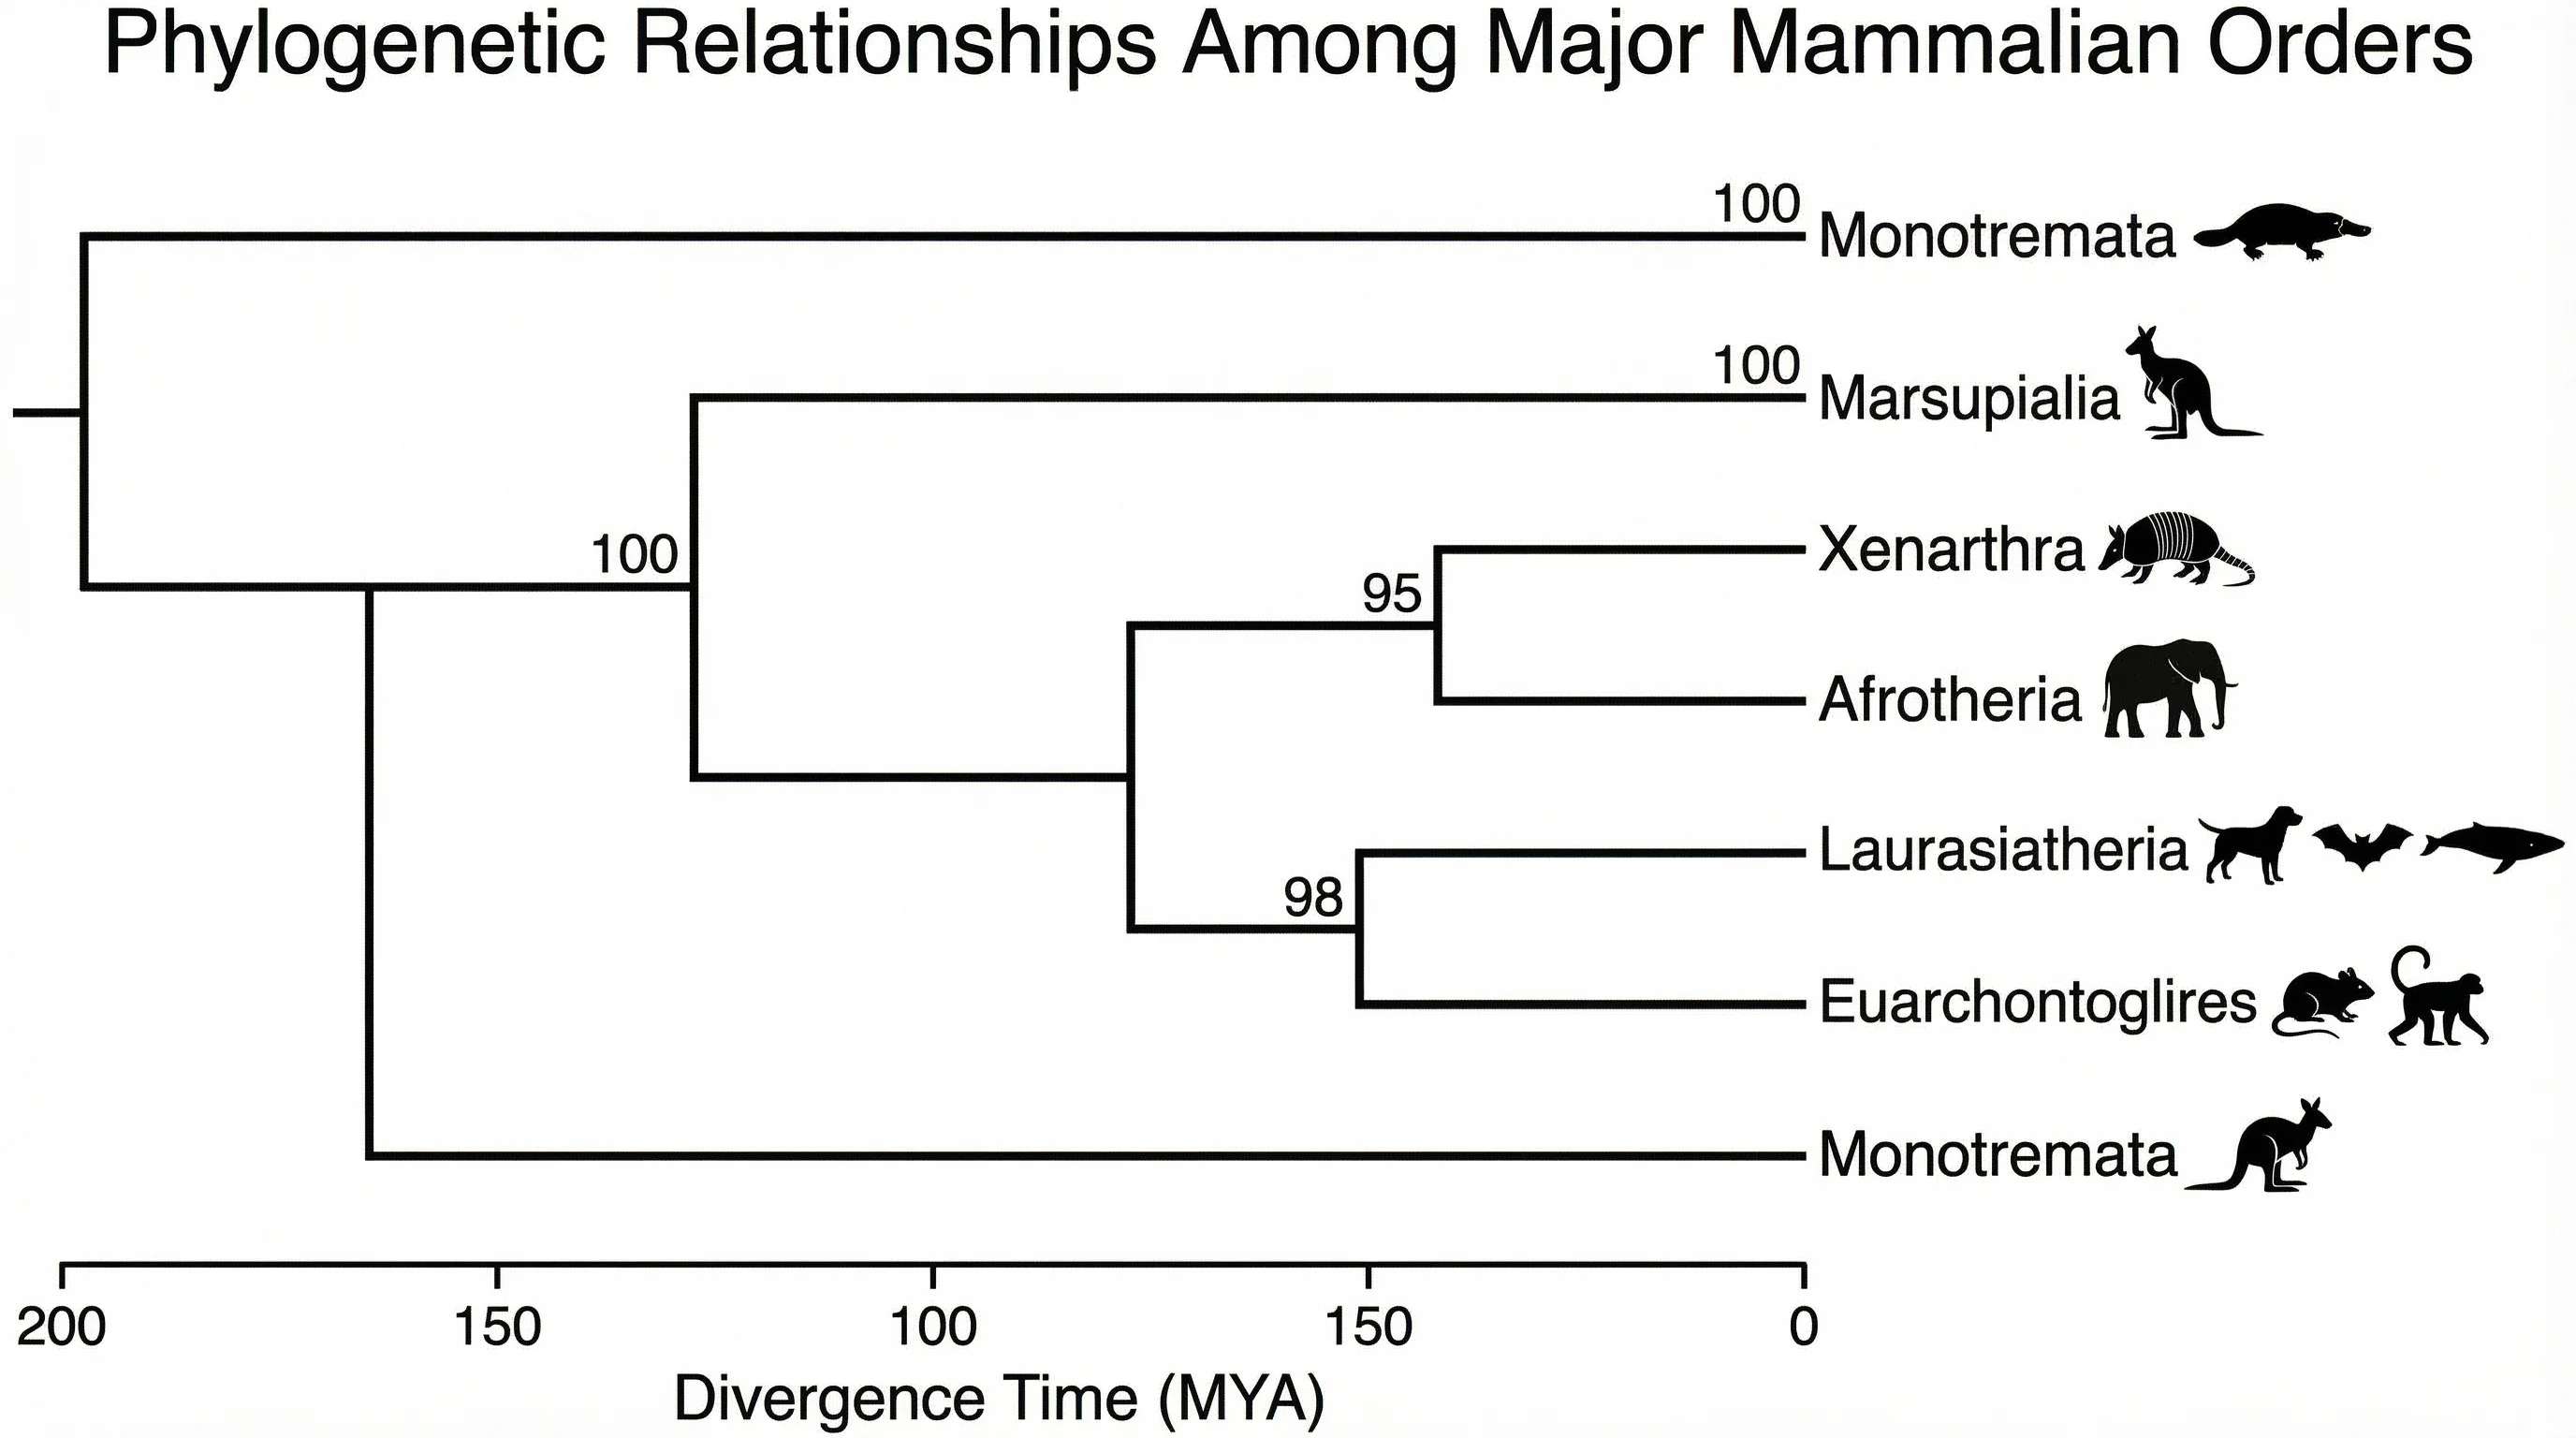
Phylogenetic Tree Maker
Build an evolutionary tree with informative branch lengths, not just branching order.
 Biology
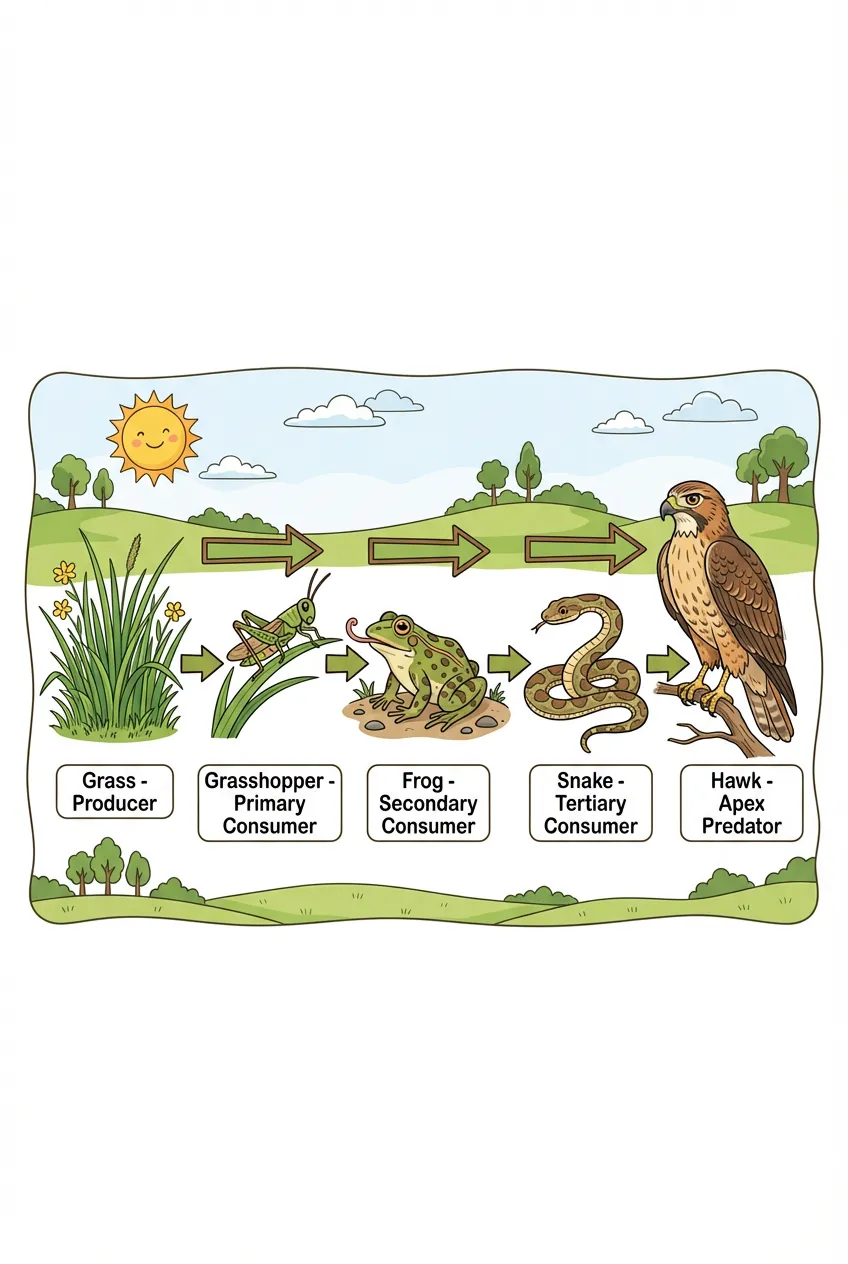
Food Chain Diagram Generator
Draw labeled food chains showing producers, consumers, and energy flow.
 Biology
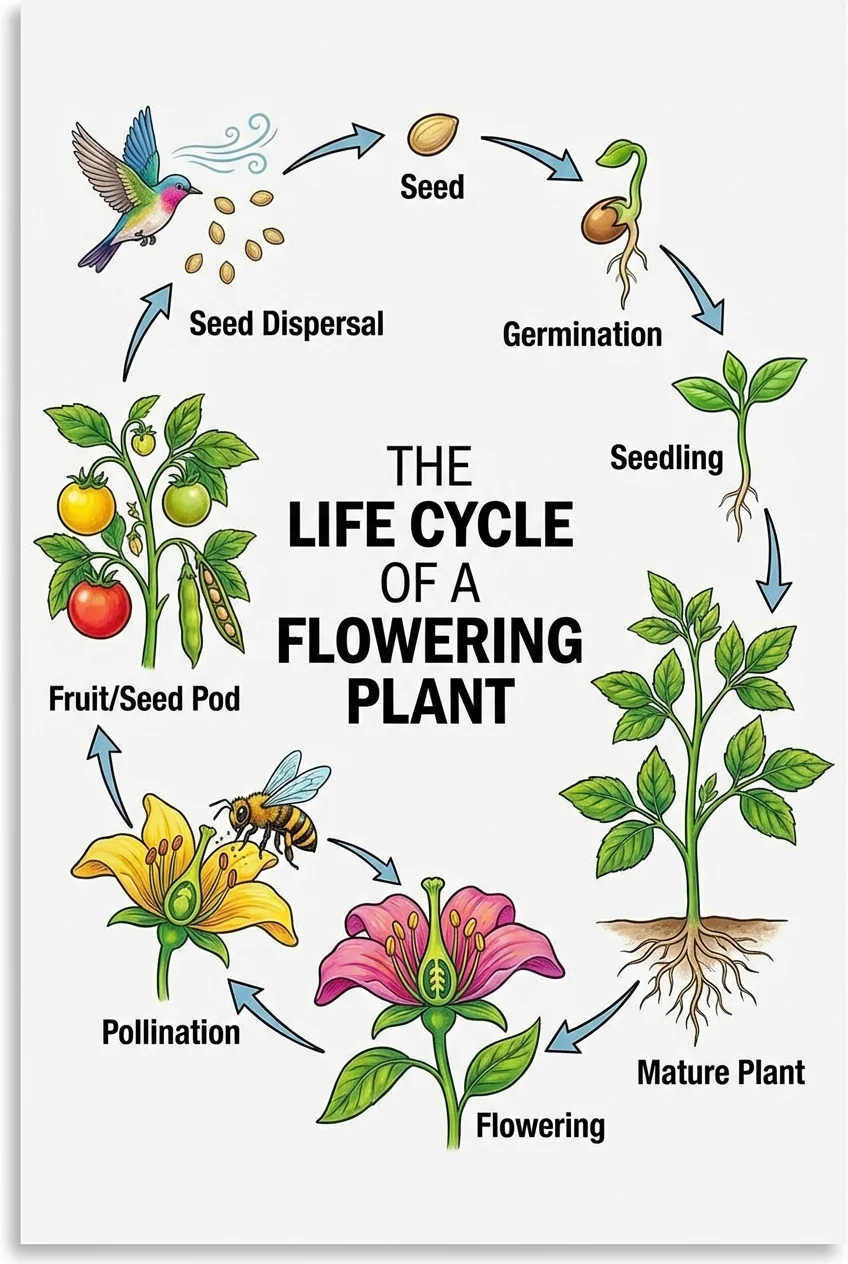
Life Cycle Diagram Generator
Create labeled life cycle diagrams for plants, animals, and insects.