Neural Network Diagram Generator for MLP, CNN & Transformers
Draw a neural network diagram online. Enter layer sizes for a precise, fully-connected feedforward (MLP) diagram, or describe a CNN, Transformer, or RNN for an AI illustration — then export SVG, free.
Enter your layer sizes — renders an exact, fully-connected feedforward network as SVG, free
Network settings
Exact feedforward diagram, rendered as SVG.
Each layer is fully connected to the next. Large layers (over 10 neurons) show 8 circles plus a count, so the diagram stays readable. Download an editable SVG for slides, reports, and papers.
Neural Network Diagram Generator
Free to try ·
Your neural network diagram will appear here
Describe the architecture you want
Neural Network Diagram Examples
Feedforward, CNN, Transformer, RNN, GAN, and autoencoder architectures
Feedforward MLP
The classic fully-connected network — the exact layout the precise mode draws from your layer sizes.
CNN Architecture
Convolution and pooling stages feeding a classifier — best built in AI illustration mode.
Transformer & Attention
Encoder–decoder stacks with multi-head attention — the architecture behind modern LLMs.
RNN / LSTM
Gated recurrent cells unrolled across time steps for sequence and time-series data.
GAN Architecture
A generator and discriminator locked in an adversarial training loop.
Autoencoder
An encoder–bottleneck–decoder that learns a compact latent representation.
What is a neural network diagram?
A neural network diagram is a visual map of how an artificial neural network is built: circles (neurons) arranged in layers, with lines (connections) showing how data flows from one layer to the next. It turns an abstract model into something you can read at a glance — how many layers there are, how wide each one is, and how the layers feed into each other. This generator draws that diagram for you two ways: a precise mode that renders an exact, fully-connected feedforward network from your layer sizes, and an AI mode for richer architectures like CNNs and Transformers.
Neurons, layers, weights, and connections
- Neurons are the nodes of the network — each one takes inputs, combines them, and passes the result on. They are drawn as circles.
- Layers group neurons into columns. The input layer receives your data, one or more hidden layers transform it, and the output layer produces the prediction.
- Connections are the lines between neurons. In a fully-connected (dense) network, every neuron in one layer links to every neuron in the next.
- Weights are the strengths of those connections — the numbers the network learns during training. The diagram shows the wiring; training sets the weights.
Two ways to make a neural network diagram here
- Precise mode: type your layer sizes (for example "4, 6, 6, 2", or one layer per line as "Input, 4") and the tool draws an exact, evenly-spaced, fully-connected feedforward network with every layer labeled — accurate every time, no dragging.
- AI illustration mode: describe a more complex architecture — a CNN, Transformer, RNN, GAN, or autoencoder — in plain English and the tool generates a polished, presentation-ready diagram with labeled blocks and data-flow arrows.
- Use precise mode for standard MLPs where the layer structure must be exactly right; use AI mode when you need the specialized building blocks of deep-learning architectures.
Feedforward vs CNN, RNN, and Transformer
A feedforward network (a multilayer perceptron, or MLP) passes data straight through stacked dense layers and is the right model for tabular data and simple classification — this is exactly what the precise mode renders. Convolutional neural networks (CNNs) add convolution and pooling layers for images. Recurrent networks (RNNs and LSTMs) loop information across time steps for sequences and text. Transformers replace recurrence with self-attention and power most modern large language models. These architectures have specialized blocks that go beyond plain layers of circles, so the AI illustration mode is the better fit for drawing them.
How to make a neural network diagram
- Decide whether your network is a standard feedforward model or a specialized architecture (CNN, RNN, Transformer).
- For a feedforward net, open the precise mode and enter your layer sizes — a comma list, or one named layer per line.
- The tool evenly spaces the layers, draws every neuron-to-neuron connection, and labels each layer with its name and neuron count.
- For a CNN, RNN, or Transformer, switch to AI illustration mode and describe the architecture, including the layers and data flow you need.
- Export a clean SVG to drop into slides, reports, papers, or documentation.
When to use the AI illustration mode
Reach for AI illustration mode when your architecture needs more than plain layers of neurons — convolutional and pooling stages, attention mechanisms, gated recurrent cells, an encoder–decoder split, or a labeled training loop. The precise mode is purpose-built for standard feedforward / MLP networks where exact, fully-connected geometry matters; the AI mode handles the visual complexity of CNNs, Transformers, RNNs, GANs, and autoencoders that a circles-and-lines layout cannot capture on its own.
Frequently Asked Questions
Related Diagram Tools
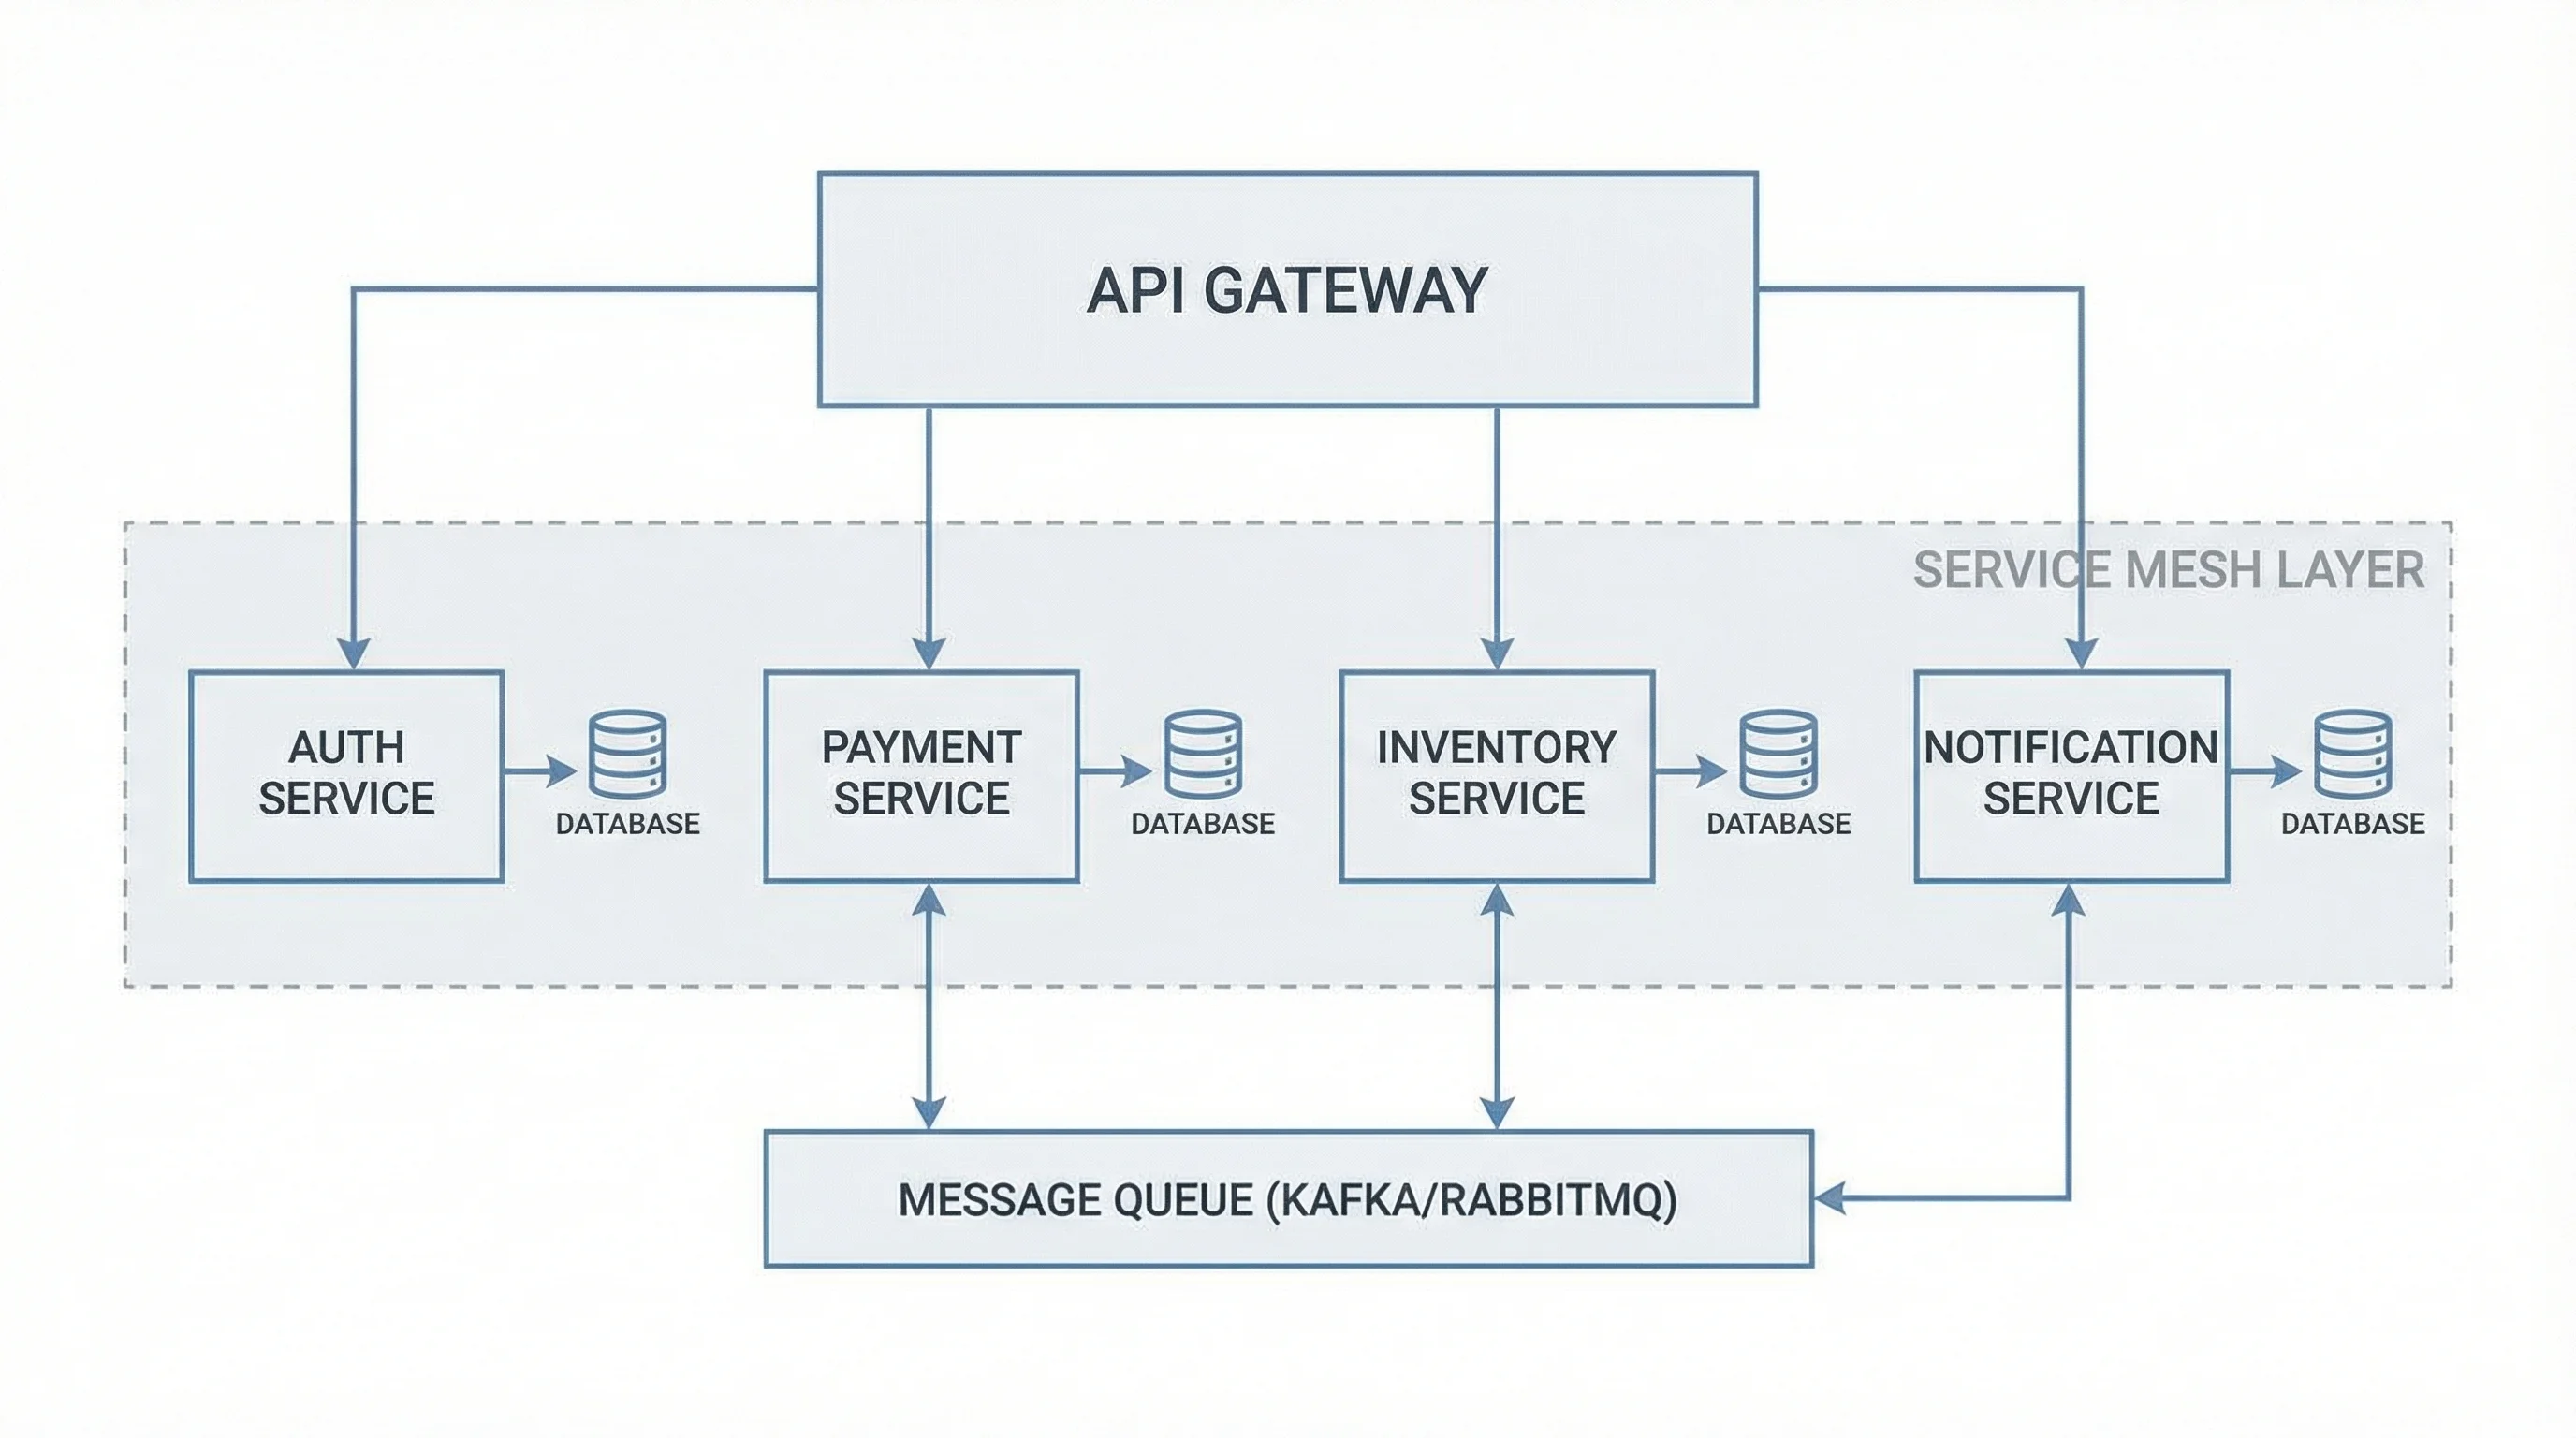 Software
Software Architecture Diagram Generator
Map services, components, and data flow into a clean software architecture diagram.
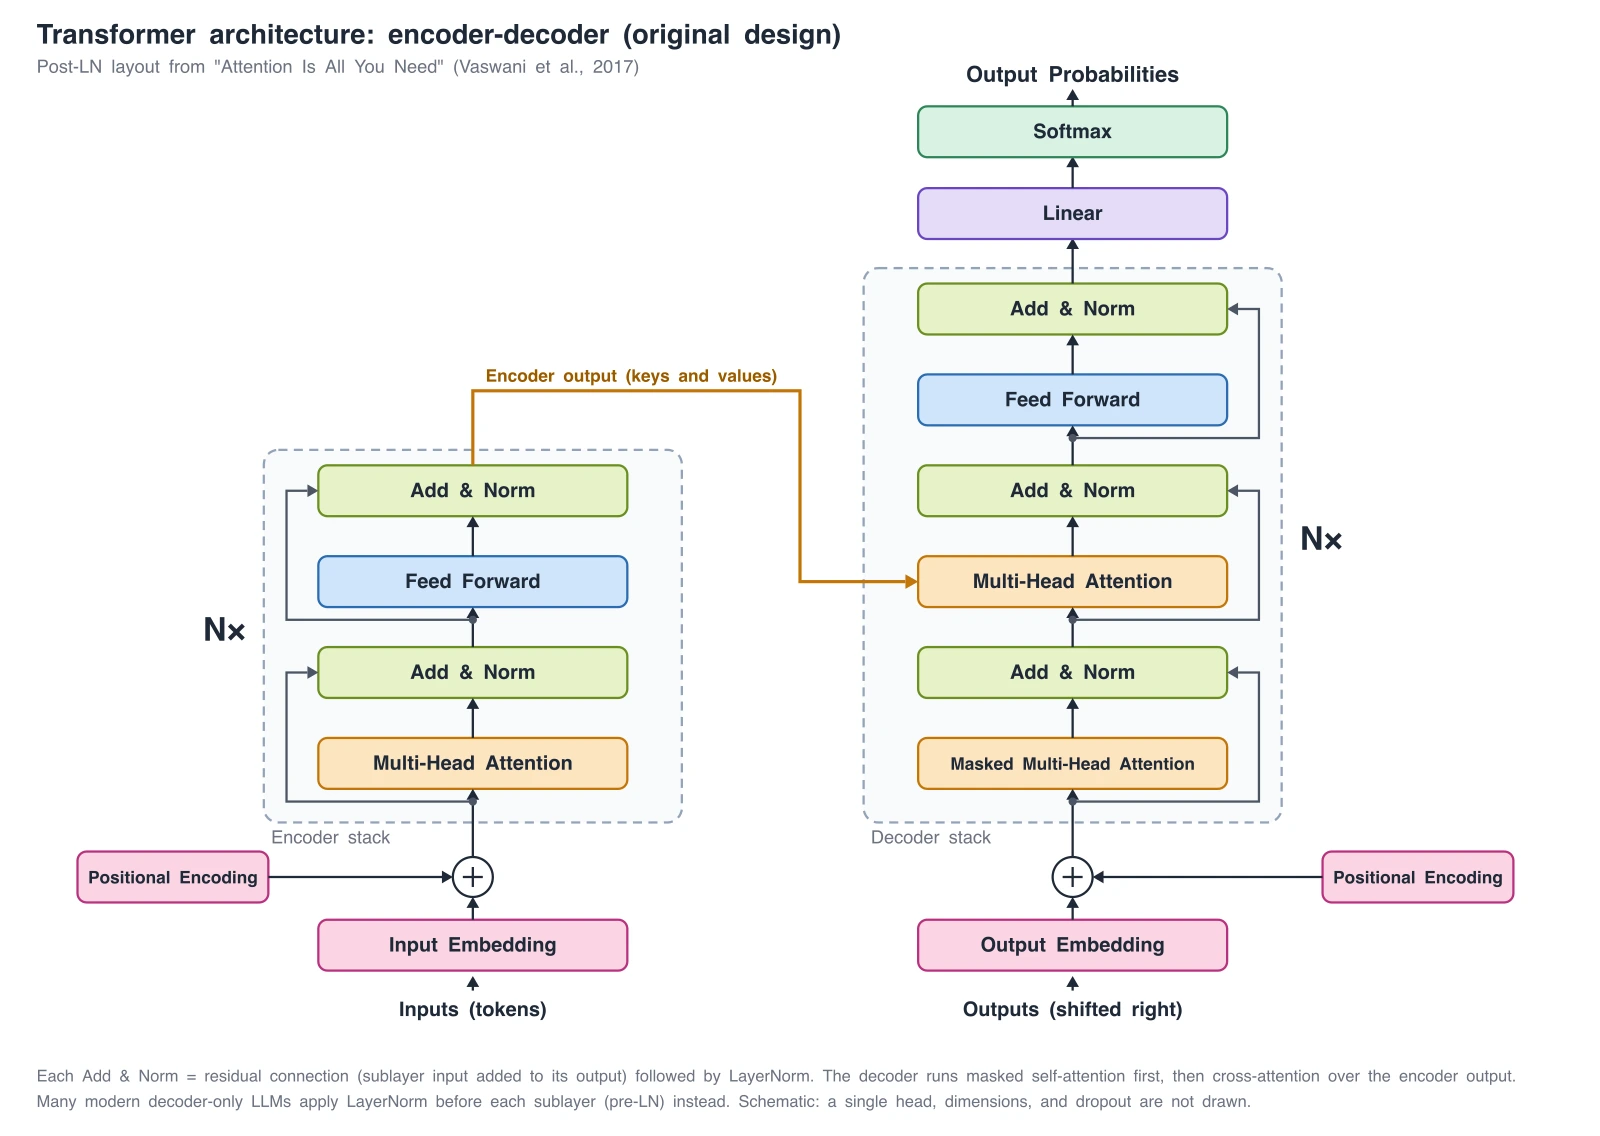 Research
Transformer Architecture Diagram Generator
Dedicated Transformer diagrams: encoder-decoder, GPT-style decoder-only, and ViT, with exact reference diagrams.
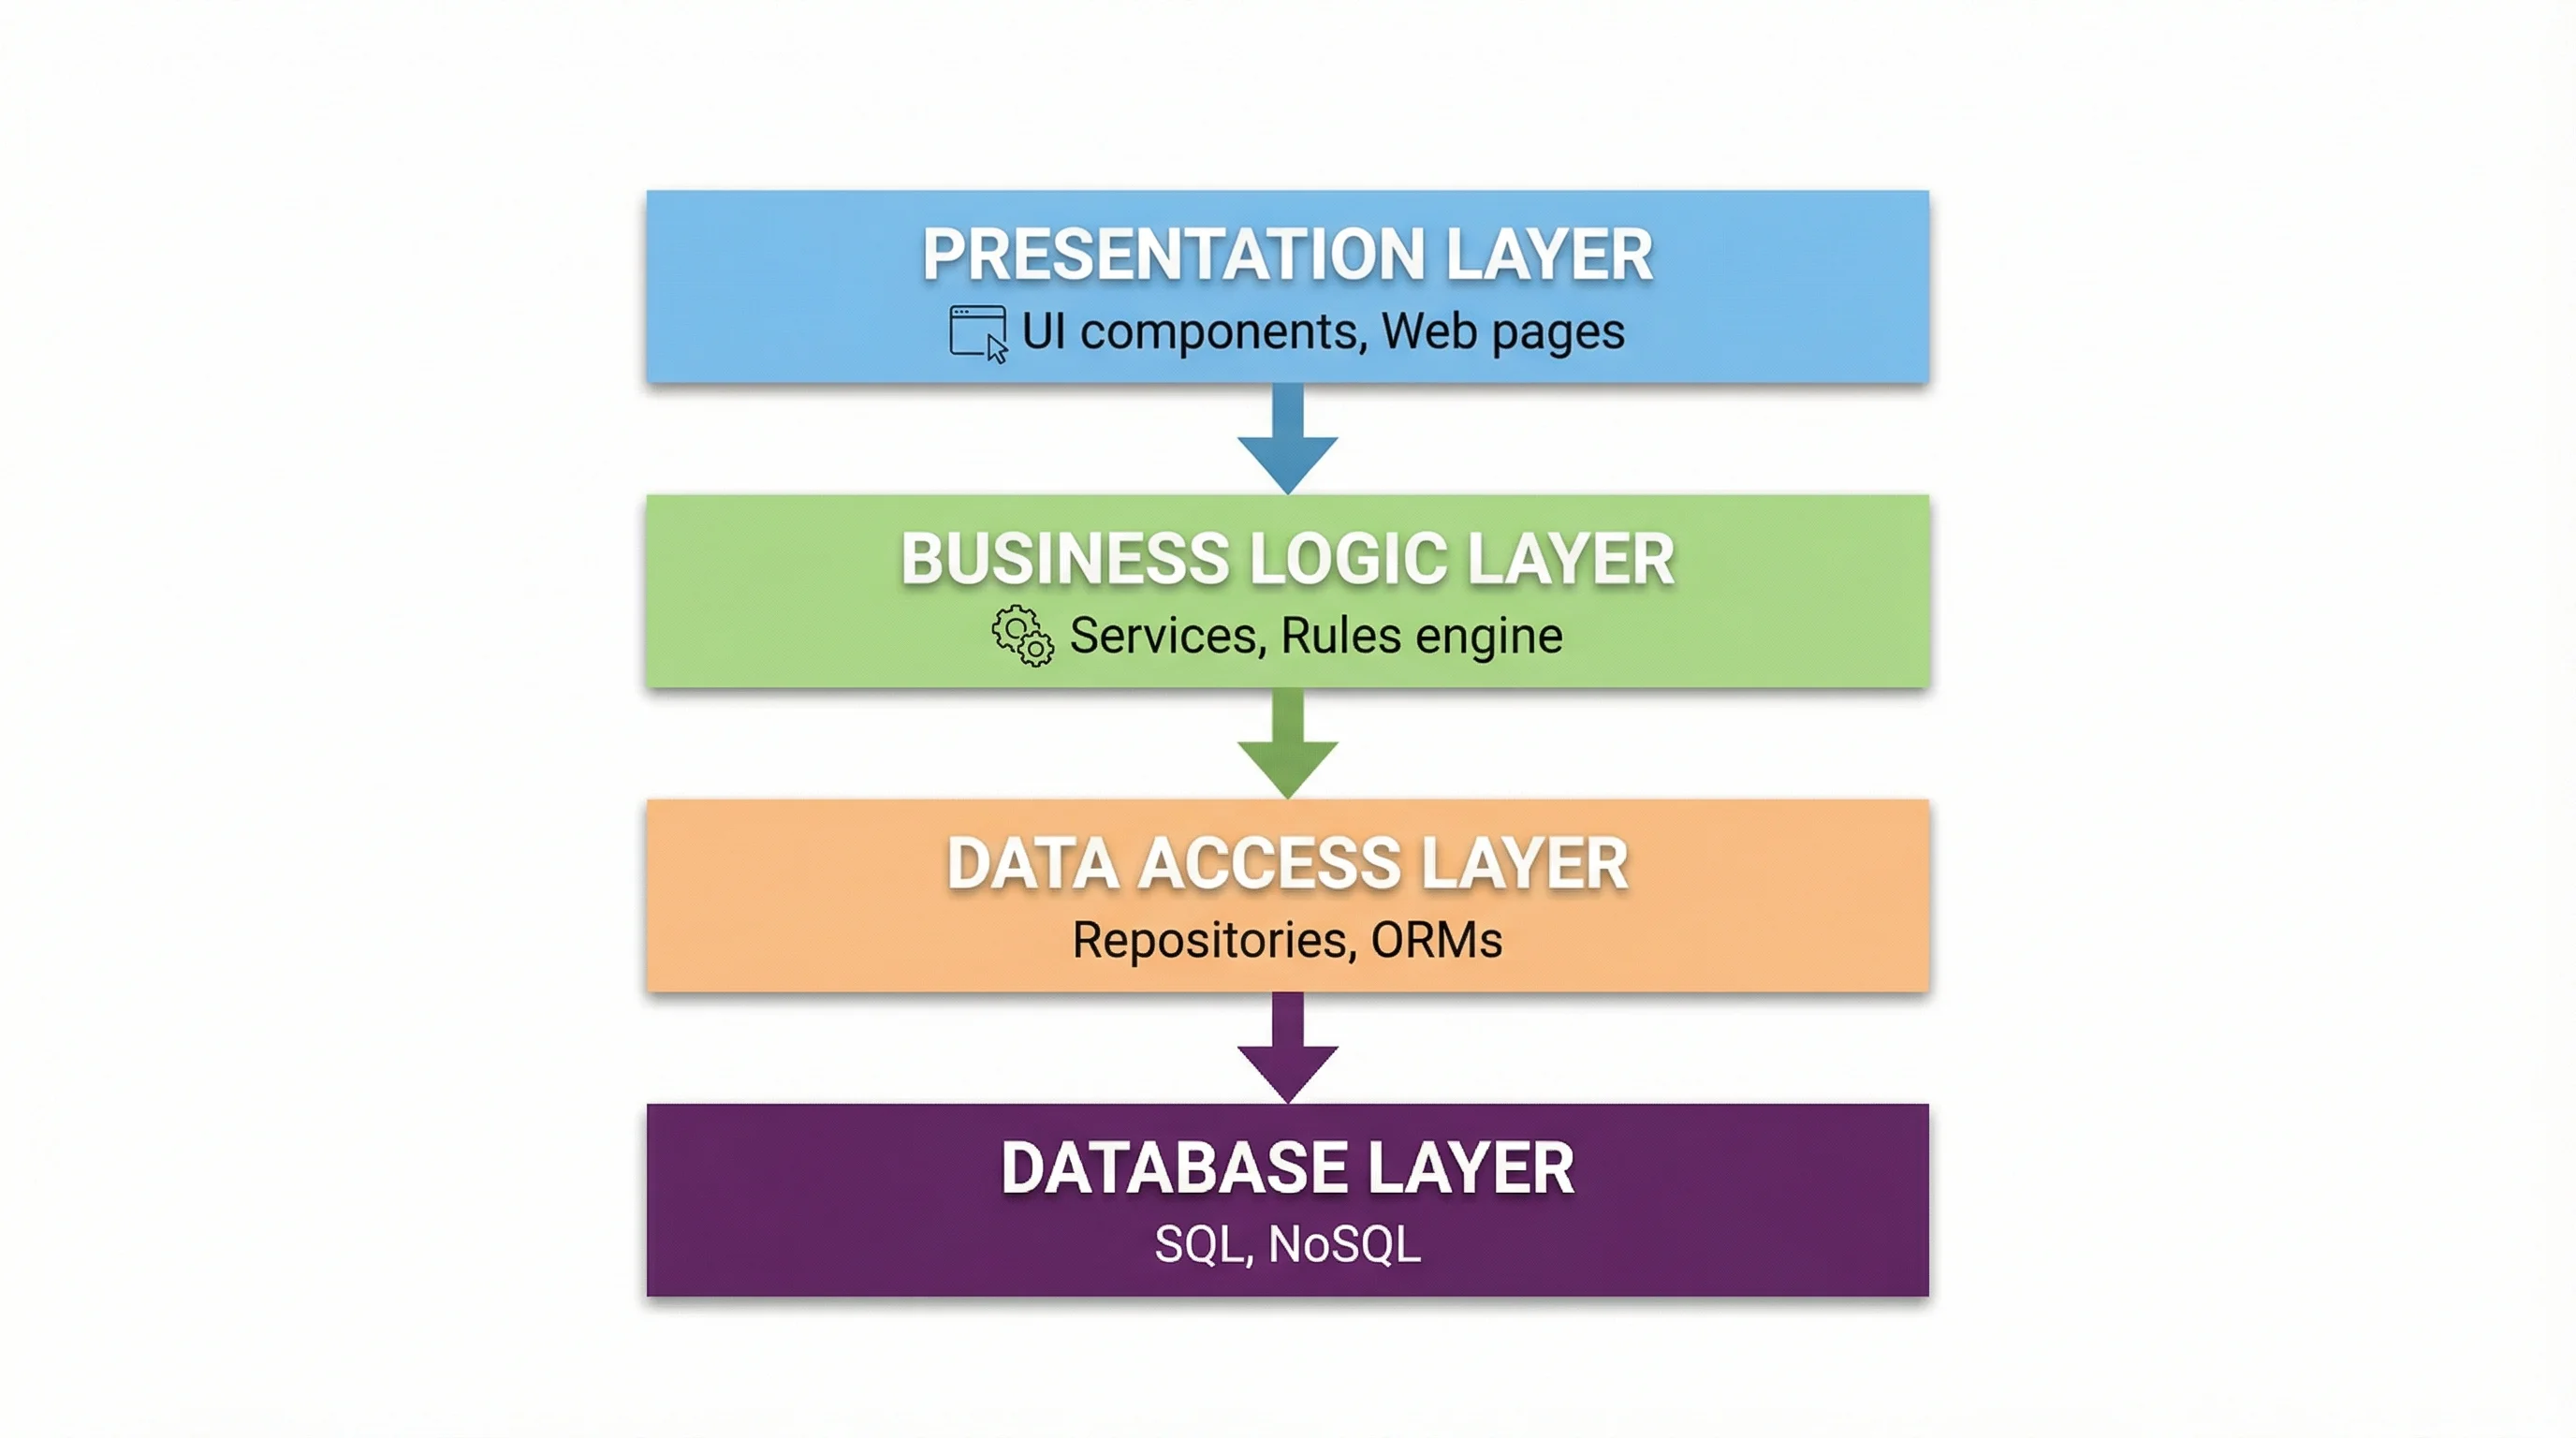 Visualization
Text to Diagram Generator
Turn a plain-text description into a structured diagram in seconds.