Graphic Organizer Generator for Visual Learning
Create a graphic organizer for any lesson or study session. Describe a Venn diagram, KWL chart, T-chart, web, sequence, concept map, or story map and generate a clean, classroom-ready template in seconds.
Graphic Organizer Generator
Free to try ·
Your graphic organizer will appear here
Describe your organizer type and topic, then click Generate
Graphic Organizer Examples
Webs, T-charts, sequences, and more for any subject or grade
Cause-and-Effect Organizer
Map several causes to one effect — ideal for analyzing events in history or science.
Decision-Tree Organizer
Branch a question into outcomes — great for sorting, classifying, and critical thinking.
Sequence Organizer
Show steps in order with connected boxes — perfect for processes and timelines.
Compare-and-Contrast T-Chart
Two columns side by side make differences and similarities easy to study.
Classification Organizer
A hierarchy that nests categories and examples — useful for taxonomy and grouping.
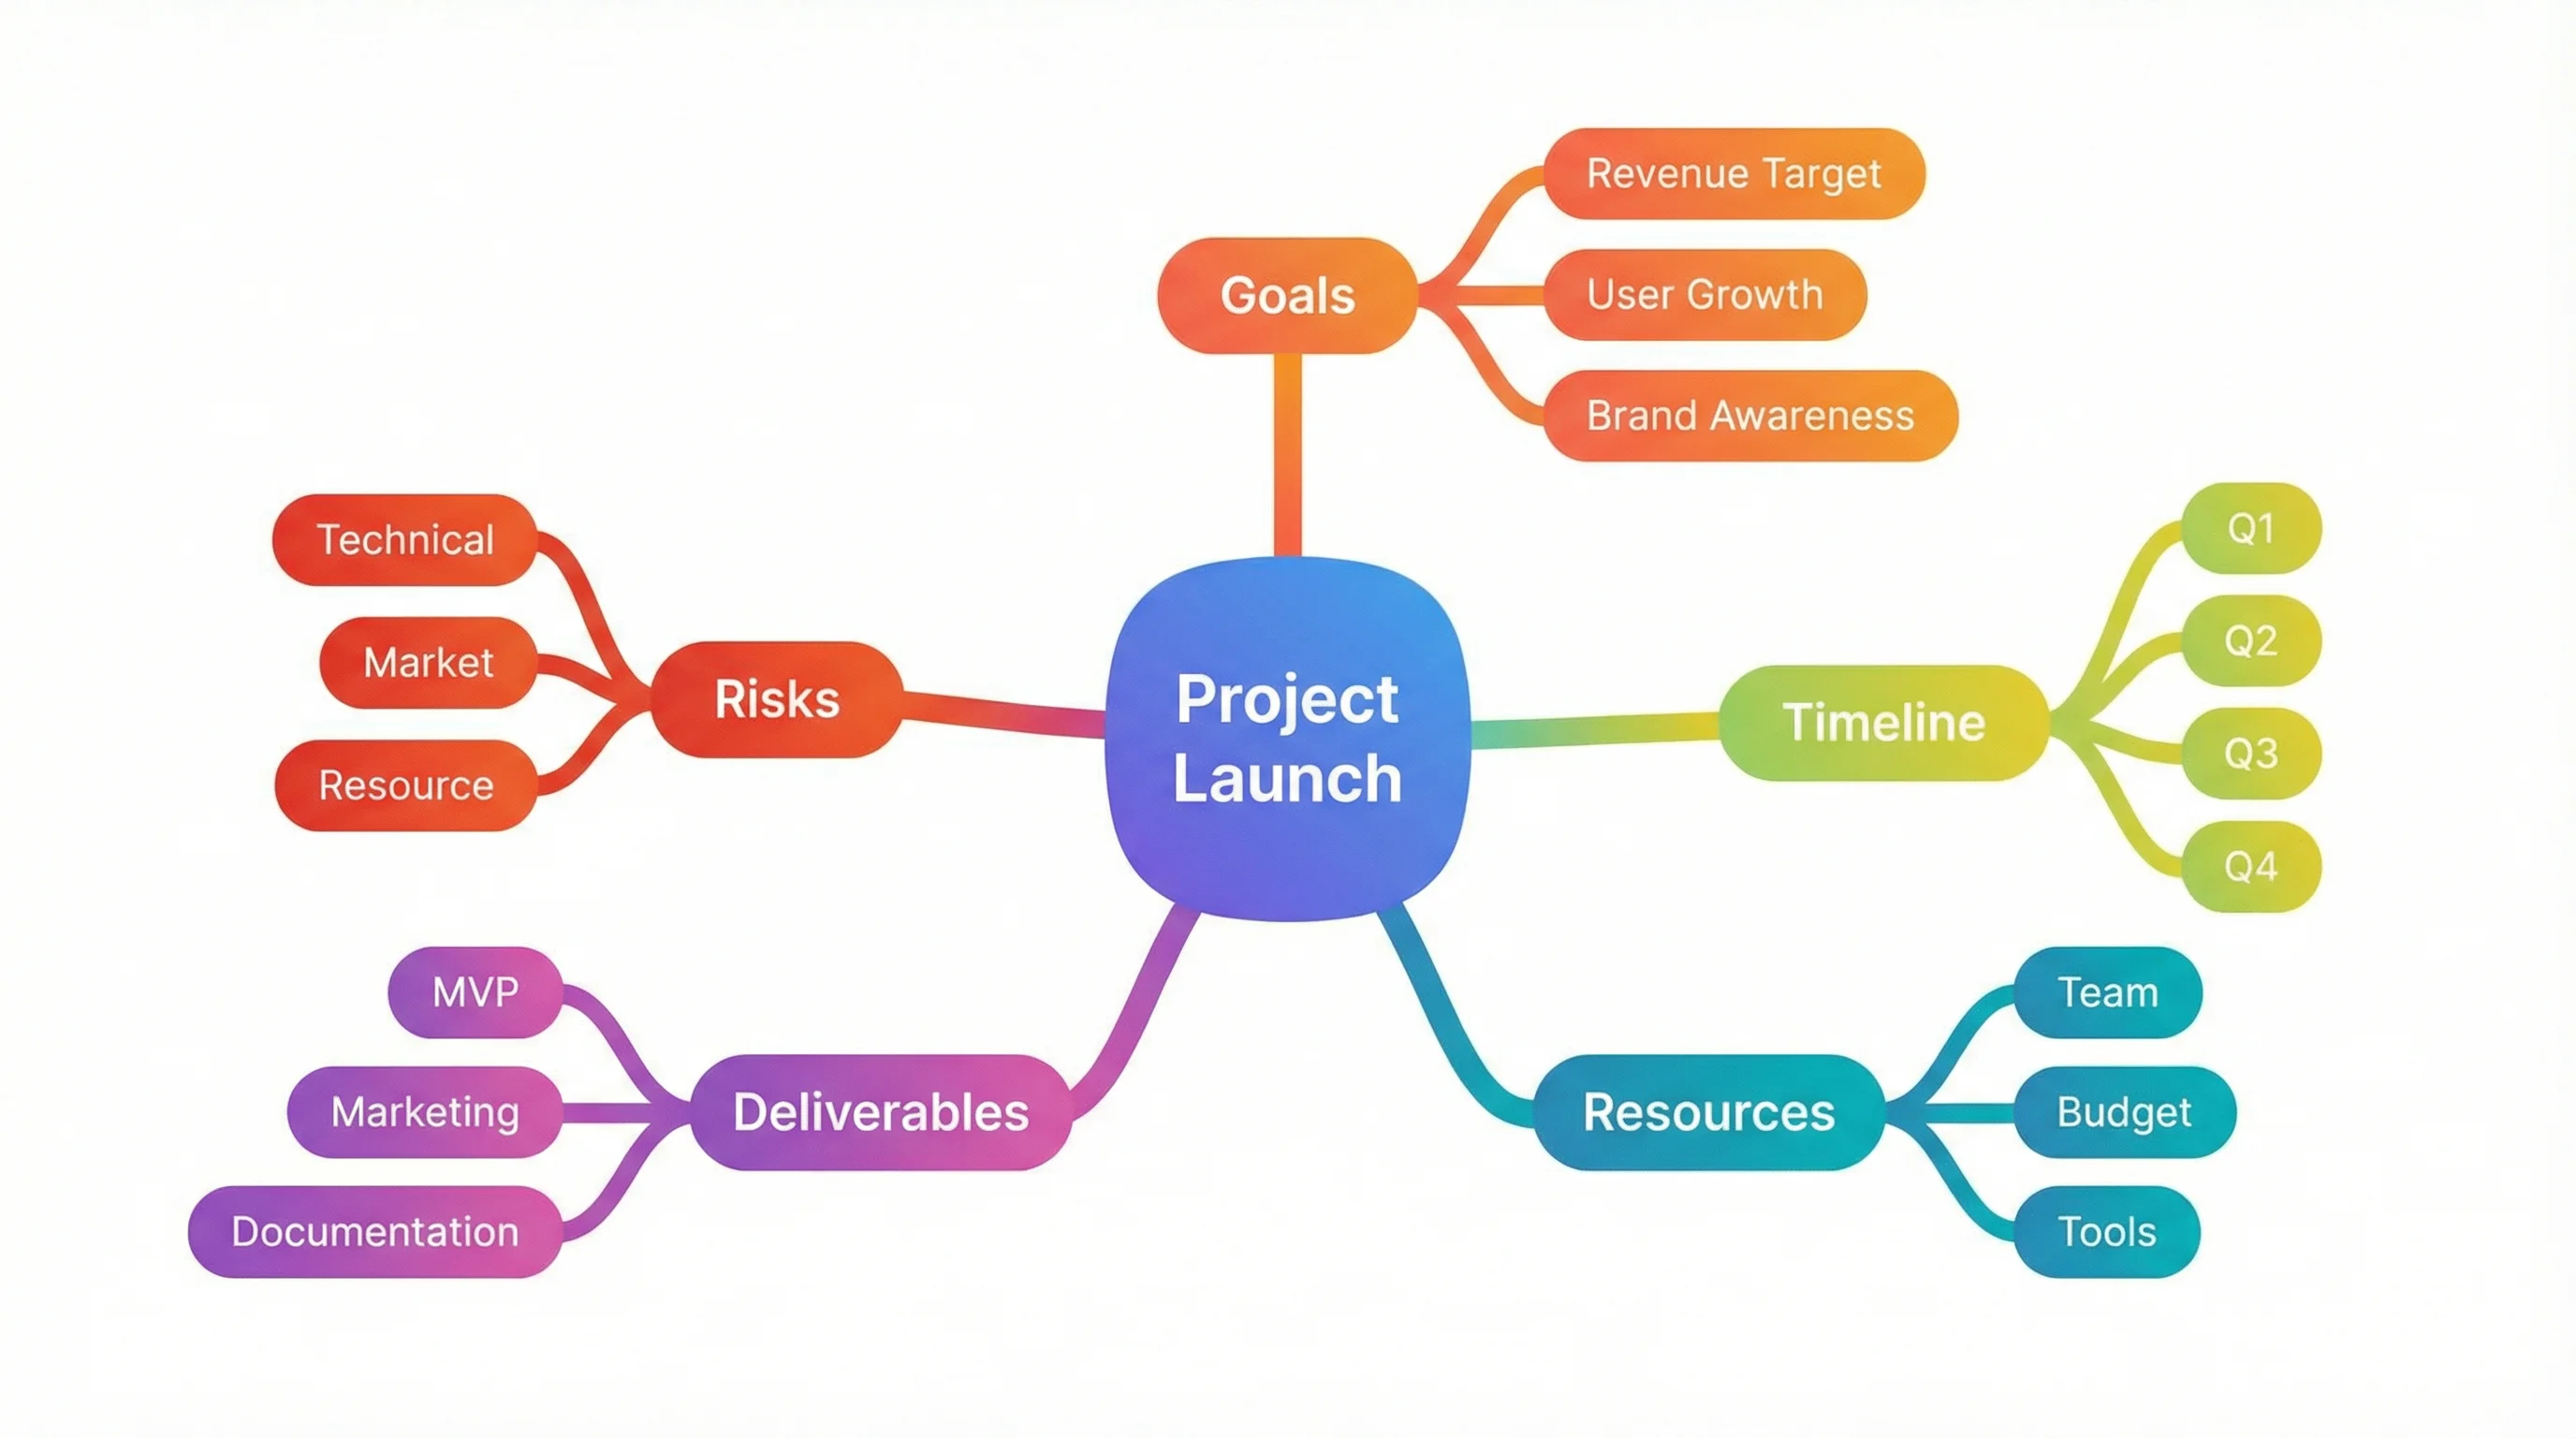
Web / Cluster Organizer
A central idea with radiating bubbles — the go-to layout for brainstorming.
What is a graphic organizer?
A graphic organizer is a visual framework that arranges facts, ideas, and relationships into a structure you can see at a glance. Instead of a wall of text, information is sorted into bubbles, columns, boxes, or branches that show how the pieces fit together. That visual structure is what makes graphic organizers so effective for learning: they turn abstract connections into spatial ones, reduce cognitive load, and give the brain a layout it can remember. Teachers use them to scaffold thinking, and students use them to plan writing, take notes, and study for tests. This generator builds any of these layouts from a short description, so you can go from idea to a clean, classroom-ready template in seconds.
Common types of graphic organizers
- Web / cluster map: a central topic with radiating bubbles — the classic layout for brainstorming and free association.
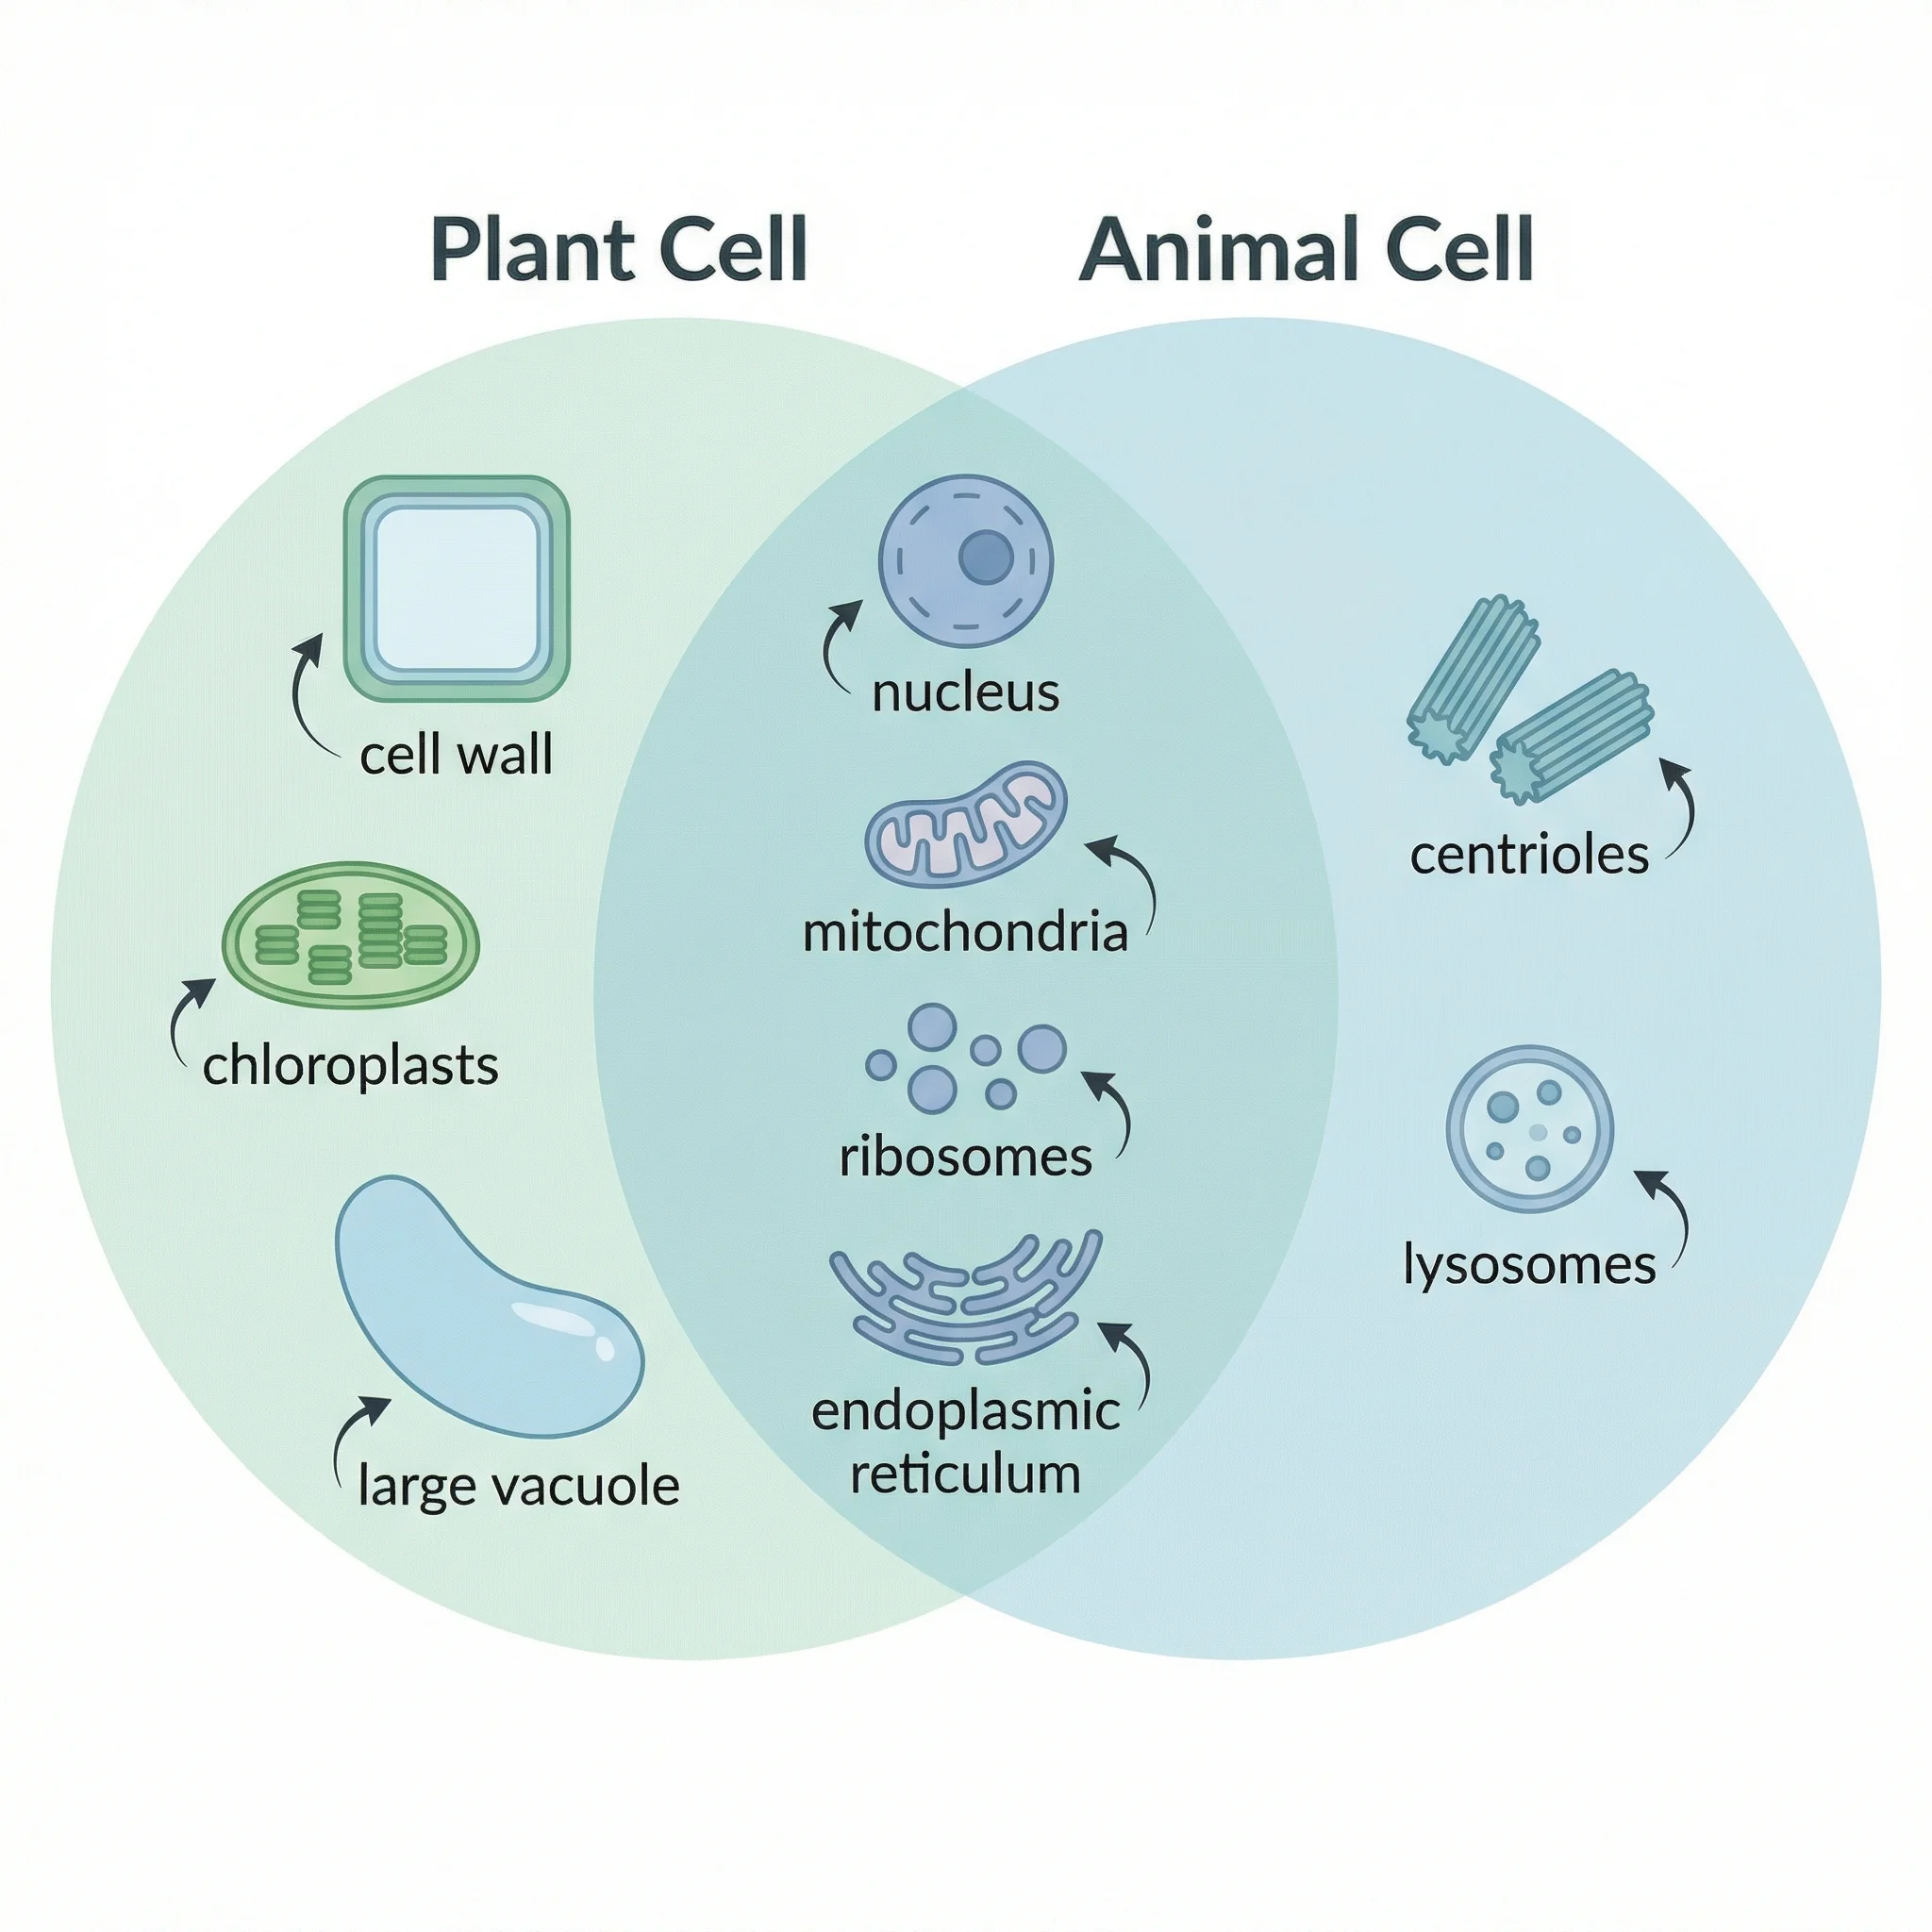
- Venn diagram: overlapping circles that show what two or three topics share and what is unique to each.
- KWL chart: three columns for what students Know, Want to know, and have Learned — ideal for framing a unit.
- T-chart: two side-by-side columns for compare-and-contrast, pros-and-cons, or fact-and-opinion sorting.
- Sequence / flow chart: connected boxes that show steps in order, perfect for processes, timelines, and cause chains.
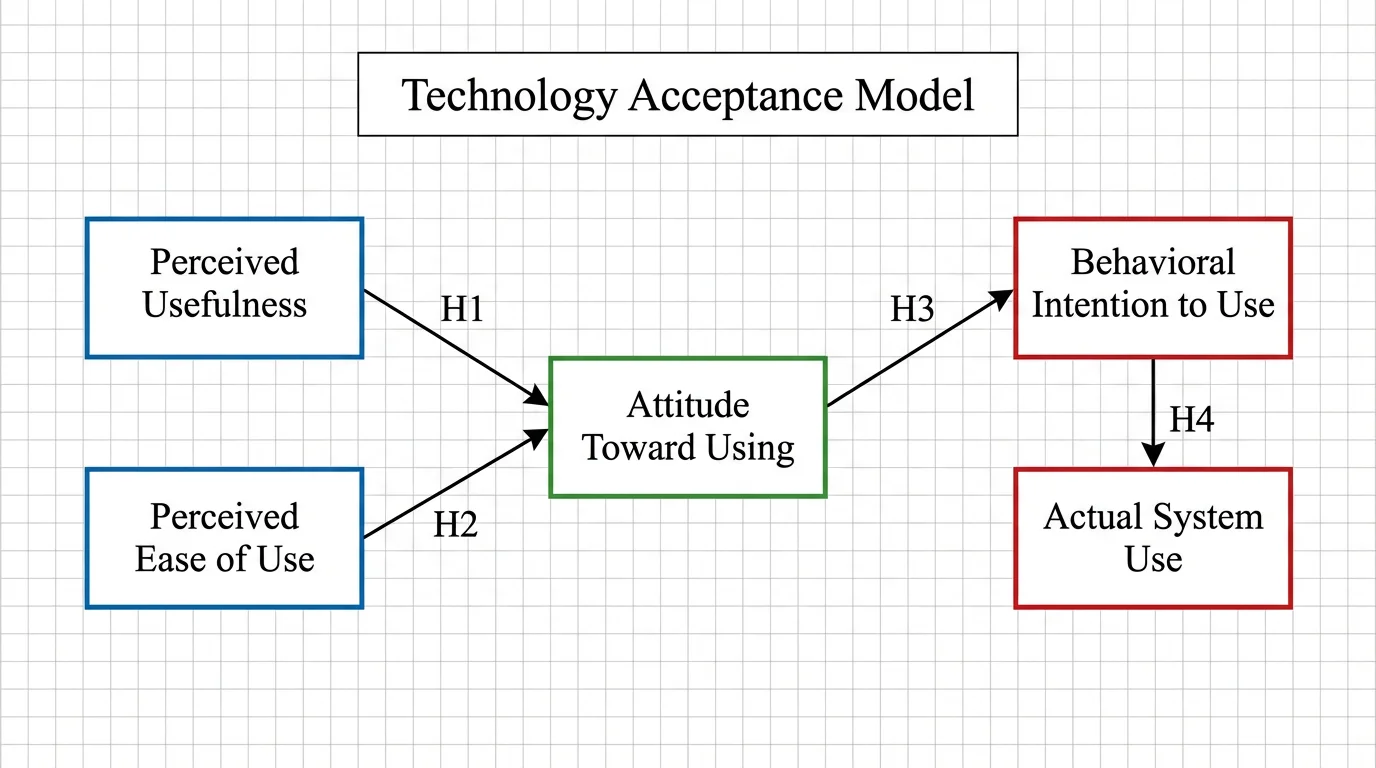
- Concept map: nodes joined by labeled links that name the relationship between ideas, not just the order.
- Frayer model: a four-box vocabulary frame for definition, characteristics, examples, and non-examples.
- Cause-and-effect organizer: arrows that connect one or more causes to their outcomes.
- Story map: a frame for setting, characters, problem, key events, and resolution when analyzing a text.
How graphic organizers support learning
Each layout fits a different kind of thinking. For comprehension, a story map or cause-and-effect chart helps readers track what is happening and why, while a KWL chart anchors new material to what a learner already knows. For brainstorming, a web or cluster map lets ideas spill out and then group themselves into themes before anything is committed to a paragraph. For note-taking, a concept map or T-chart condenses a chapter into a structure that is far easier to review than linear notes — relationships are visible, not buried in prose. Because the information is spatial, recall improves: students can picture where an idea sat on the page, which is why graphic organizers show up so often in study routines and exam prep.
How to pick the right organizer for a task
- Comparing two or three things? Use a Venn diagram for overlap or a T-chart for a tidy side-by-side.
- Explaining a process or timeline? Reach for a sequence or flow chart with connected steps.
- Generating ideas with no fixed structure yet? Start with a web or cluster map and let themes emerge.
- Showing how concepts relate, not just their order? A concept map with labeled links is the best fit.
- Learning vocabulary or a single key term? The Frayer model forces deep, multi-angle understanding.
- Analyzing a story or reading? A story map keeps setting, characters, conflict, and resolution in view.
Using graphic organizers in the classroom and for study
In the classroom, a graphic organizer can frame a whole lesson: hand out a blank KWL chart to surface prior knowledge, use a web to brainstorm essay topics as a group, or project a cause-and-effect chart to unpack a historical event together. They double as formative assessment — a half-filled Frayer model or story map shows exactly where understanding breaks down. For independent study, students can use them to pre-write before an essay, to compress dense readings into a concept map, or to self-quiz from a completed T-chart. Because the same topic can be poured into several layouts, the same content reinforces learning in more than one way, which is one of the most reliable strategies for retention.
How to generate a graphic organizer from a description
- Choose the type of organizer you need — Venn diagram, KWL chart, T-chart, web, sequence, concept map, or story map.
- Describe the topic and the content for each region: what goes in each circle, column, branch, or box.
- Add the grade level or audience so the wording and complexity match your learners.
- Generate the template, review the layout, and refine your description to adjust labels, structure, or detail.
- Use the finished organizer as a worksheet, a slide, or a study aid — print it blank for students to complete or keep it filled as a reference.
Frequently Asked Questions
Related Learning Tools
 Education
Mind Map Generator
Turn a topic into a radiating mind map with branches and sub-branches for brainstorming and planning.
 Education
Venn Diagram Generator
Compare two or three topics with overlapping circles that label what is shared and what is unique.
 Education
Concept Map Generator
Connect ideas with labeled links to show how concepts relate, not just the order they come in.