Carbon Cycle Diagram Generator for Labeled & Blank Diagrams
Generate a labeled carbon cycle diagram from a short description, or a blank version for worksheets. Show photosynthesis, respiration, decomposition, combustion, and ocean exchange across the atmosphere, biosphere, oceans, soil, and fossil fuels — then download for class.
Carbon Cycle Diagram Generator
Free to try ·
Your carbon cycle diagram will appear here
AI-generated — review the labels and arrows for accuracy before using in class
Carbon Cycle Diagram Examples
Labeled, simplified, blank, and ocean and geological versions of the cycle
Complete Labeled Carbon Cycle
Every reservoir and process labeled — the atmosphere, biosphere, oceans, soil, and fossil fuels, linked by carbon flux arrows.
Simplified Carbon Cycle
A cleaner version for younger students, with color-coded arrows and large, easy-to-read labels.
Slow (Geological) Carbon Cycle
The slow cycle over millions of years — volcanic outgassing, weathering, sedimentation, and limestone in rock.
Ocean Carbon Cycle
How the oceans take up CO2 at the surface and move carbon to the deep sea through the biological pump.
Human Impact on the Carbon Cycle
Where people change the cycle — burning fossil fuels, clearing forests, and making cement add CO2 faster than nature removes it.
Blank Carbon Cycle Worksheet
A blank, printable version with numbered blanks and a word bank — ready to use as a fill-in worksheet or quiz.
What is the carbon cycle and why does it matter?
The carbon cycle is the path that carbon atoms follow as they move between the air, living things, the oceans, the soil, and the rocks and fossil fuels underground. The same carbon is used over and over: a carbon atom in the air today might become part of a leaf, then an animal, then soil, then a fossil fuel, then the air again. The cycle matters because carbon dioxide (CO2) in the atmosphere is a greenhouse gas — it traps heat and helps set Earth's temperature. When the cycle is balanced, the amount of CO2 in the air stays roughly steady; when more carbon is added to the air than is removed, the planet warms. That makes the carbon cycle one of the central ideas linking biology, earth science, and climate change.
The main reservoirs: where carbon is stored
- Atmosphere: carbon is stored as carbon dioxide (CO2) gas. This is the smallest of the major stores but the one that changes fastest.
- Biosphere (living organisms): carbon is locked in the bodies of plants, animals, and microbes as sugars, proteins, and other molecules.
- Oceans: the largest active store — carbon dissolves in seawater as CO2 and bicarbonate, and is held in marine life and shells.
- Soil: dead leaves, roots, and organisms break down into carbon-rich organic matter stored in the ground.
- Fossil fuels and rock: coal, oil, natural gas, and limestone hold enormous amounts of carbon locked away for millions of years.
The key processes that move carbon
- Photosynthesis: plants and algae pull CO2 out of the air (or water) and use sunlight to build sugars — moving carbon from the atmosphere into the biosphere.
- Cellular respiration: plants, animals, and microbes break down sugars for energy and release CO2 back into the air.
- Decomposition: when organisms die, decomposers break down their tissues, returning carbon to the soil and the atmosphere.
- Combustion of fossil fuels: burning coal, oil, and gas releases carbon stored underground for millions of years straight into the atmosphere.
- Ocean–atmosphere exchange: CO2 dissolves into the ocean at the surface and is released back, keeping air and sea in constant trade.
- Volcanic outgassing: volcanoes and vents release CO2 from deep in the Earth, the main way carbon returns to the air in the slow cycle.
The fast cycle vs the slow cycle
The carbon cycle works on two very different timescales. The fast (biological) cycle moves carbon between the air, plants, animals, soil, and surface ocean over days to years — this is photosynthesis, respiration, and decomposition happening all around us. The slow (geological) cycle moves carbon between the atmosphere, oceans, and rocks over thousands to millions of years through weathering, sedimentation, the burial of carbon in limestone and fossil fuels, and its eventual release by volcanoes. Showing both on one diagram helps students see why burning fossil fuels is such a big deal: it takes carbon the slow cycle stored away over millions of years and dumps it into the air in just a couple of centuries.
How humans are changing the carbon cycle
For most of Earth's history the carbon cycle was close to balanced. People have changed that in two main ways. First, burning fossil fuels for electricity, transport, and industry releases carbon that was locked underground, adding CO2 to the atmosphere far faster than natural processes remove it. Second, deforestation and land-use change cut down the plants that absorb CO2, weakening a major carbon sink, while activities such as cement production add still more. The result is a steady rise in atmospheric CO2, which strengthens the greenhouse effect and drives climate change. The oceans absorb some of this extra CO2, which slows warming but makes seawater more acidic. A good classroom diagram makes these human inputs visible — usually drawn as separate, often red, arrows next to the natural fluxes.
Labeled vs blank diagrams for the classroom
A labeled carbon cycle diagram names every reservoir and process and is ideal for teaching, notes, and study guides — students can see at a glance how carbon flows from the atmosphere through plants and animals and back again. A blank diagram keeps the same arrows and boxes but replaces the labels with numbered blanks (and often a word bank), which turns it into a worksheet, quiz, or homework sheet. Generating both versions from the same description means your handout and your answer key match exactly. You can make a simplified version for younger students, a detailed version for high school, or a focused version that highlights just photosynthesis and respiration.
Frequently Asked Questions
Related Biology Tools
 Biology
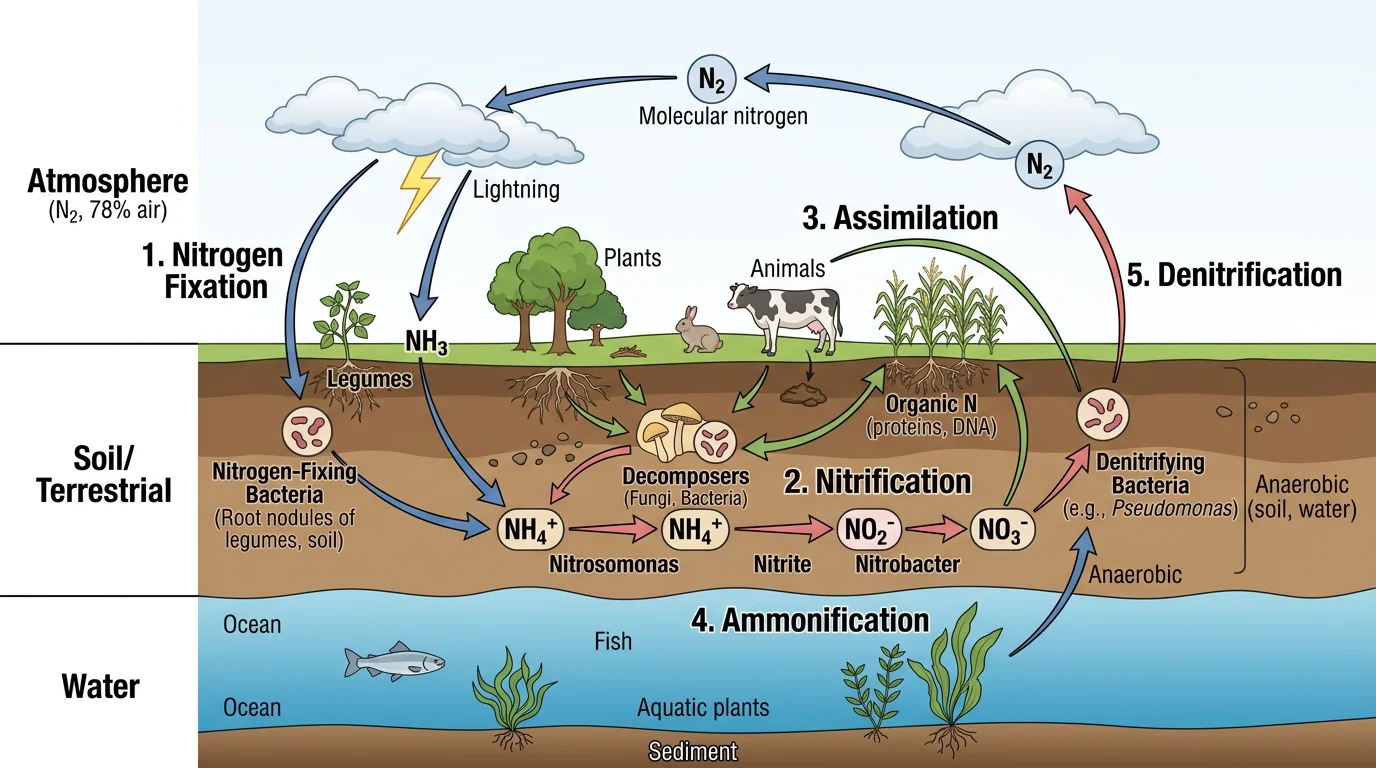
Nitrogen Cycle Diagram Generator
Create labeled nitrogen cycle diagrams showing fixation, nitrification, and denitrification.
 Biology
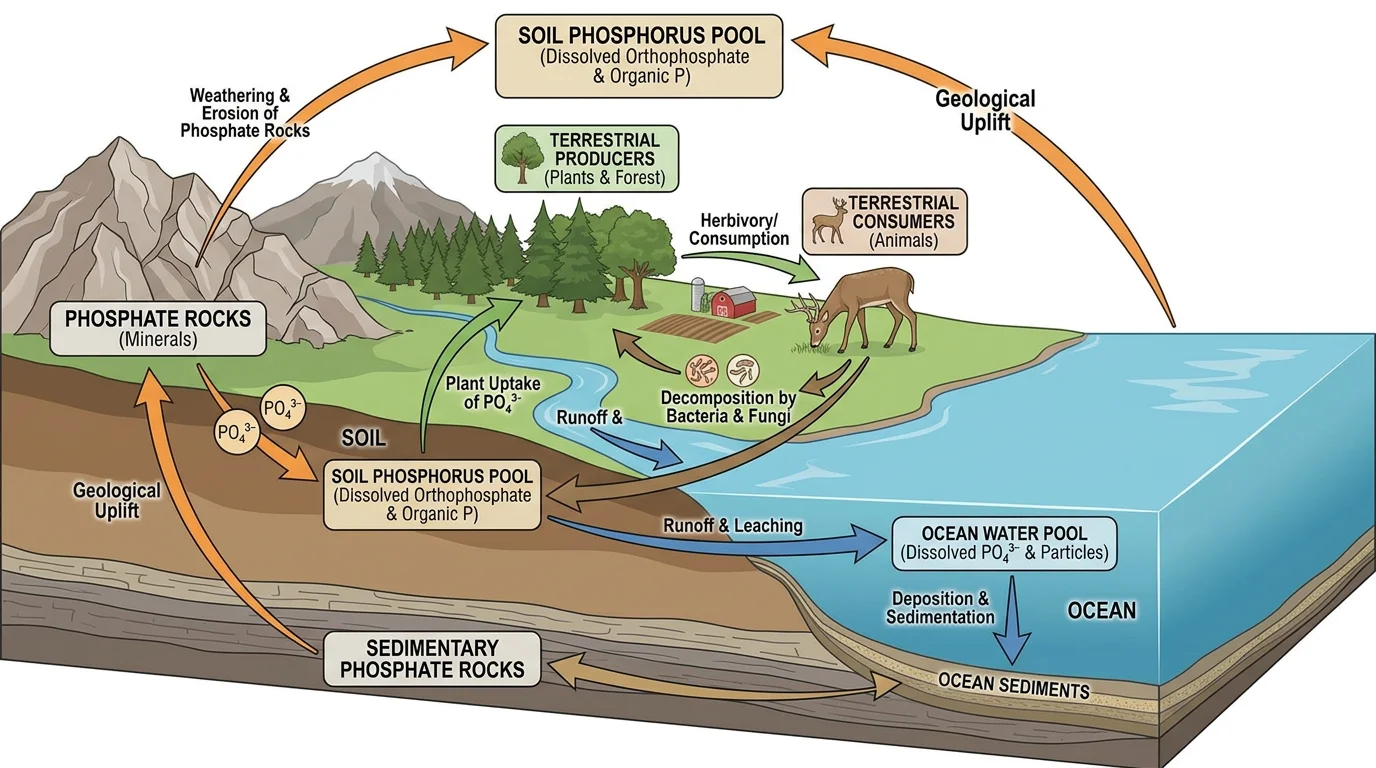
Phosphorus Cycle Diagram Generator
Draw the phosphorus cycle through rock, soil, water, and living organisms.
 Earth Science
Water Cycle Diagram Generator
Make labeled water cycle diagrams with evaporation, condensation, and precipitation.