Titration Curve Generator for Acid–Base Titrations
Generate an acid–base titration curve in seconds. Pick strong acid–strong base, weak acid–strong base, or weak base–strong acid; the tool plots the correct pH curve, marks the equivalence point and the half-equivalence point (pH = pKa), shades the buffer region, and exports SVG or PNG — free.
The half-equivalence point sits at pH = pKa.
Titration Curve Examples
Acid–base titration curves rendered by the exact engine
Strong Acid + Strong Base
A strong–strong titration has a sharp jump and an equivalence point at pH 7.
Weak Acid + Strong Base
A weak acid shows a buffer region, half-equivalence at pH = pKa, and equivalence above pH 7.
Weak Base + Strong Acid
A weak base titrated with acid falls in pH, with the equivalence point below pH 7.
Labeled Titration Curve
Every region labeled — initial, buffer, half-equivalence (pH = pKa), and equivalence.
Acetic Acid + NaOH
A real example: acetic acid (pKa 4.76) titrated with NaOH.
Ammonia + HCl
Another example: ammonia (weak base) titrated with HCl — equivalence is acidic.
What is a titration curve?
A titration curve is a graph of pH versus the volume of titrant added during an acid–base titration. As titrant is added, the pH changes slowly at first, then jumps sharply at the equivalence point — where the moles of acid and base are stoichiometrically equal — before leveling off. The shape of the curve and the pH at the equivalence point depend on whether the acid and base are strong or weak.
The four regions of a titration curve
- Initial pH: the pH of the analyte before any titrant is added.
- Buffer region: for a weak acid or base, the pH rises gradually as a buffer of the species and its conjugate forms.
- Equivalence point: the steep vertical jump where the acid and base have exactly neutralized; its pH is 7 only for a strong–strong titration.
- After equivalence: the pH levels off as excess titrant dominates.
Strong vs weak acid and base titration curves
A strong acid–strong base titration has a sharp jump and an equivalence point at pH 7. A weak acid–strong base titration starts at a higher pH, has a clear buffer region, and an equivalence point above pH 7 (the conjugate base is basic). A weak base–strong acid titration falls in pH, with a buffer region and an equivalence point below pH 7. This tool draws the correct shape for each case.
The equivalence point and half-equivalence point
The equivalence point is where moles of titrant equal moles of analyte — the midpoint of the steep jump. The half-equivalence point (halfway to equivalence) is special for weak acids and bases: there the concentrations of the weak species and its conjugate are equal, so the pH equals the pKa. This is the easiest way to read a pKa off a titration curve, and the tool marks it for you.
How to read pKa from a titration curve
For a weak acid titrated with a strong base, find the equivalence point (the steep jump), then go to half that volume — the half-equivalence point. The pH there equals the pKa of the acid. The buffer region is centered on this point. Adjust the pKa in this generator to see the whole curve shift while the half-equivalence pH tracks the pKa exactly.
When to use the AI illustration mode
Use the exact Titration curve mode for correctly-placed acid–base curves. Switch to AI illustration for extras the template does not cover: a polyprotic acid curve with two equivalence points, an indicator color-change range shaded on the curve, or a picture of the titration apparatus (burette and flask) beside the graph.
よくある質問
Related Chemistry Tools
 Chemistry
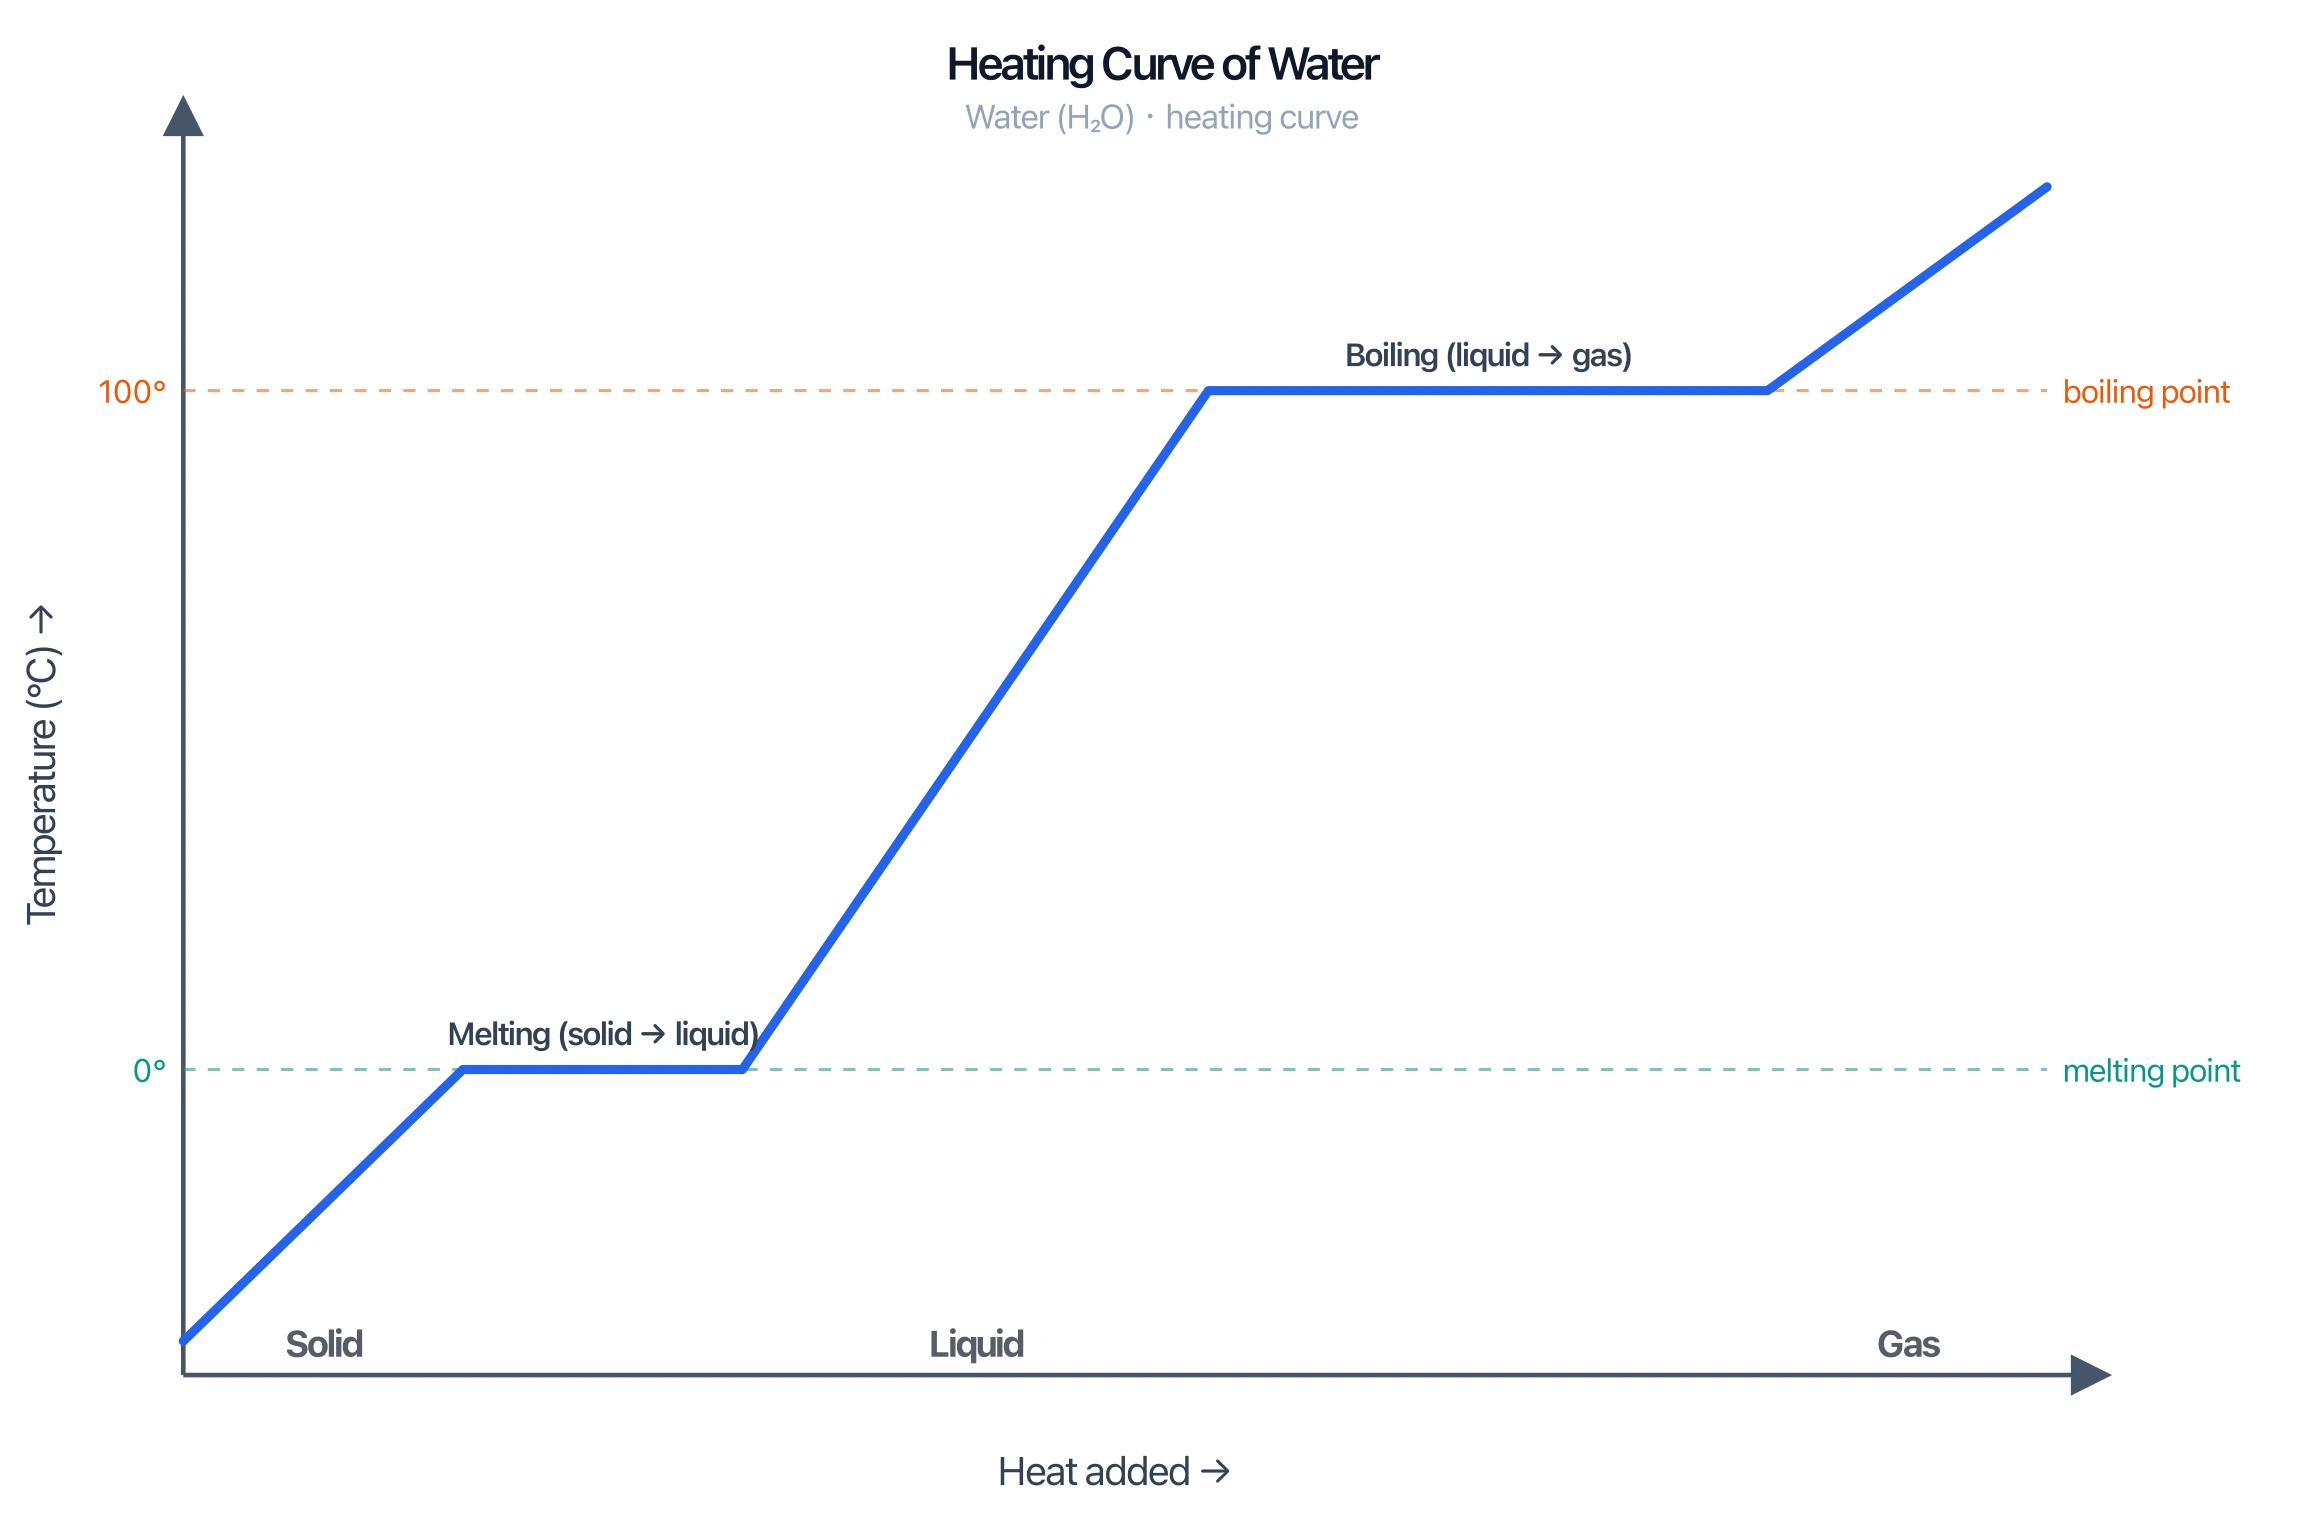
Heating Curve Generator
Plot temperature vs heat added with melting and boiling plateaus for any substance.
 Chemistry
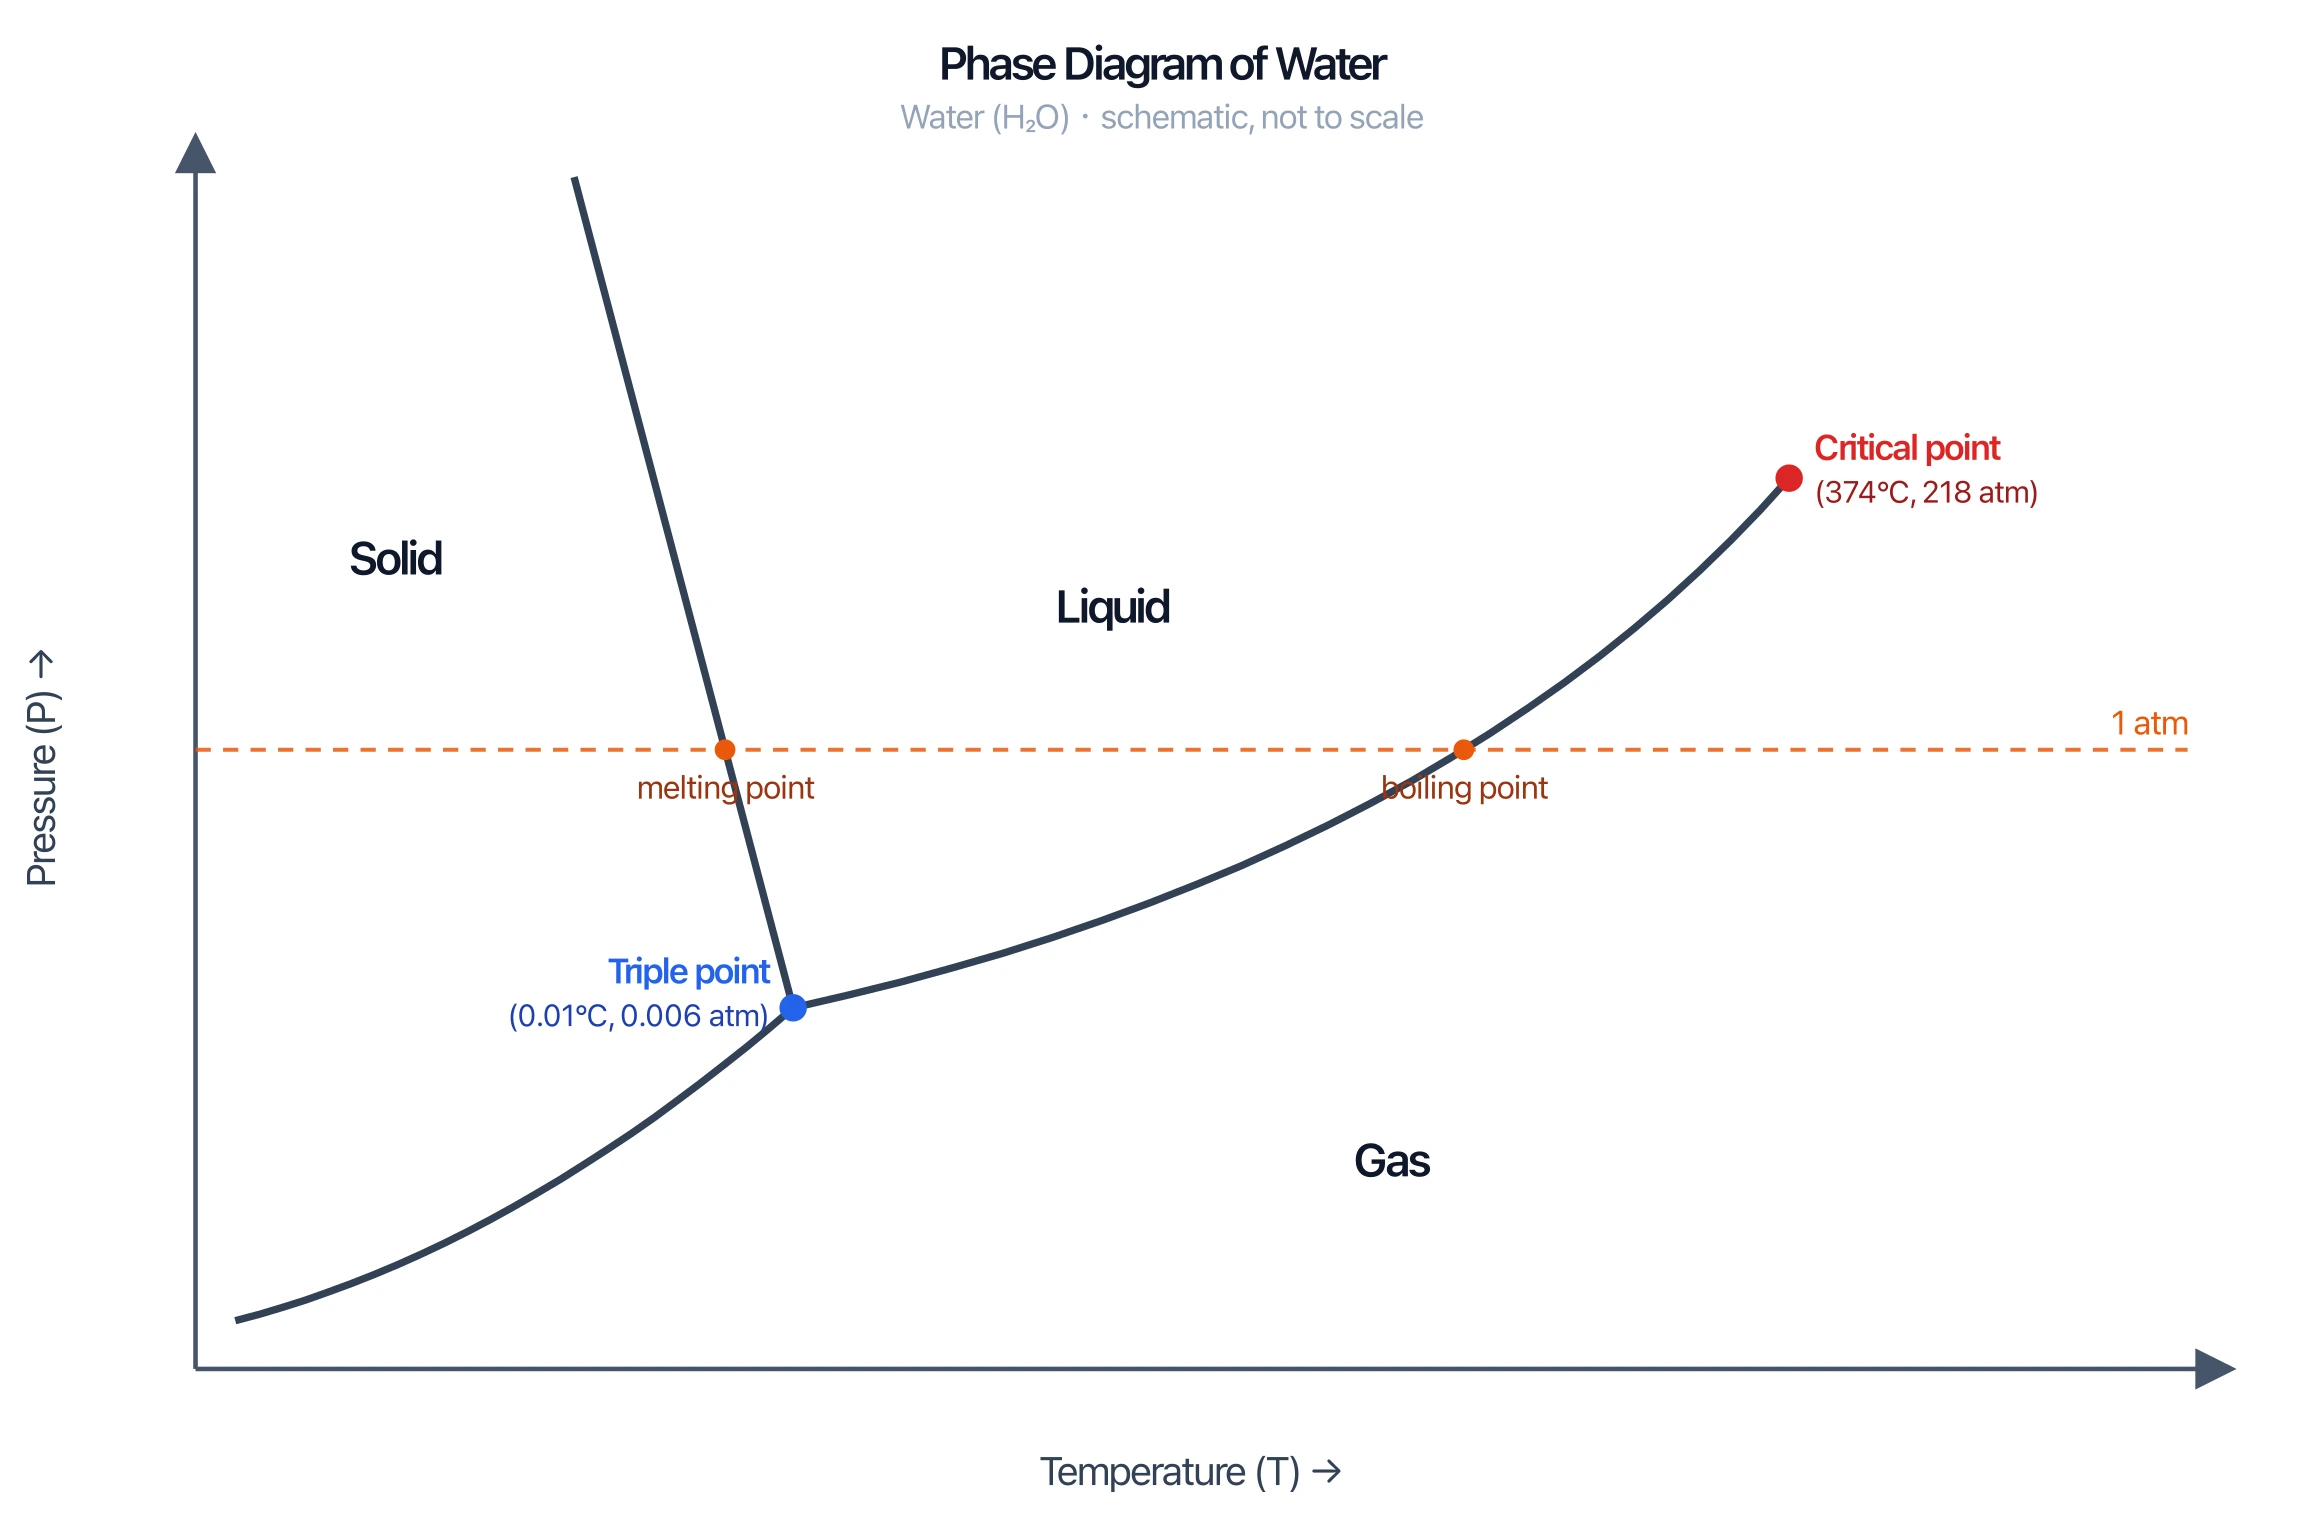
Phase Diagram Generator
Draw pressure–temperature phase diagrams with triple and critical points.
 Chemistry
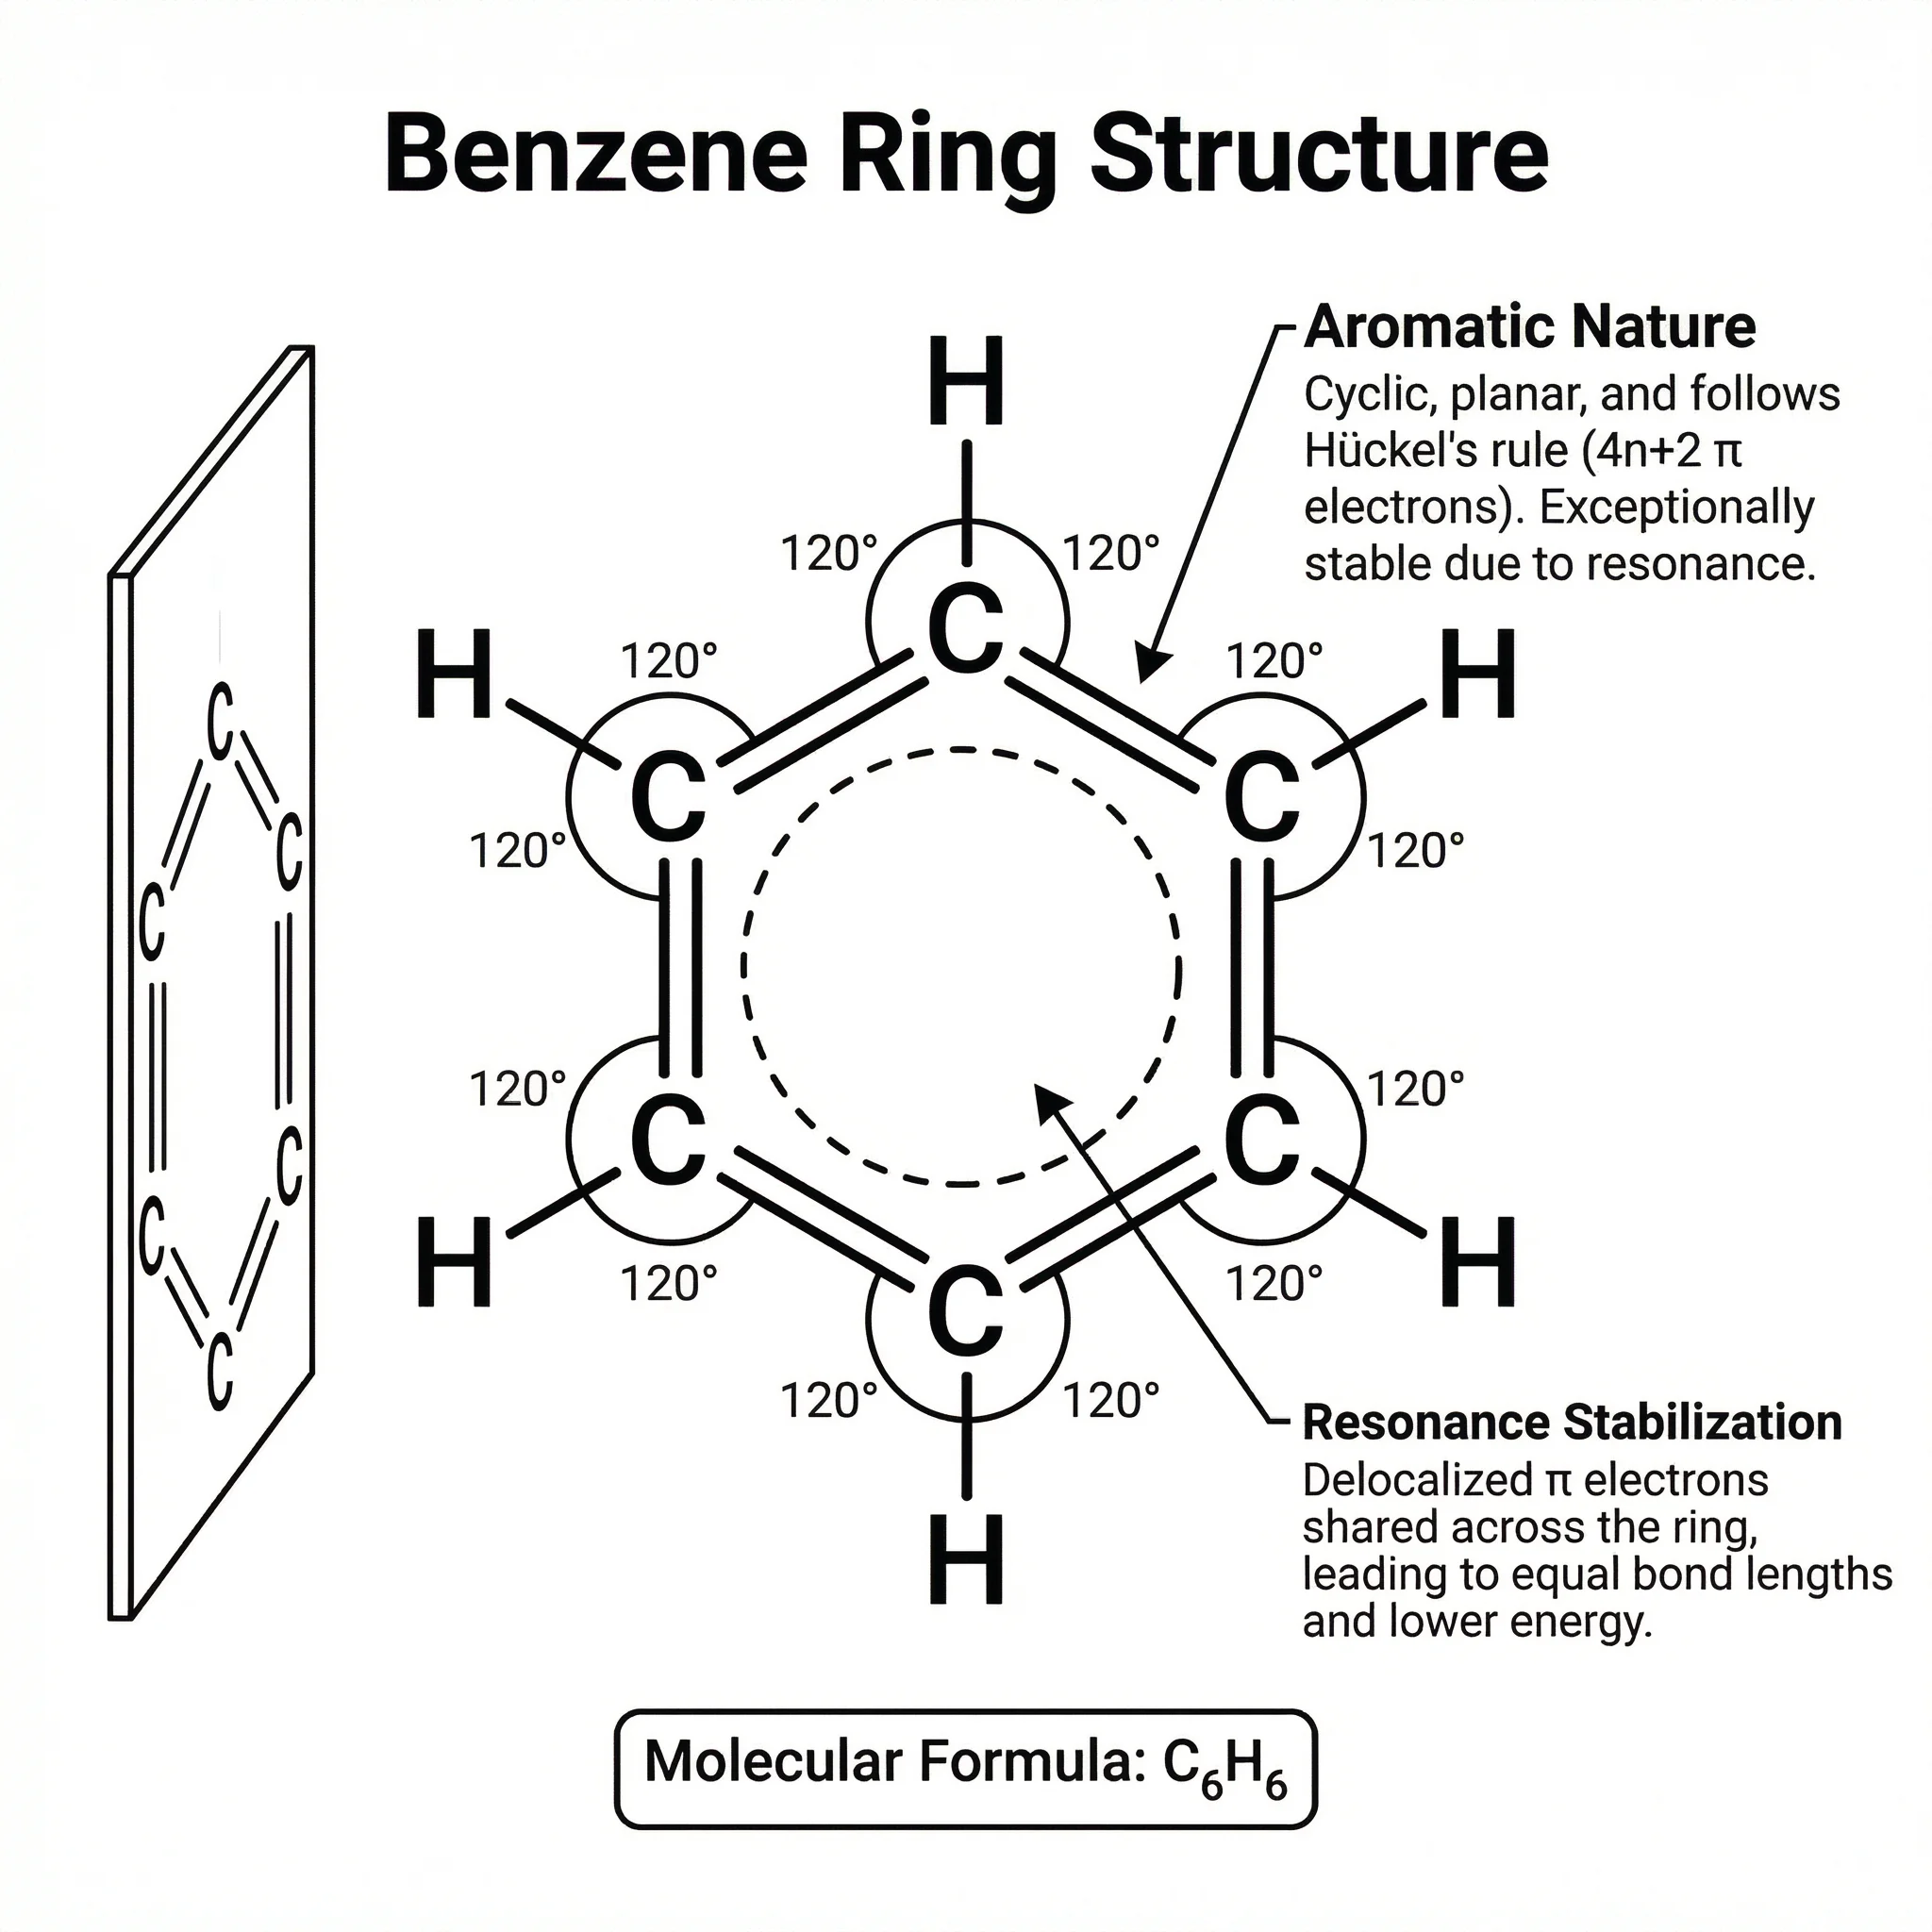
Chemistry Structure Generator
Draw molecules, mechanisms, and chemical structures with clean bonds and labels.