Heating Curve Generator & Phase Change Diagram Maker
Make a heating or cooling curve (phase change diagram) in seconds. Plot temperature vs heat added with flat plateaus at the melting and boiling points, label the solid, liquid, and gas phases, and export SVG or PNG — free.
Heating Curve Examples
Heating and cooling curves rendered by the exact engine
Heating Curve of Water
Temperature rises, then stays flat at 0°C (melting) and 100°C (boiling) while heat is absorbed.
Cooling Curve of Water
A cooling curve mirrors heating — plateaus mark condensing and freezing.
Phase Change Diagram
Set any melting and boiling point — also called a phase change diagram.
Phase Change Segments
Every segment labeled: warming the solid, melting, warming the liquid, boiling, warming the gas.
Heating Curve of Iron
Works for any substance — here iron, melting at 1538°C and boiling at 2862°C.
Cooling Curve with Phase Changes
Flip to a cooling curve to show condensing and freezing as heat is removed.
What is a heating curve?
A heating curve is a graph of temperature versus heat added as a substance is warmed from a solid to a liquid to a gas. It has five parts: the solid warming up, a flat plateau while it melts, the liquid warming up, a flat plateau while it boils, and the gas warming up. The flat plateaus are where a phase change happens — the temperature stays constant even though heat is still being added. It is also called a phase change diagram.
Why are there flat plateaus on a heating curve?
During a phase change (melting or boiling), the added heat goes into breaking the forces between particles rather than raising their kinetic energy, so the temperature stays constant. This heat is the latent heat — the heat of fusion for melting and the heat of vaporization for boiling. The longer vaporization plateau reflects the larger heat of vaporization. On the sloped sections, the heat raises the temperature instead.
The five segments of a heating curve
- Warming the solid: temperature rises until the melting point.
- Melting plateau: solid → liquid at the melting point, temperature constant.
- Warming the liquid: temperature rises until the boiling point.
- Boiling plateau: liquid → gas at the boiling point, temperature constant.
- Warming the gas: temperature rises again.
Heating curve vs cooling curve
A cooling curve is the reverse of a heating curve: as heat is removed, the gas cools, condenses (plateau), the liquid cools, freezes (plateau), and the solid cools. The plateaus occur at the same temperatures as melting and boiling but represent condensing and freezing. Use the direction toggle to switch between a heating curve and a cooling curve.
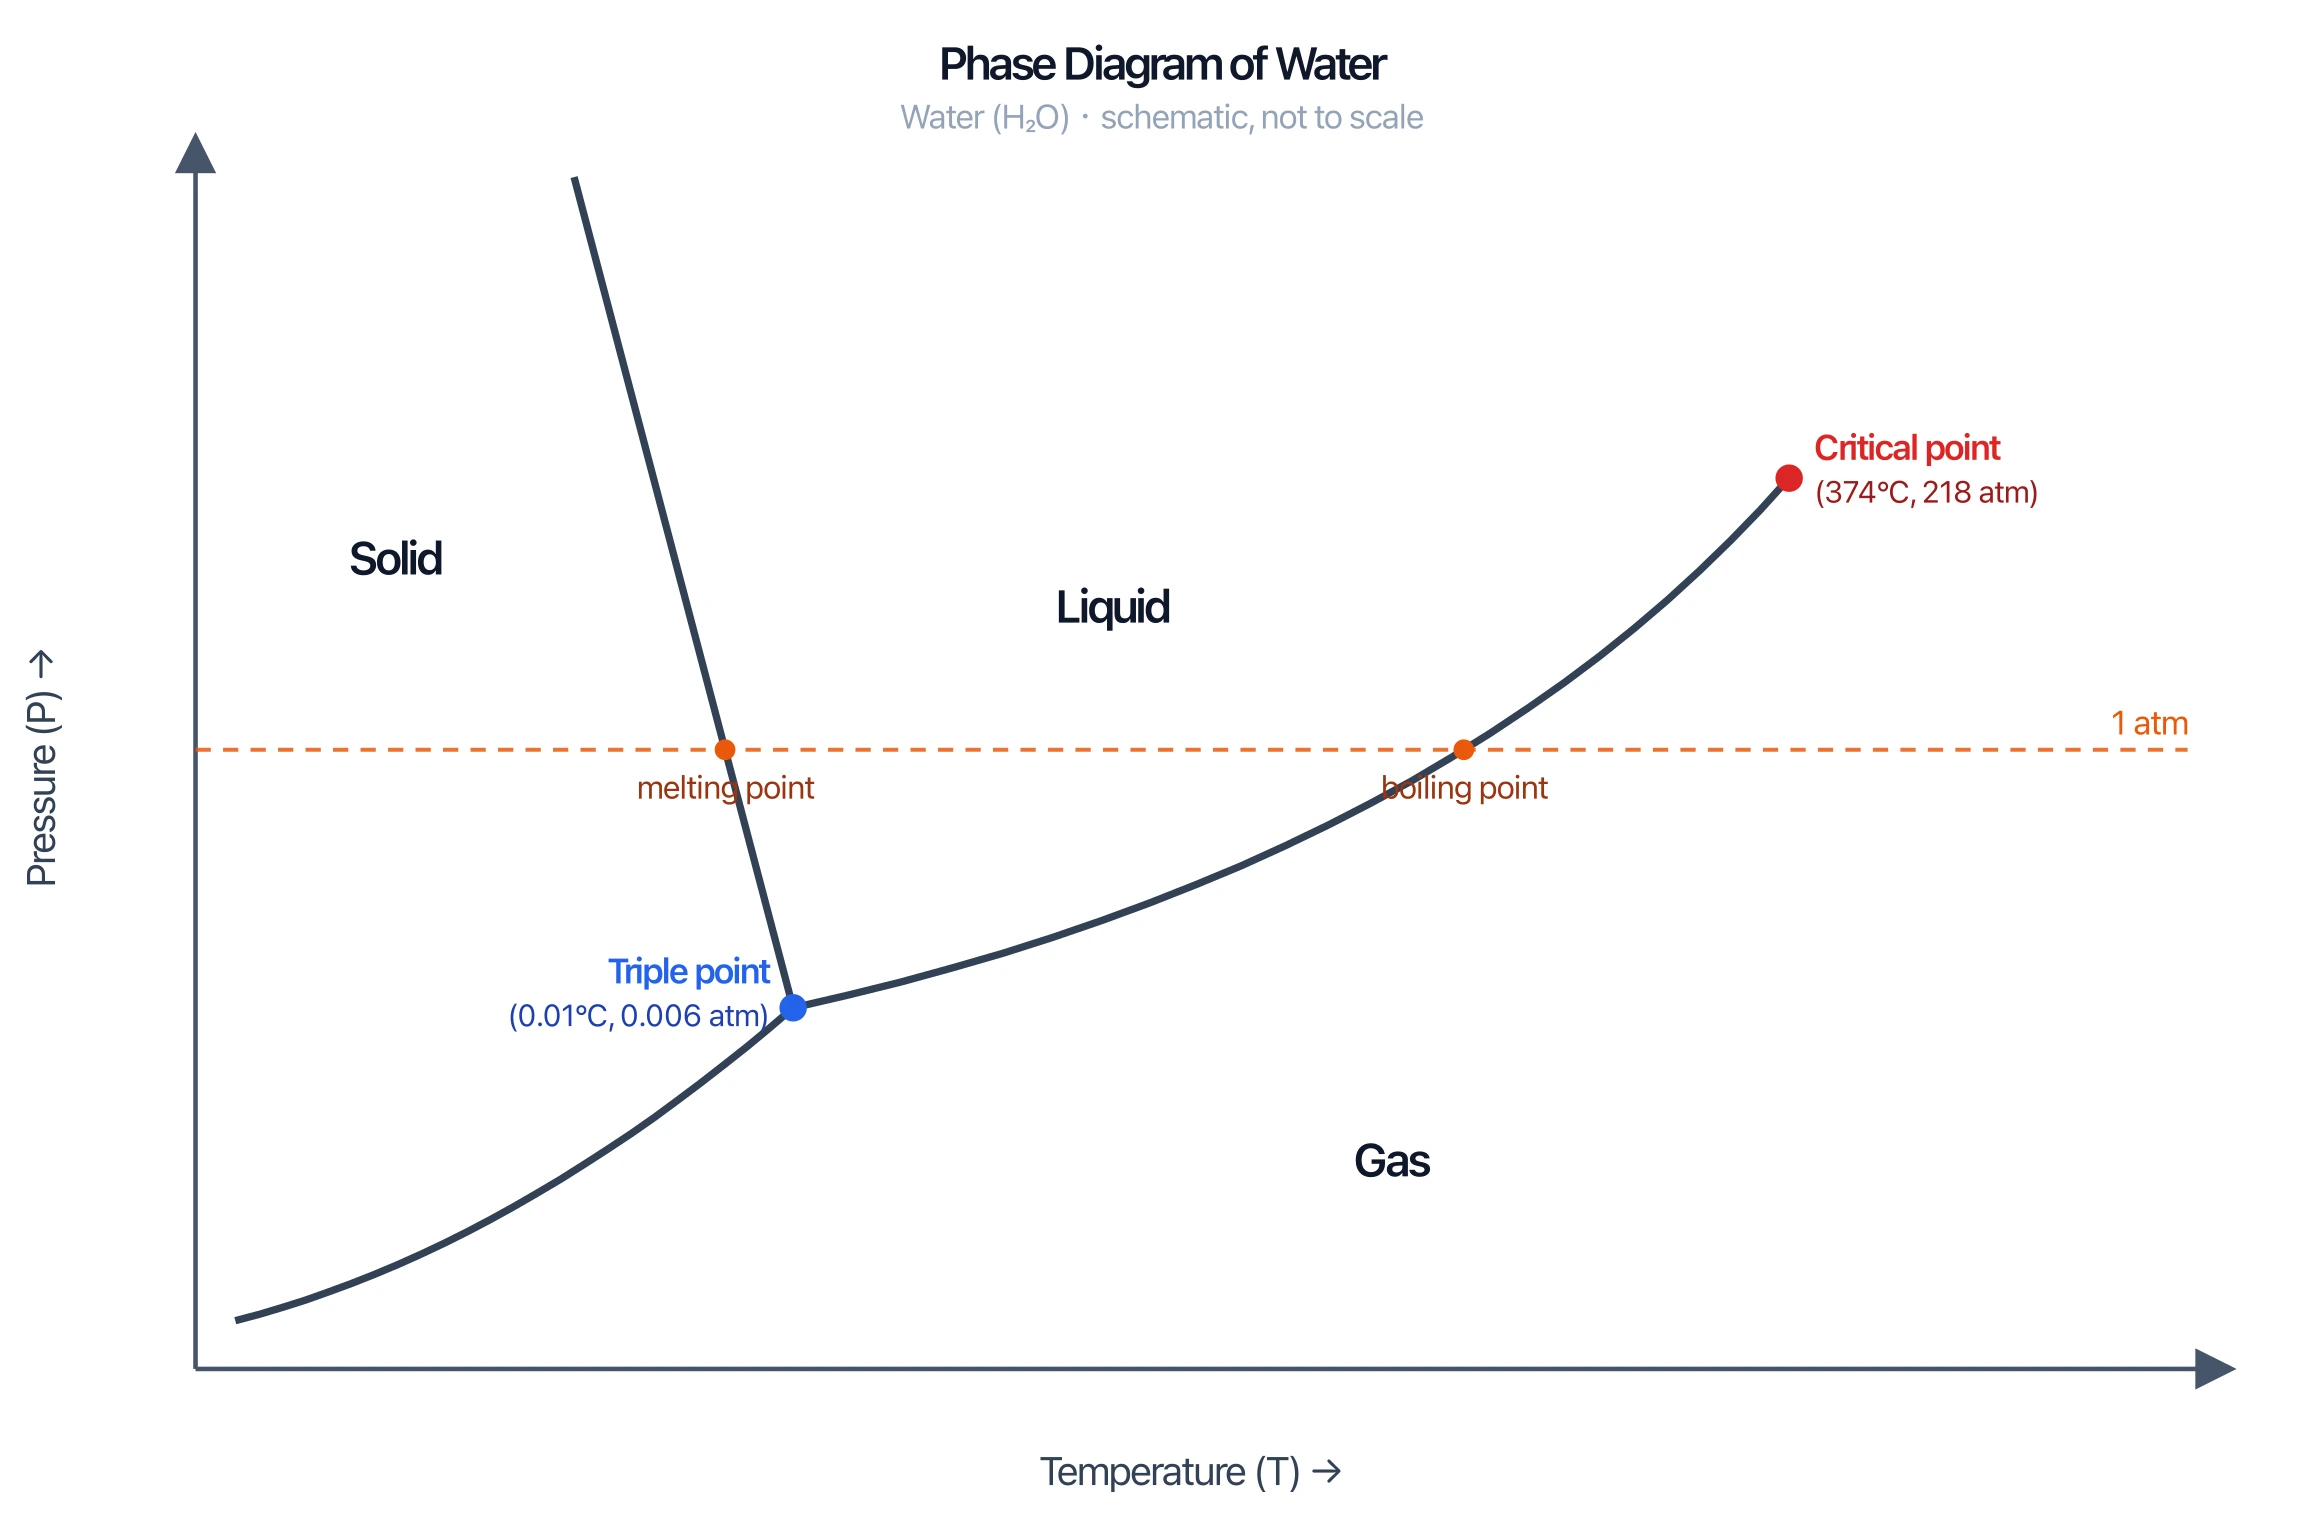
Heating curve vs phase diagram
A heating curve plots temperature against heat added at constant pressure, showing when phase changes happen as you add energy. A P–T phase diagram instead plots pressure against temperature to show which phase is stable at each combination. They are complementary — for the pressure–temperature version, use the phase diagram generator.
When to use the AI illustration mode
Use the exact Heating curve mode for a correctly-plateaued temperature-vs-heat graph for any substance. Switch to AI illustration for richly annotated versions — with particle diagrams of each phase, heat of fusion and vaporization labels, or kinetic-vs-potential-energy annotations.
よくある質問
Related Chemistry Tools
 Chemistry
Phase Diagram Generator
Draw pressure–temperature phase diagrams for water, CO₂, or any substance with triple and critical points.
 Chemistry
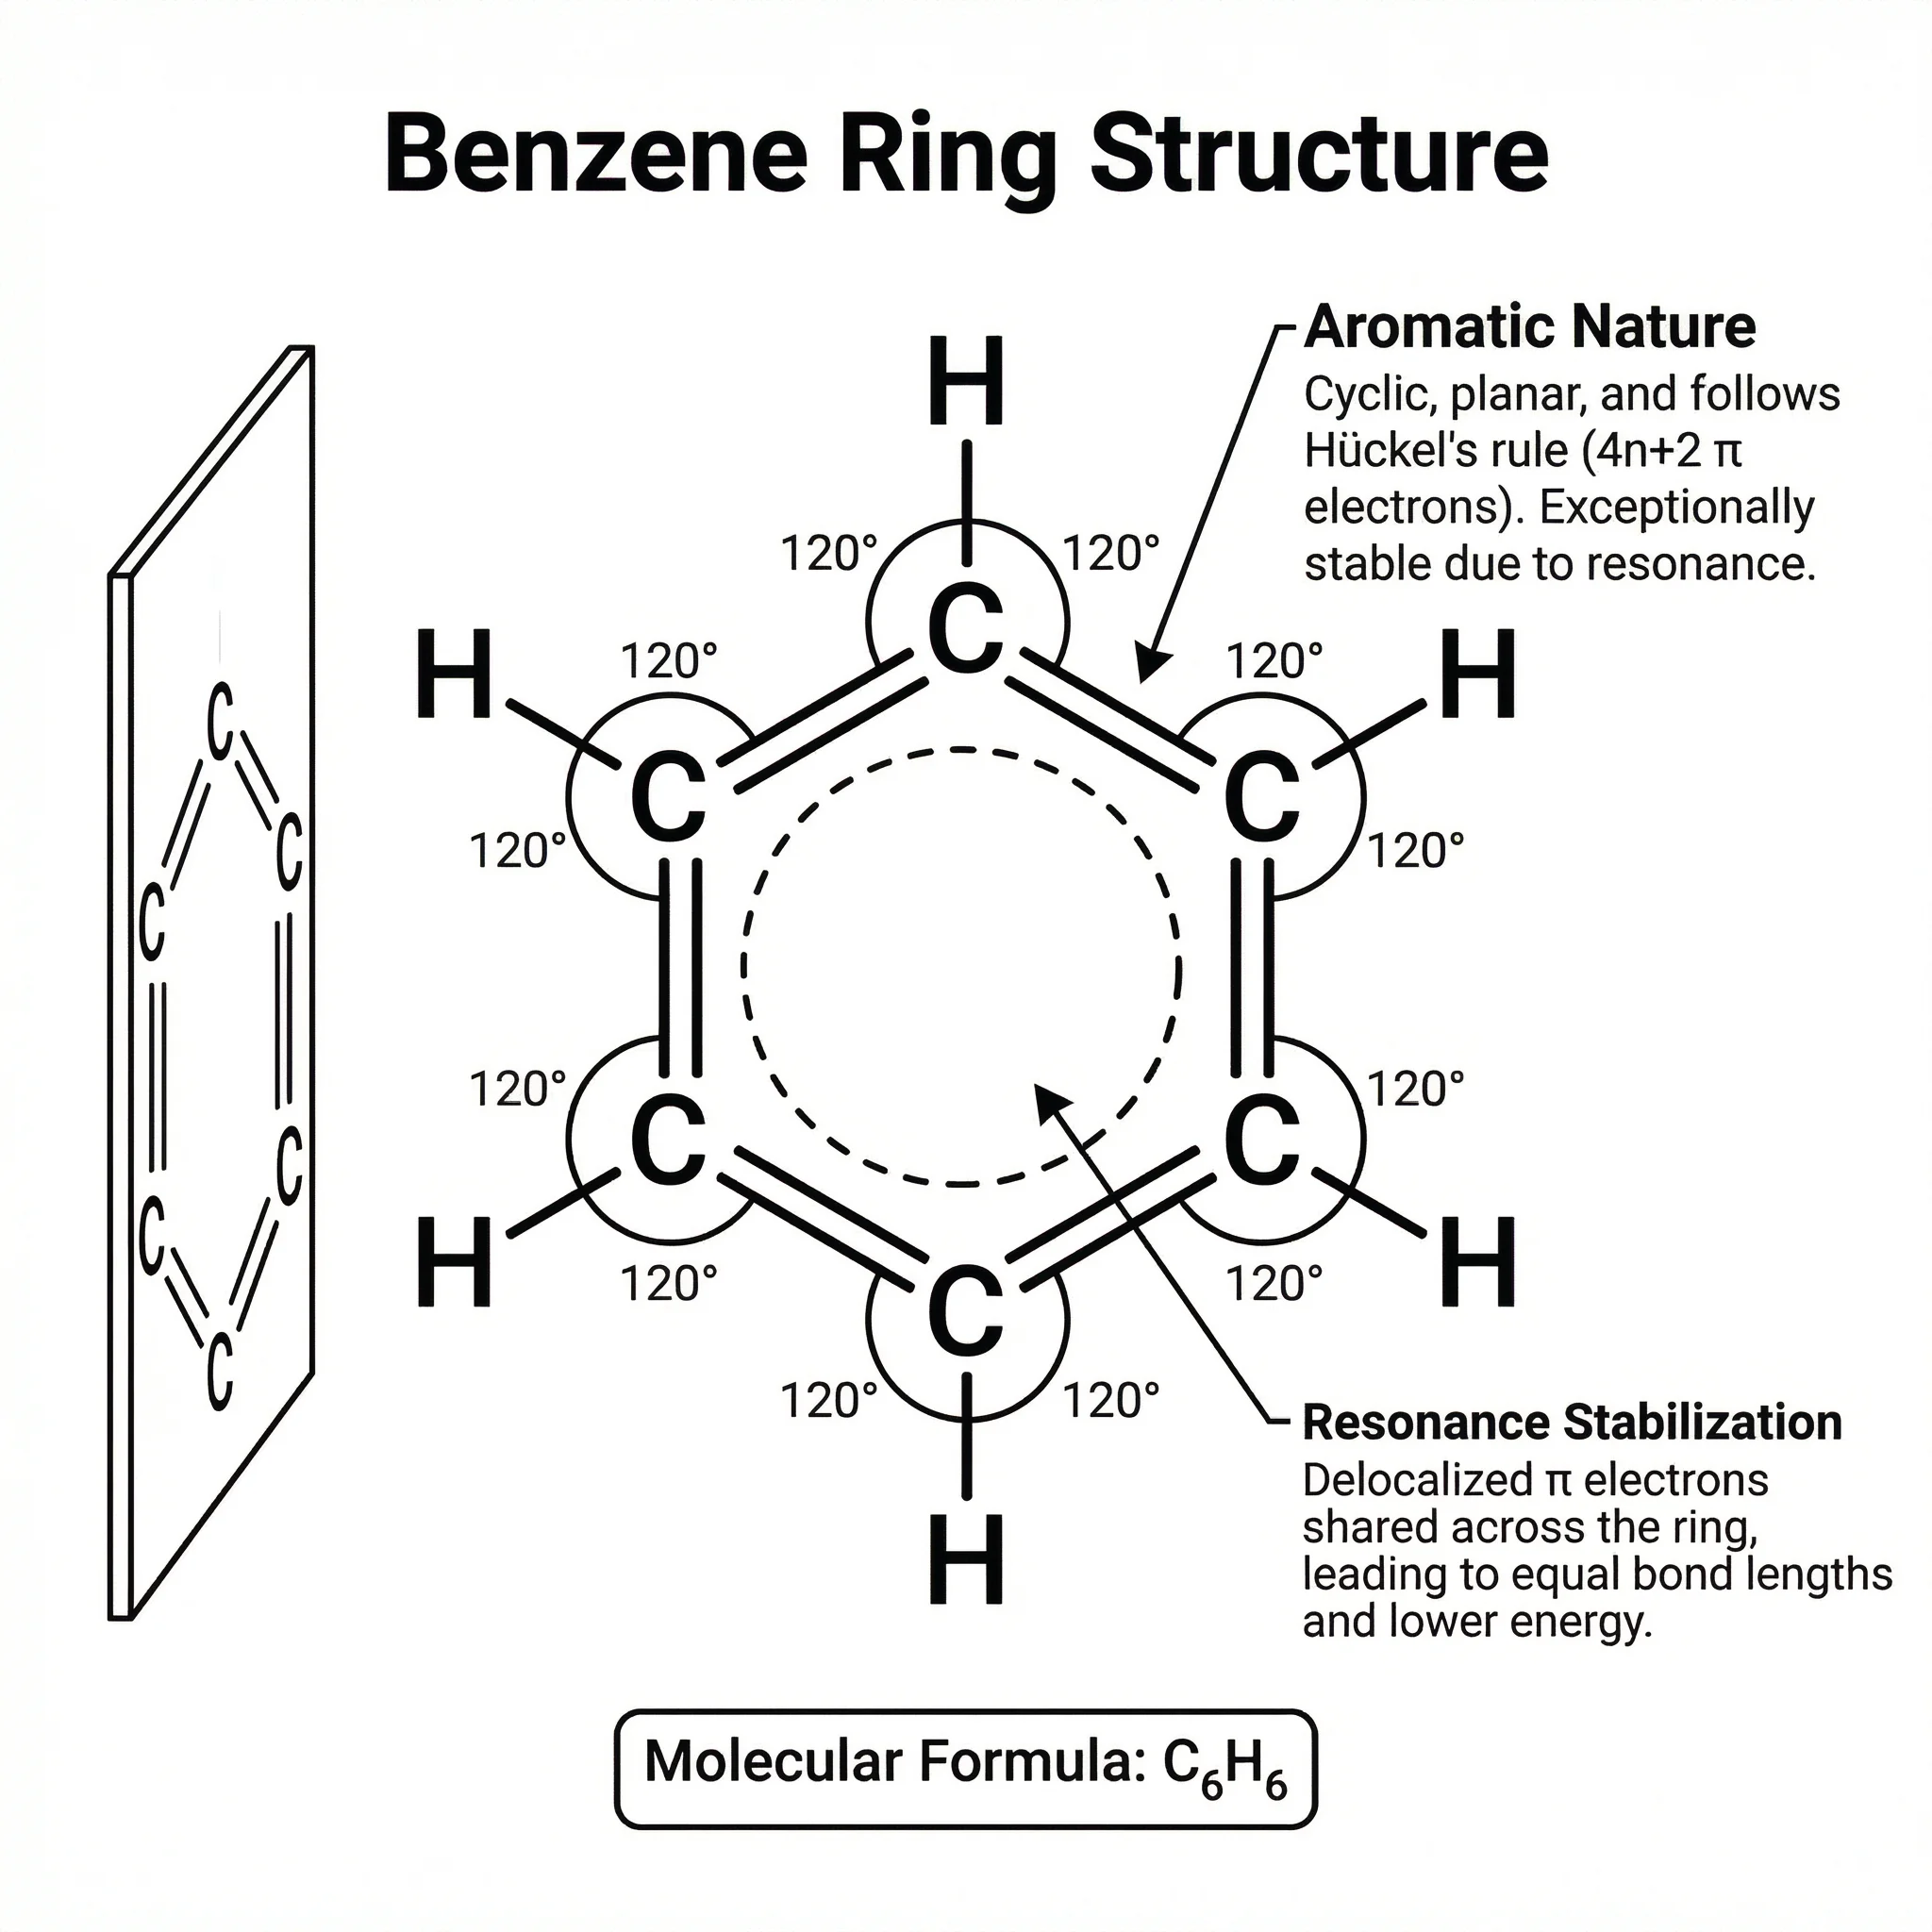
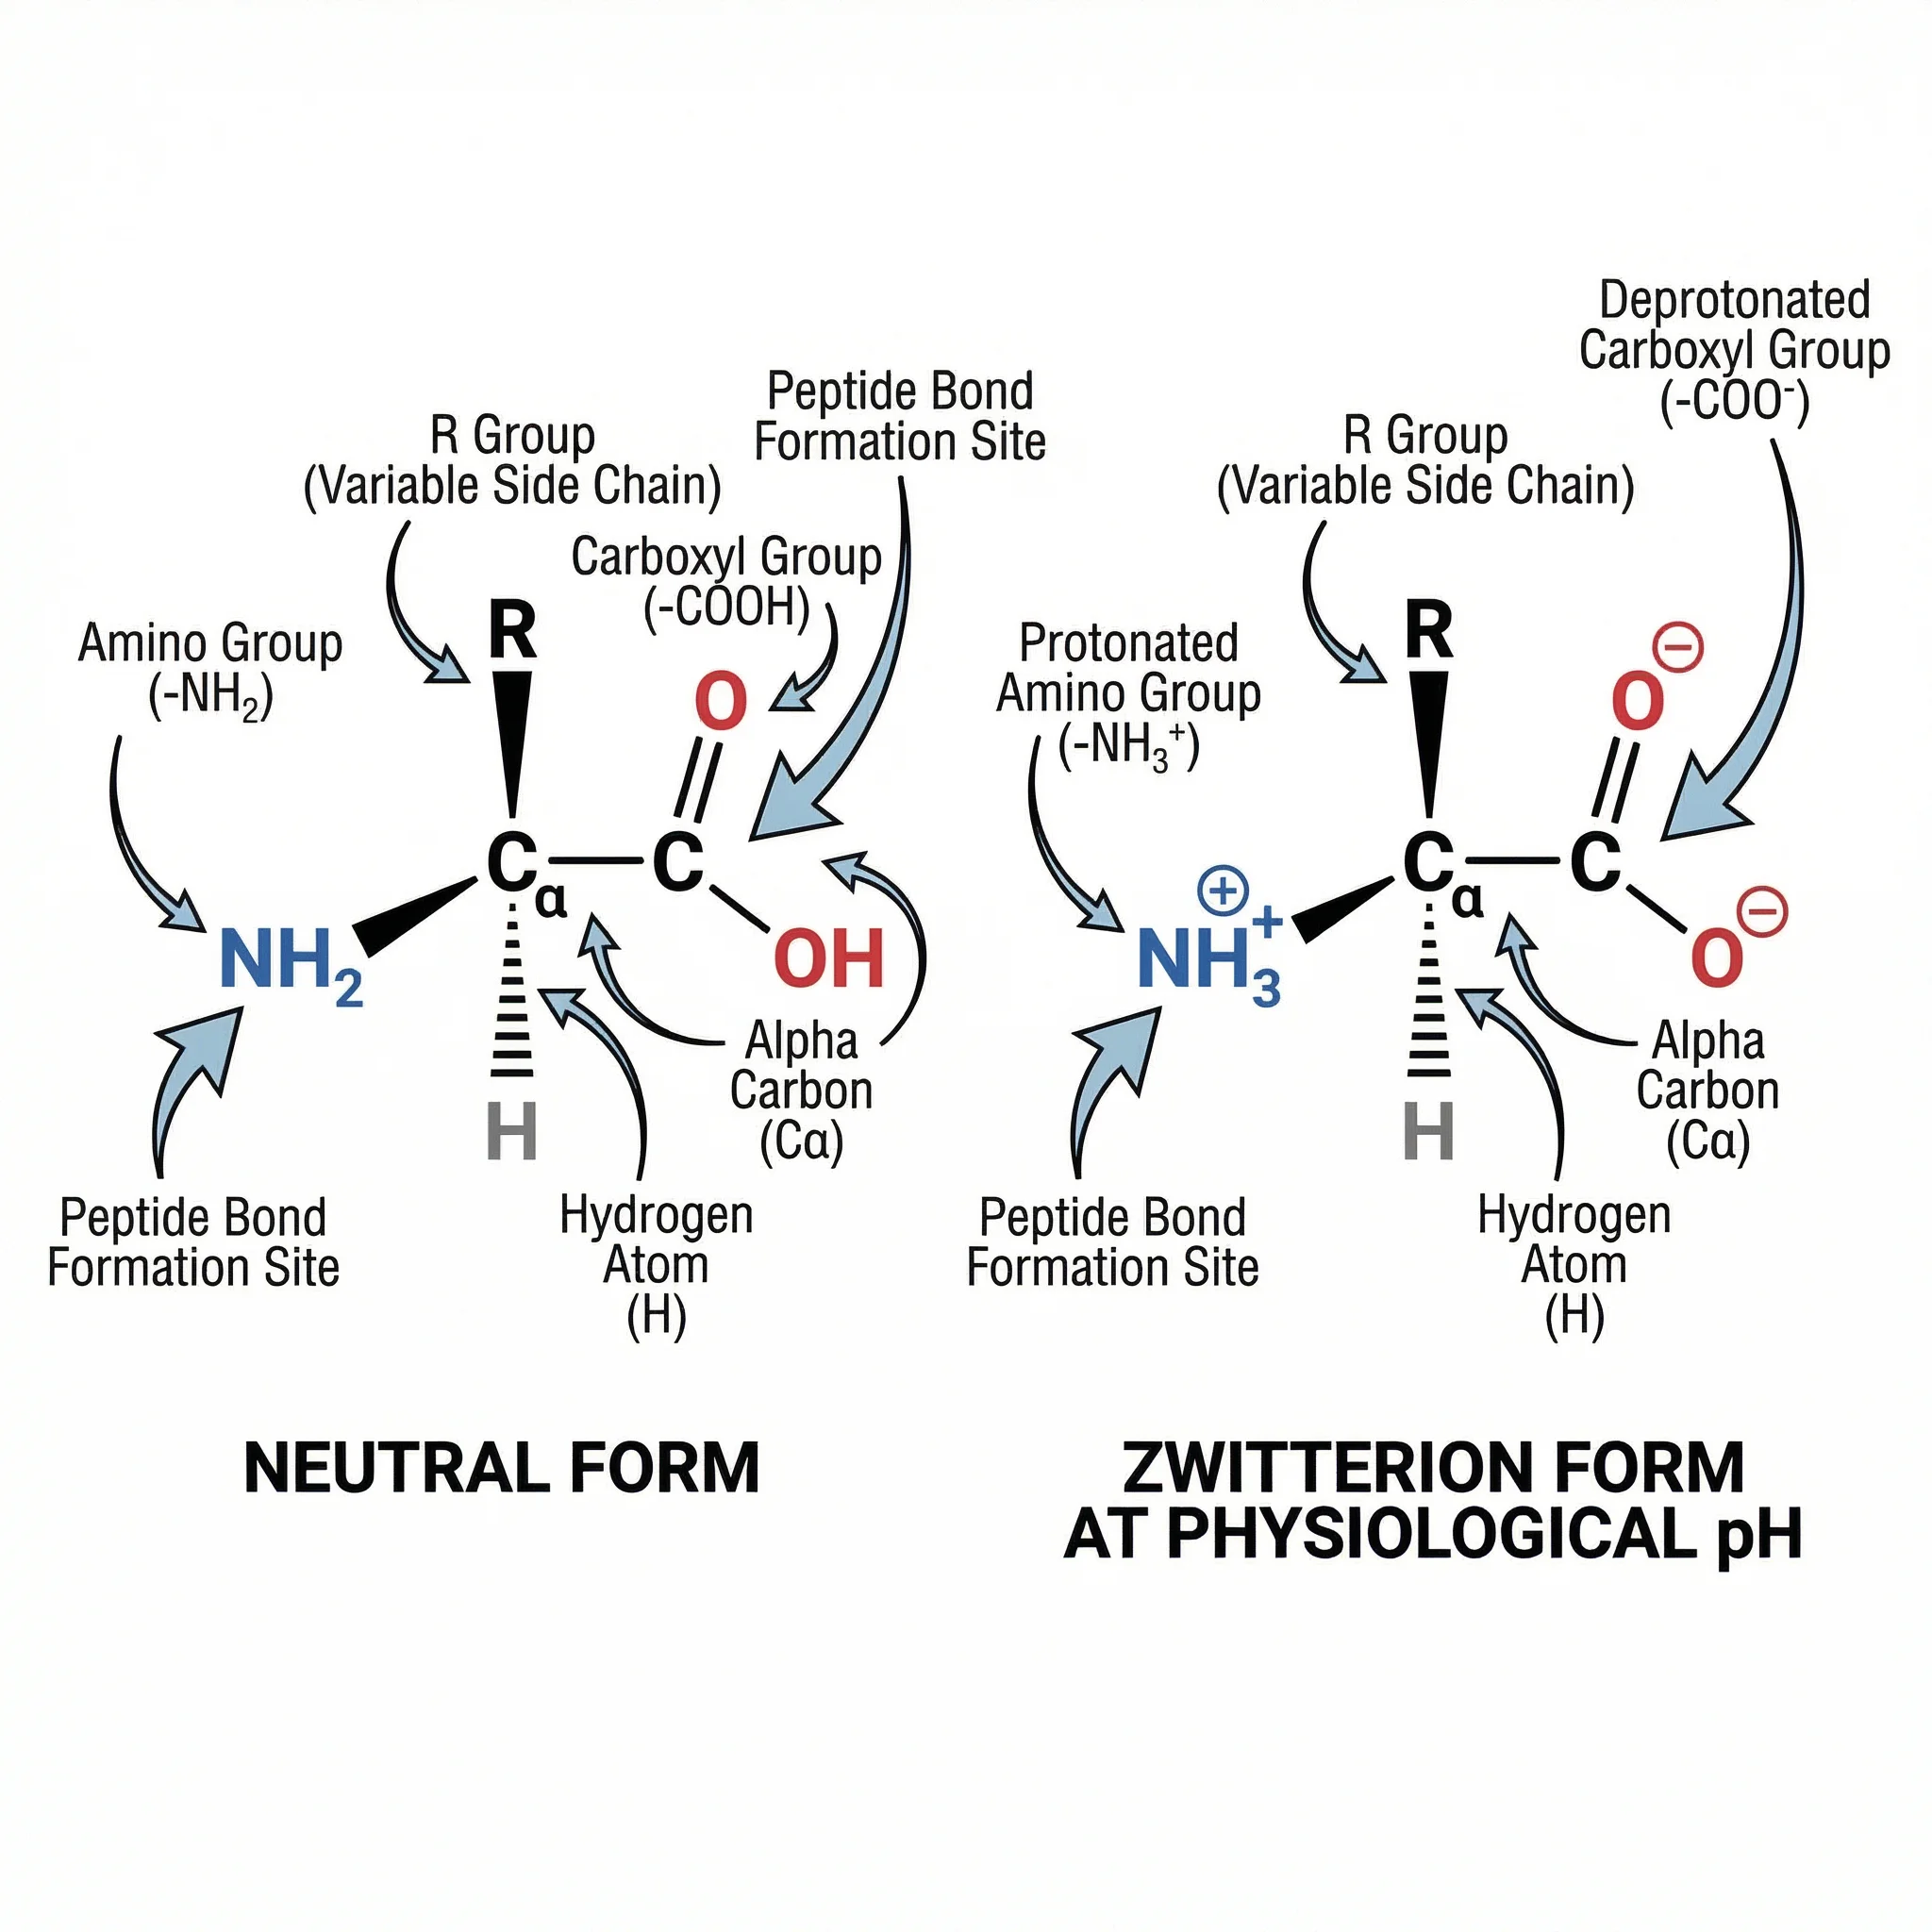
Chemistry Structure Generator
Draw molecules, mechanisms, and chemical structures with clean bonds and labels.
 Chemistry
Bohr Model Maker
Create Bohr model atomic diagrams showing electron shells for any element.