DNA Structure Diagram Generator for the Labeled Double Helix
Make a clearly labeled DNA structure diagram in seconds. Show the sugar–phosphate backbone, base pairs (A–T, G–C), hydrogen bonds, and antiparallel 5′ and 3′ ends — with correct complementary base pairing — then export SVG or PNG, free.
12 base pairs · 6 A–T · 6 G–C
GC content 50% · 30 hydrogen bonds total
5′-ATGCGTACGCAT-3′
3′-TACGCATGCGTA-5′
DNA Structure Examples
Labeled double-helix diagrams rendered by the exact engine
Labeled DNA Structure
Every structural part labeled — backbone, base pairs, hydrogen bonds, and the antiparallel 5′/3′ ends.
Base Pairs & Hydrogen Bonds
A–T pairs show two hydrogen bonds and G–C pairs show three — exactly, every time.
Antiparallel Strands
The two strands run in opposite directions — 5′→3′ on one side, 3′→5′ on the other.
DNA Ladder Diagram
Type any sequence — the complementary strand and base pairs are built for you.
GC-Rich DNA
GC-rich DNA has more hydrogen bonds (three per pair) and is more stable.
AT-Rich DNA
AT-rich DNA has fewer hydrogen bonds (two per pair) and separates more easily.
What is the structure of DNA?
DNA (deoxyribonucleic acid) is a double helix made of two long strands twisted around each other. Each strand is a chain of nucleotides, and each nucleotide has three parts: a phosphate group, a deoxyribose sugar, and a nitrogenous base. The sugars and phosphates form the sugar–phosphate backbone on the outside, while the bases point inward and pair up to form the rungs of the ladder. This generator draws that structure with every part labeled.
The labeled parts of a DNA diagram
- Sugar–phosphate backbone: the two outer strands, made of alternating deoxyribose sugars and phosphate groups.
- Nitrogenous bases: adenine (A), thymine (T), guanine (G), and cytosine (C) — color-coded in the diagram.
- Base pairs: the rungs of the ladder, where a base on one strand pairs with its complement on the other.
- Hydrogen bonds: the weak bonds holding each base pair together.
- 5′ and 3′ ends: the two ends of each strand, which run in opposite directions (antiparallel).
Base pairing rules: why A pairs with T and G with C
Base pairing is complementary and fixed: adenine always pairs with thymine (A–T), and guanine always pairs with cytosine (G–C). The pairs are held together by hydrogen bonds — two between A and T, and three between G and C. Because G–C pairs have an extra hydrogen bond, GC-rich DNA is more stable and harder to separate. This tool generates the complementary strand from your sequence automatically, so the pairing and bond counts are always correct.
Why are the two DNA strands antiparallel?
The two strands of DNA run in opposite directions: one goes 5′ to 3′ while the other goes 3′ to 5′. This antiparallel arrangement lets the bases line up and pair correctly, and it is essential for how enzymes read and copy DNA during replication. The diagram labels the 5′ and 3′ ends on both strands so the antiparallel structure is clear — a detail that is easy to get wrong.
DNA vs RNA structure
DNA and RNA are both nucleic acids but differ in structure: DNA is double-stranded while RNA is usually single-stranded; DNA uses the sugar deoxyribose while RNA uses ribose; and DNA uses the base thymine (T) while RNA uses uracil (U) in its place. For a labeled DNA double helix use the Labeled diagram mode; for a DNA-vs-RNA comparison illustration, use the AI illustration mode.
Who discovered the structure of DNA?
The double-helix structure of DNA was described in 1953 by James Watson and Francis Crick, building on the X-ray diffraction work of Rosalind Franklin and Maurice Wilkins. Their model explained how DNA could store genetic information and be copied — and it is the structure this tool draws.
常见问题
Related Biology Tools
 Biology
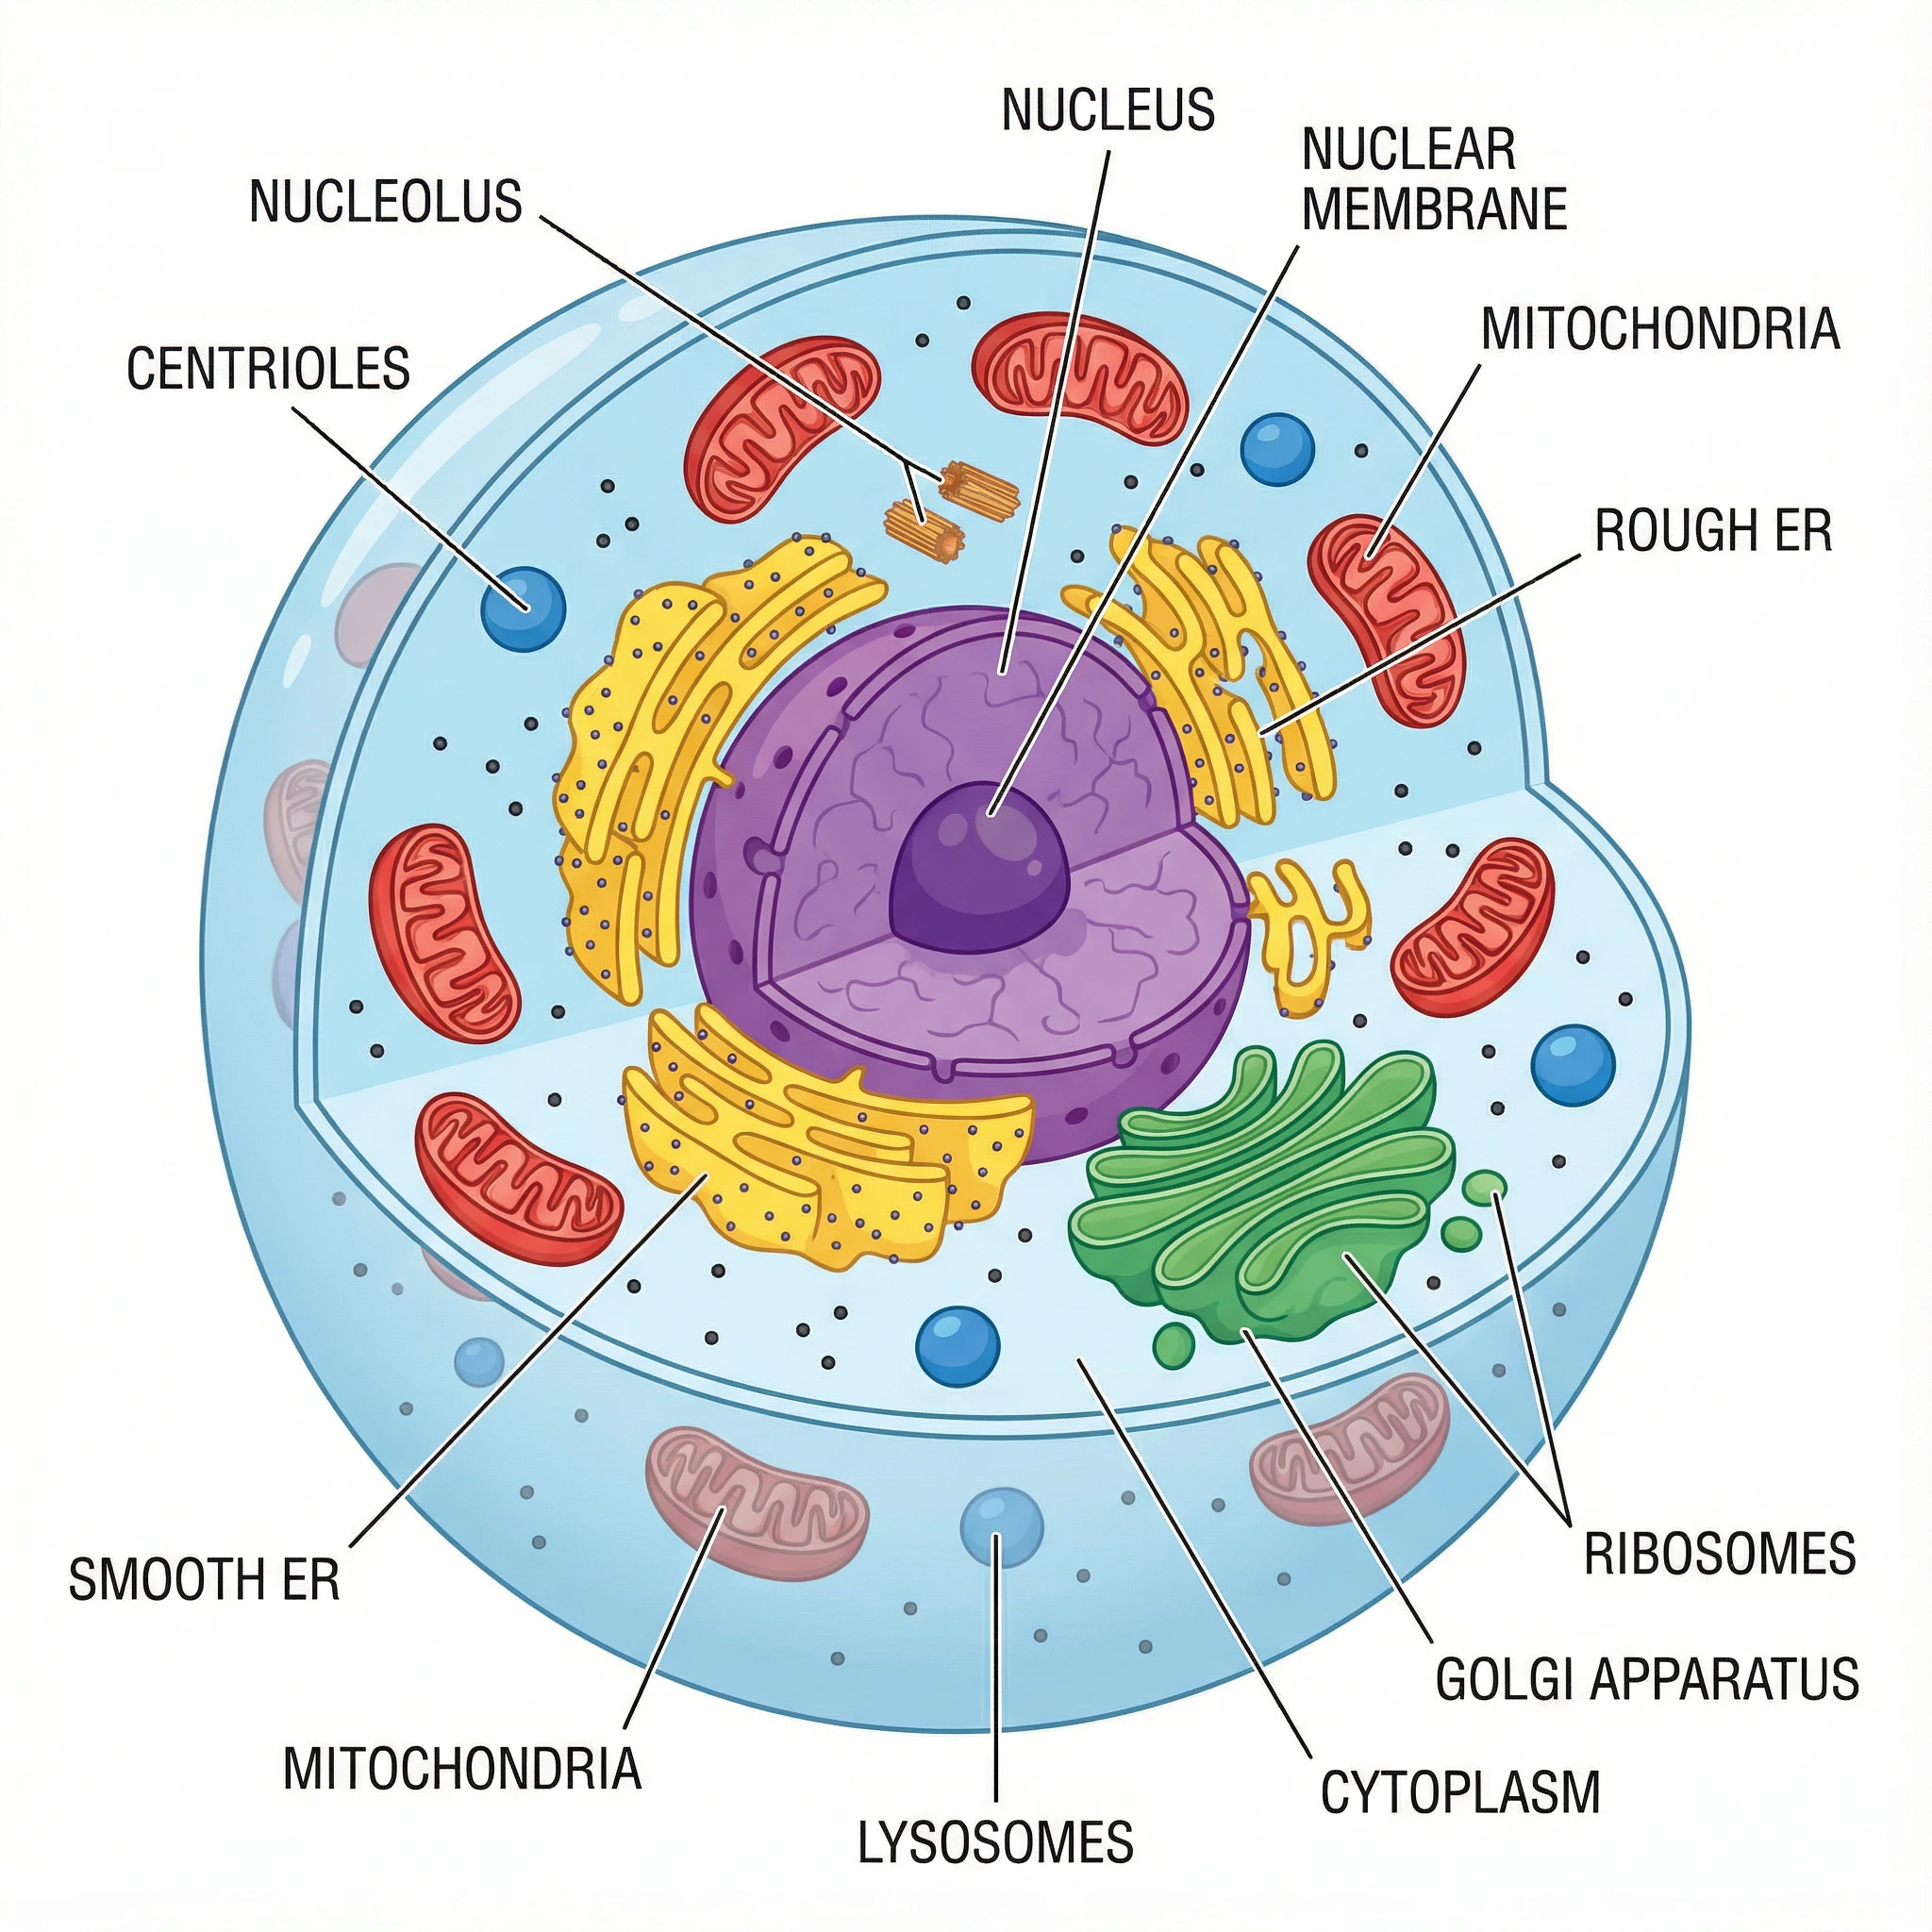
Animal Cell Diagram Generator
Create labeled animal cell diagrams with the nucleus, mitochondria, and other organelles.
 Biology
Mitosis Diagram Generator
Draw the phases of mitosis with labeled chromosomes, spindle fibers, and stages.
 Biology
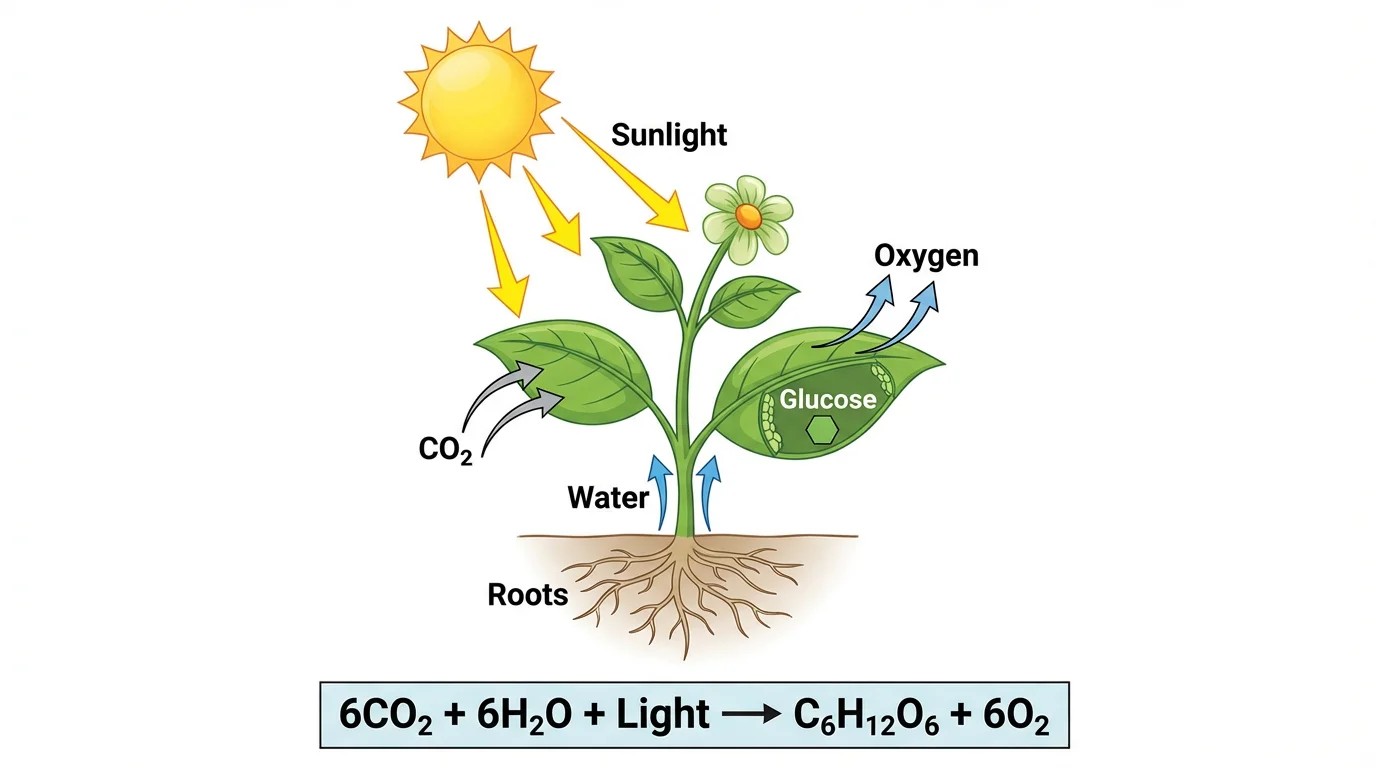
Photosynthesis Diagram Generator
Make labeled photosynthesis diagrams showing inputs, outputs, and the chloroplast.