Circular Flow Diagram Generator Circular Flow of Income
Make a circular flow of income diagram online — pick the 2-, 3-, or 4-sector model and get a correct, labeled diagram with money flows and real flows in the right directions. Edit the labels, download free SVG/PNG, or use AI for stylized illustrations.
Circular Flow Diagram Examples
2-, 3-, and 4-sector models with the flows drawn in the correct directions by the exact engine
Two-Sector Model
The classic 2-sector model — households and firms, linked by the product and factor markets, with money and real flows in opposite directions.
Three-Sector (Government)
Add the government: taxes leak out of the circular flow and government spending injects back in.
Four-Sector (Open Economy)
The open-economy model adds the rest of the world — imports leak out, exports inject in.
Product & Factor Markets
Rename the markets to match your textbook — here the Goods Market and Labour Market.
Custom Labels
Every box is editable — relabel households and firms as Consumers and Producers for your lesson.
Open Economy
Show trade with the foreign sector — the injections and leakages of an open economy.
What is a circular flow diagram?
The circular flow of income diagram is a model of how money and resources move around an economy. In its basic form it has two groups — households and firms — connected through two markets: the product market (where firms sell goods and services) and the factor market (where households sell the factors of production: land, labour, and capital). Money flows one way around the loop and real things (goods, services, and factors) flow the opposite way, so every payment matches a flow of goods or resources in return.
Money flows and real flows go in opposite directions
The single most important feature of the diagram is that there are two loops running in opposite directions. The money flow (the green outer loop) is consumer spending, firms’ revenue, factor payments like wages and rent, and household income. The real flow (the orange inner loop) is the goods and services going to households and the factors of production going to firms. Because they are antiparallel, total spending in the economy equals total income — the foundation of national-income accounting. This generator always draws both loops in the correct directions, which is exactly the part AI image tools tend to get wrong.
The 2-sector, 3-sector, and 4-sector models
- 2-sector: households and firms only — the simplest closed model with no saving, government, or trade.
- 3-sector: adds the government. Taxes are a leakage out of the flow and government spending is an injection back in.
- 4-sector: adds the foreign sector for an open economy. Imports are a leakage (money going abroad) and exports are an injection (money coming in).
- Pick the model that matches your syllabus and the generator adds the right sectors, injections, and leakages.
Leakages and injections
In any model beyond the basic two-sector loop, money can leak out of the circular flow or be injected into it. Leakages (withdrawals) are saving, taxes, and spending on imports — money that leaves the domestic income–spending loop. Injections are investment, government spending, and exports — money that enters it. When total injections equal total leakages the economy is in equilibrium; when they differ, national income rises or falls. The 3- and 4-sector diagrams show taxes, government spending, imports, and exports so you can teach this balance directly.
How to use the circular flow diagram generator
- Choose the model: 2-sector, 3-sector (with government), or 4-sector (open economy).
- Edit any label — rename households, firms, the markets, the government, or the foreign sector to match your course.
- Add a title for your worksheet, poster, or slide.
- Download a crisp SVG or high-resolution PNG. The diagram is drawn in your browser with the flows always in the correct directions, and uses no image credits.
When to use the AI illustration mode
The Circular flow mode guarantees the money and real flows point the right way and the right markets sit between households and firms — the things that must be correct. Switch to AI illustration when you want a stylized poster, a hand-drawn look, extra annotations, or a worked example with savings, investment, and a financial sector beyond the standard template. Use the precise mode for correctness and AI for illustration.
常见问题
Related Economics Tools
 Research
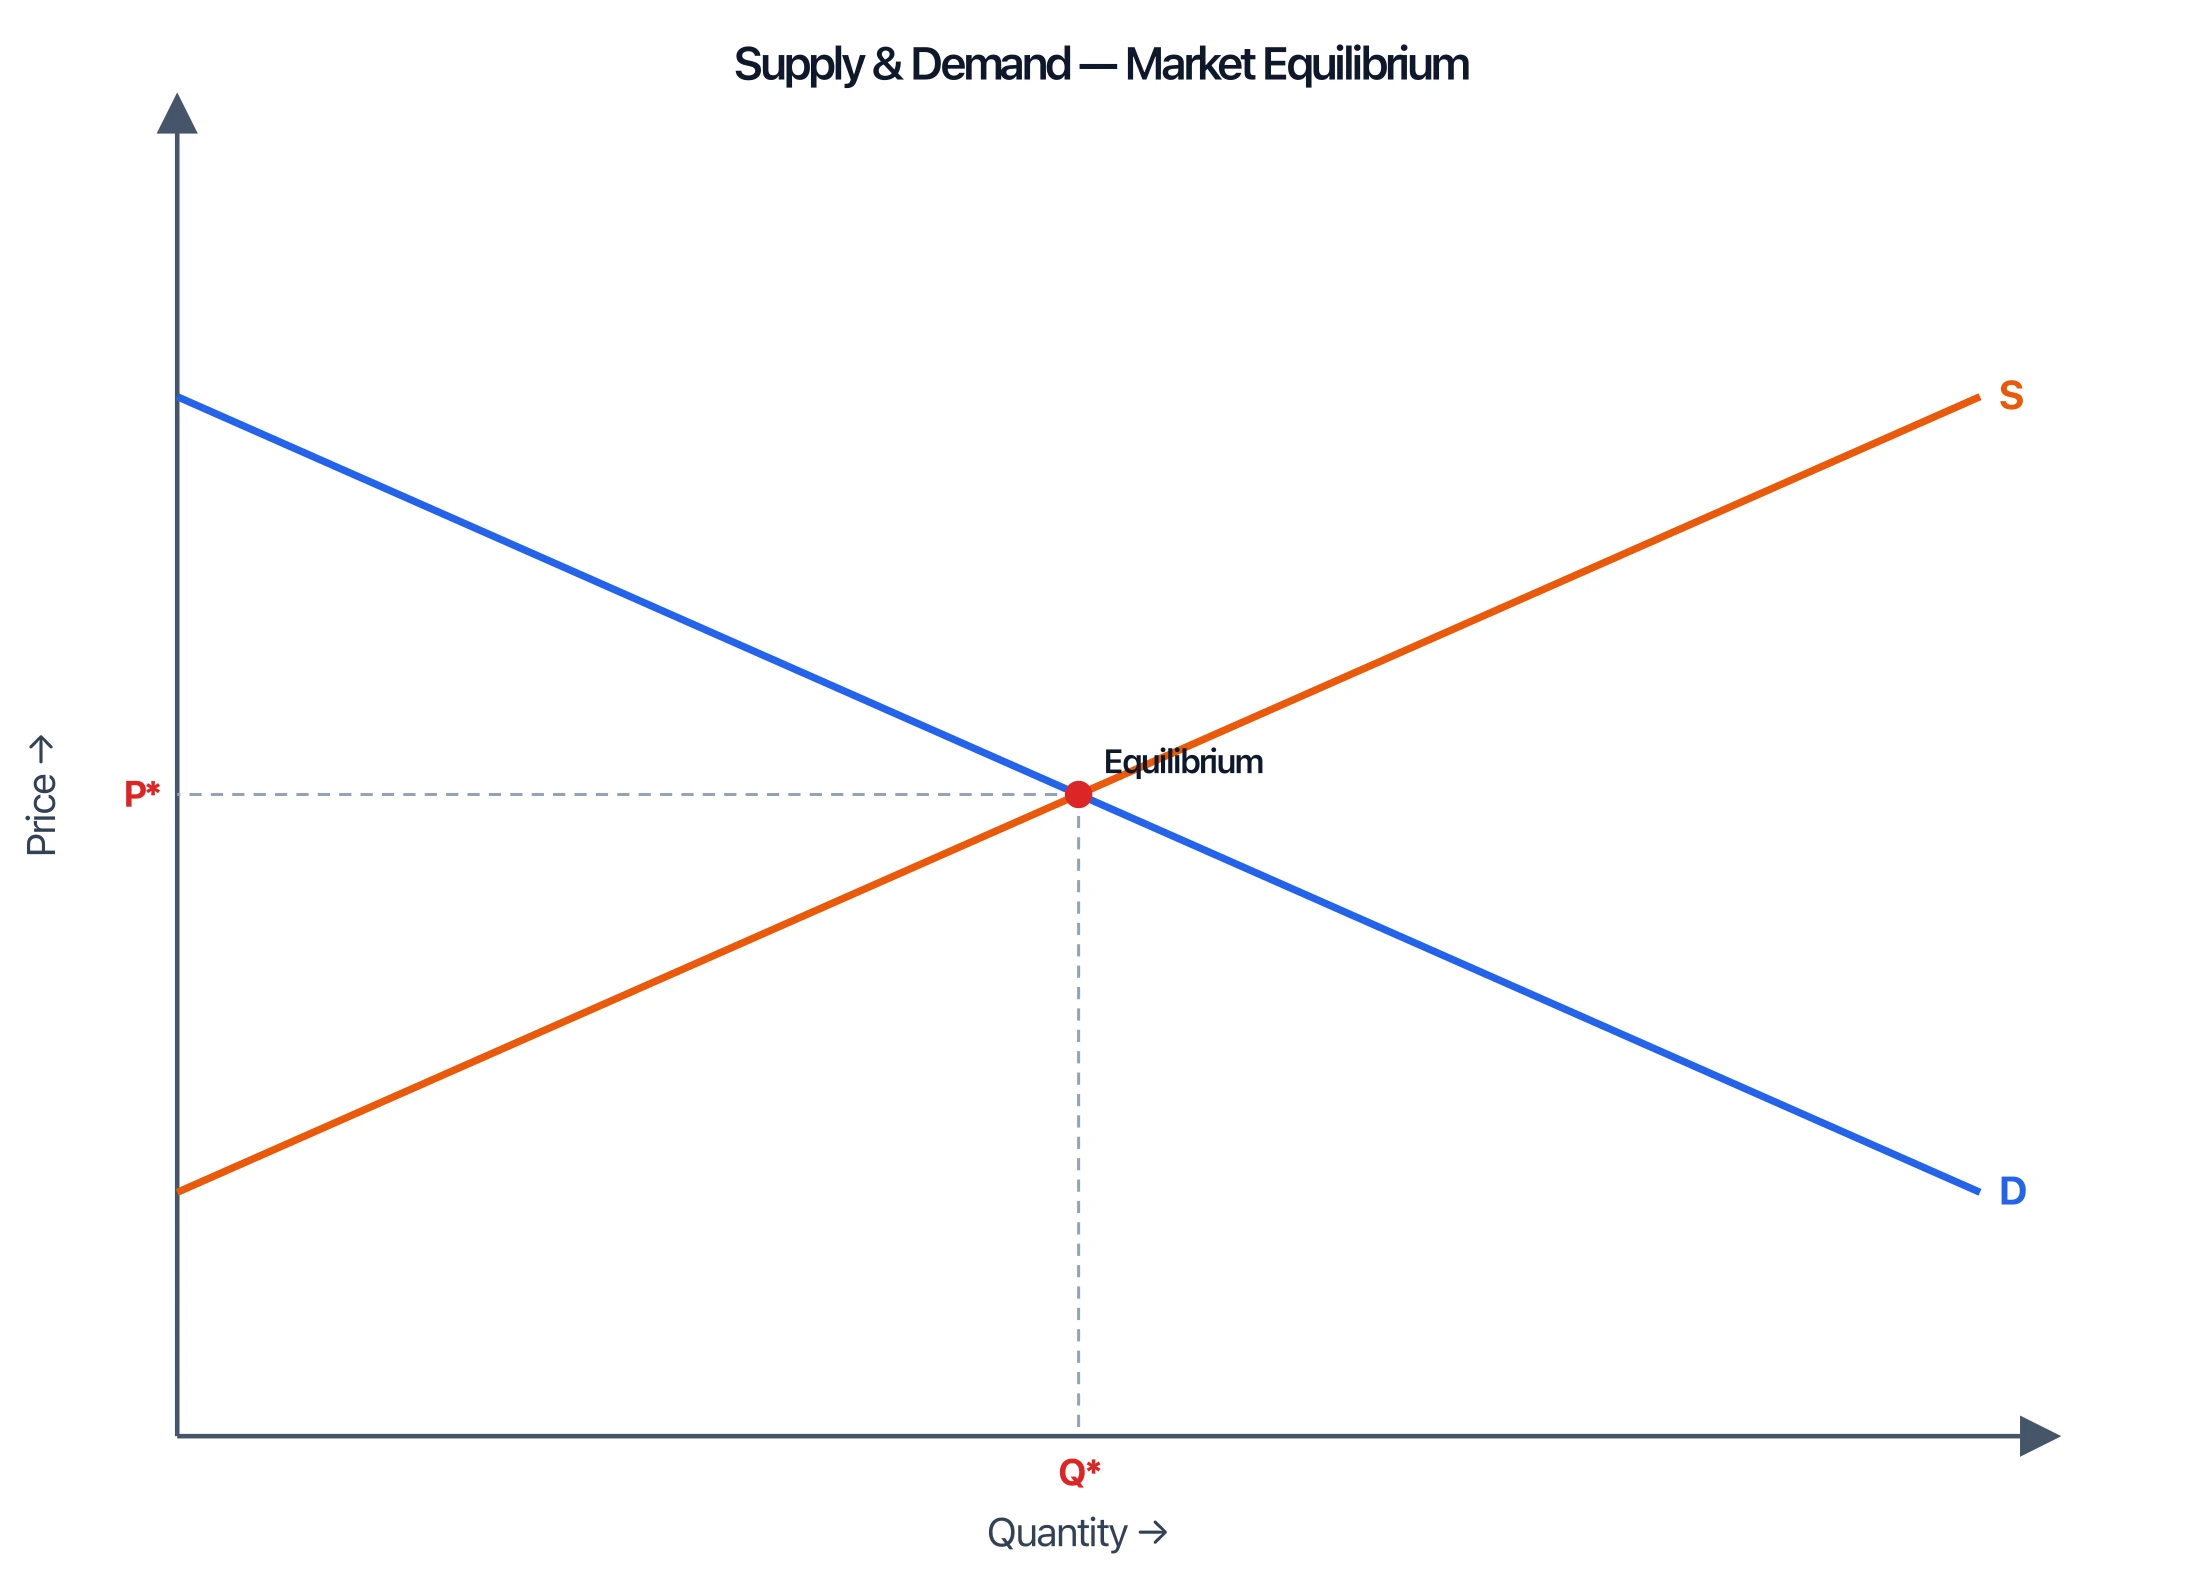
Supply and Demand Graph Maker
Plot supply and demand curves, equilibrium, shifts, and surplus for economics class.
 Research
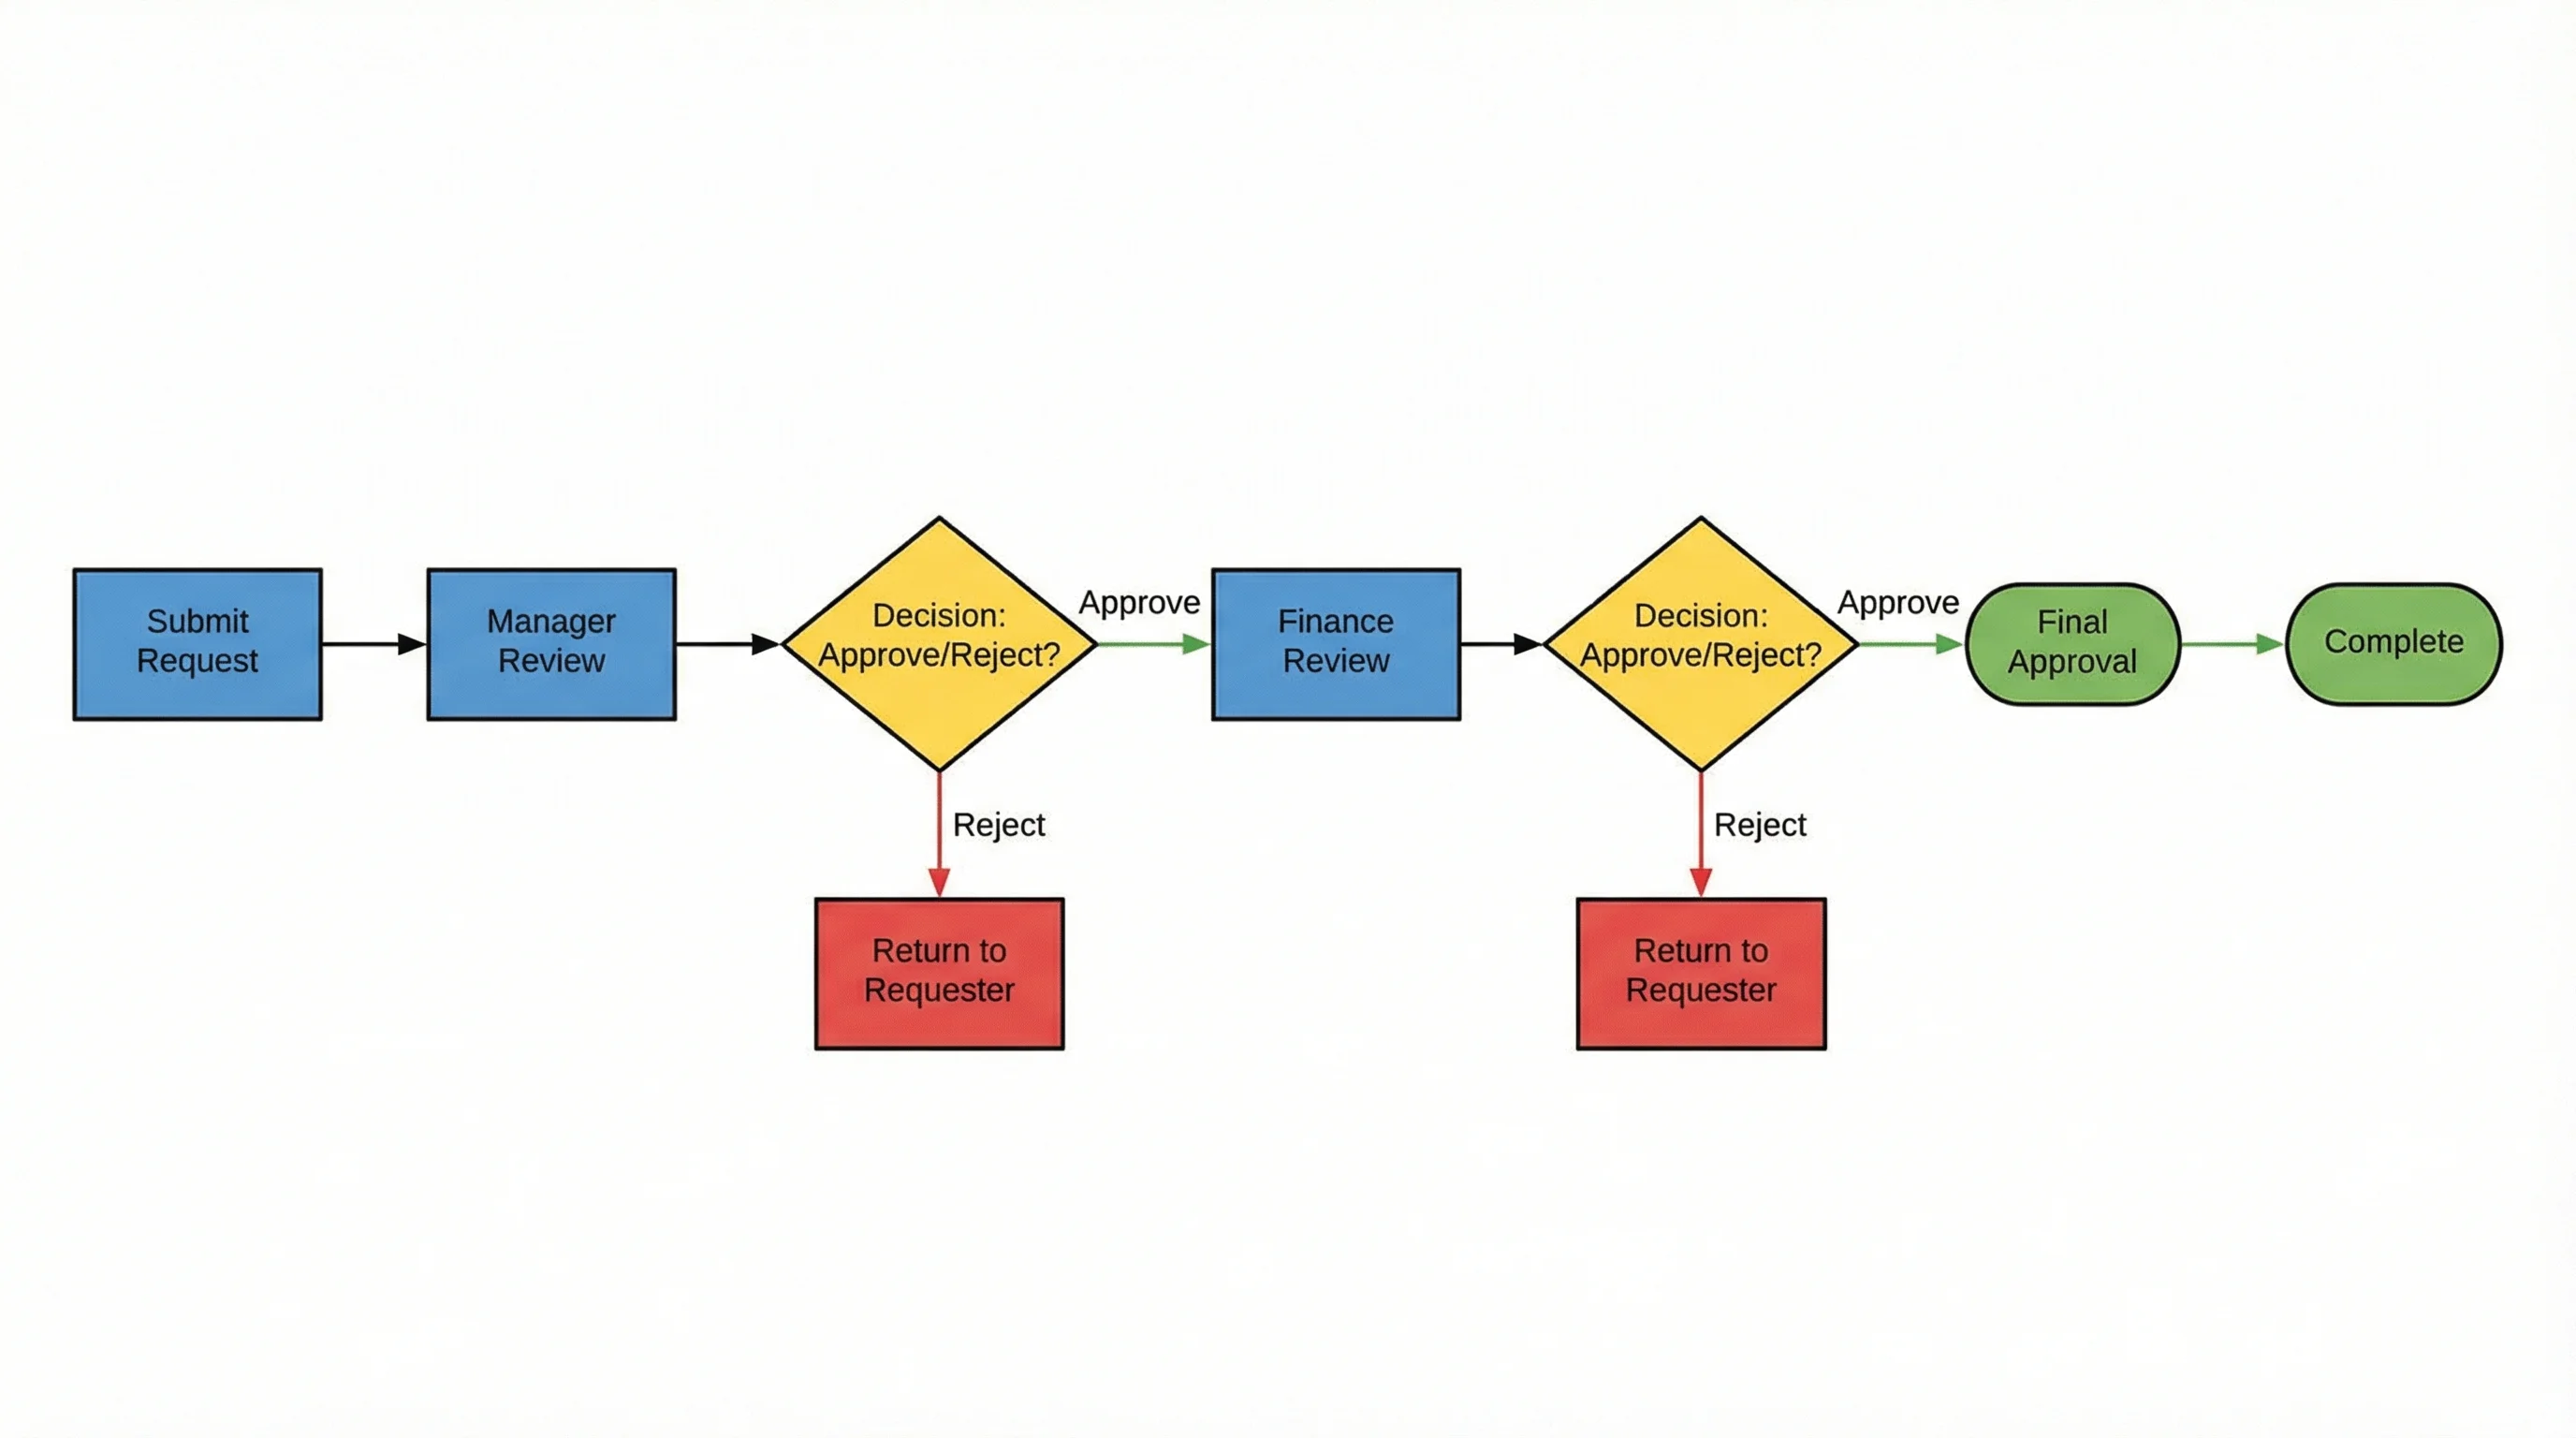
AI Flowchart Generator
Create flowcharts, process flows, and workflow diagrams from a text description.
 Education
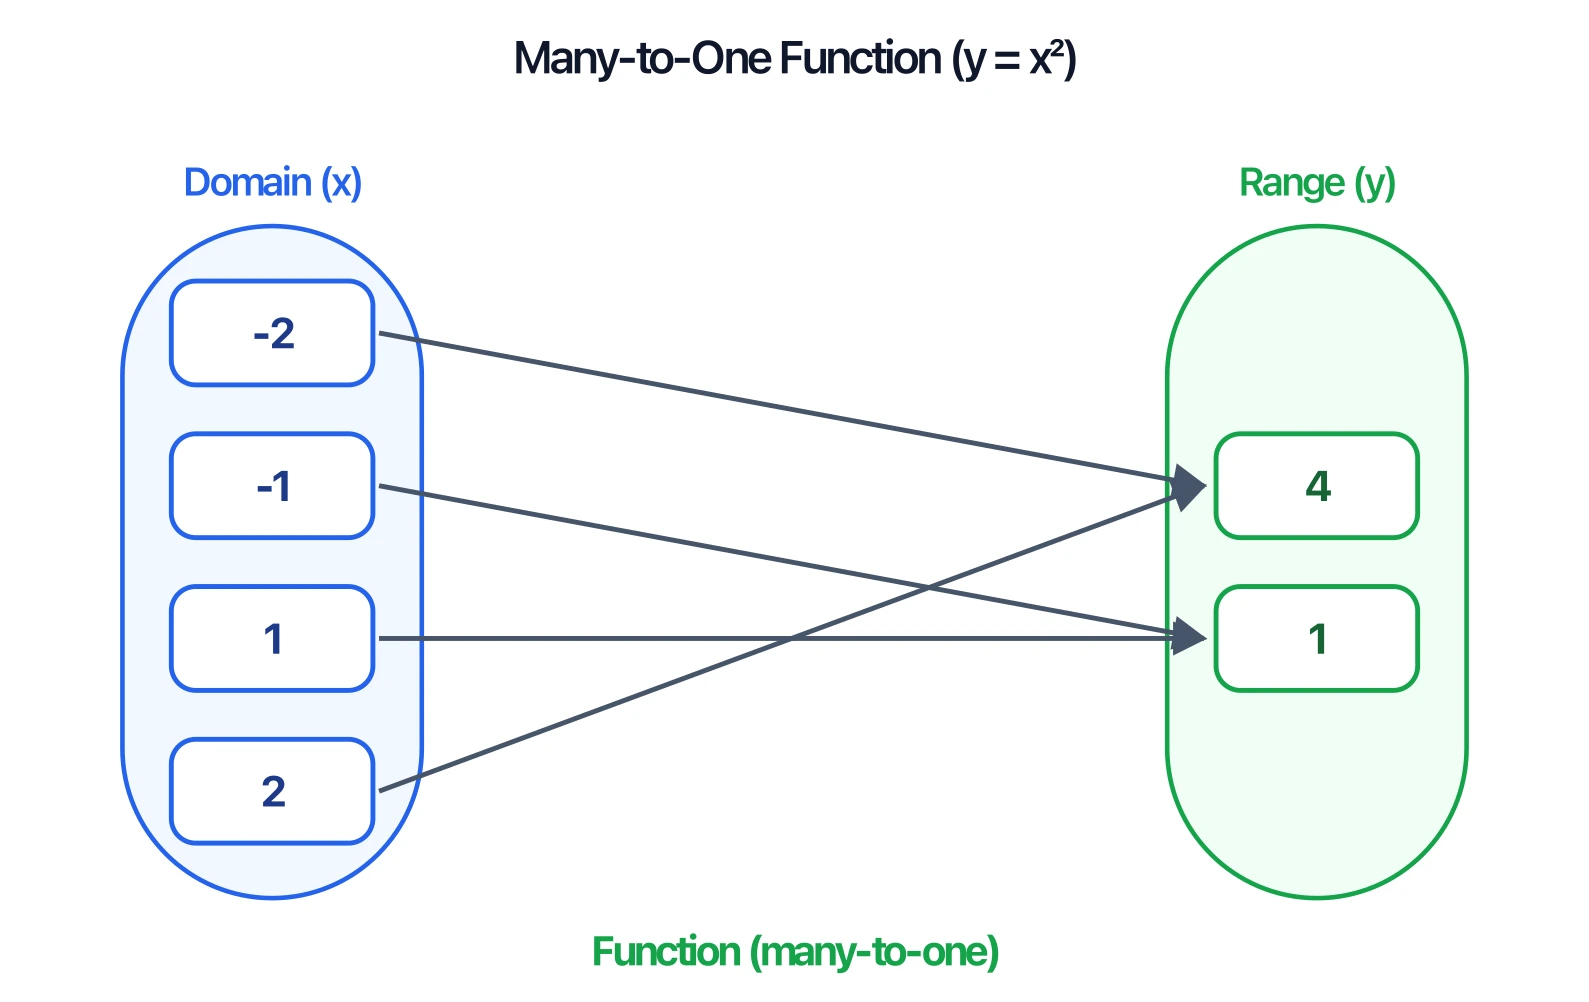
Mapping Diagram Generator
Draw domain-to-range mapping diagrams with an automatic function check.