
What Is a P&ID? Piping & Instrumentation Diagrams Explained
A P&ID shows every pipe, valve, and instrument in a process. Learn how to read piping and instrumentation diagrams, the standard ISA symbols, and how a P&ID differs from a PFD.
A P&ID — piping and instrumentation diagram — is the master schematic of a process plant. It shows every pipe, valve, vessel, pump, and instrument, and exactly how they connect, so engineers and operators can build, run, and troubleshoot the process from a single drawing.
This guide explains what a P&ID is, how to read its standard symbols, the instrument bubble notation, and how a P&ID differs from a process flow diagram (PFD).
Quick Answer: What Is a P&ID?
A piping and instrumentation diagram (P&ID) is a detailed schematic that shows the equipment, piping, valves, and instrumentation of a process and how they are interconnected. It is the working document used for design, construction, operation, and maintenance — far more detailed than a high-level process flow diagram.
P&ID symbols are standardized, most commonly by the ISA S5.1 standard, so the same drawing can be read by engineers anywhere.
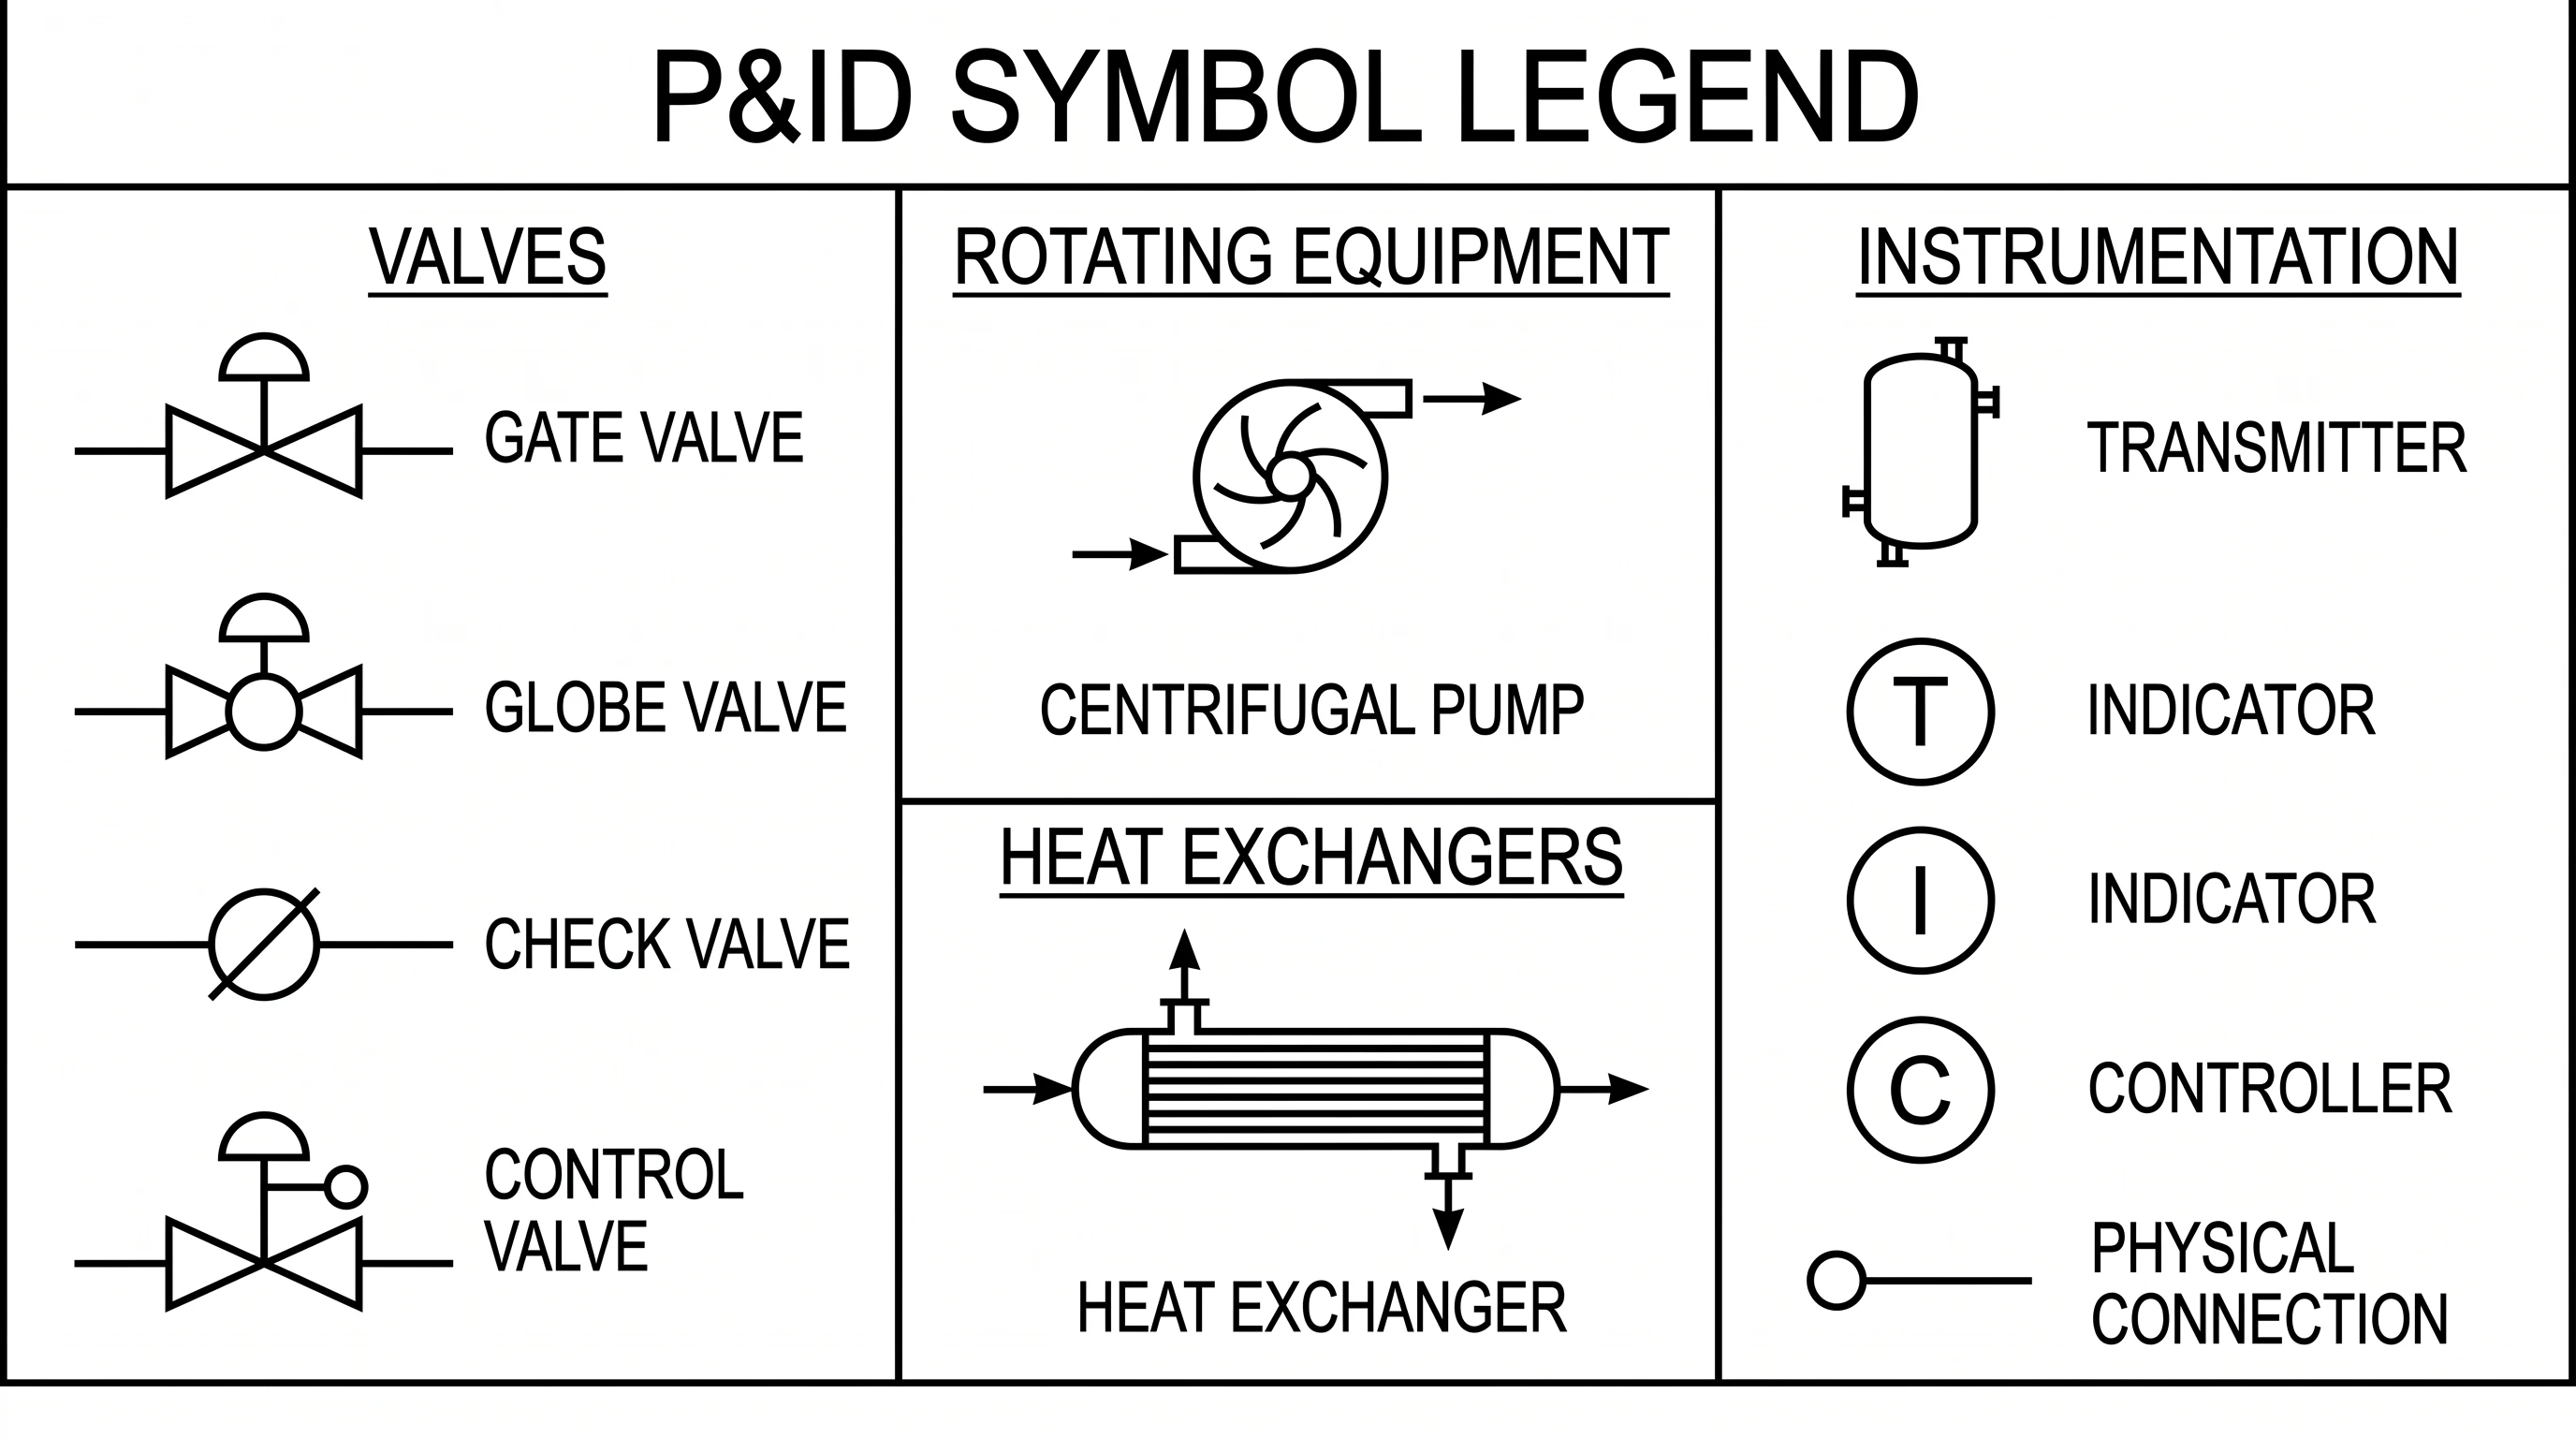
P&ID Symbol Categories
P&ID symbols fall into a few main groups:
- Piping — process lines, signal lines, connectors, reducers, and fittings.
- Valves — gate, globe, check, ball, and control valves, each with a distinct symbol.
- Equipment / vessels — tanks, columns, drums, and reactors.
- Rotating equipment — pumps, compressors, and turbines.
- Heat exchangers — shell-and-tube, condensers, and boilers.
- Instrumentation — measurement and control devices, drawn as circles ("bubbles").
P&ID Maker
Create piping and instrumentation diagrams with standard ISA symbols for valves, pumps, vessels, and instruments, then download them free as SVG or PNG.
Make a P&ID ->Reading Instrument Bubbles
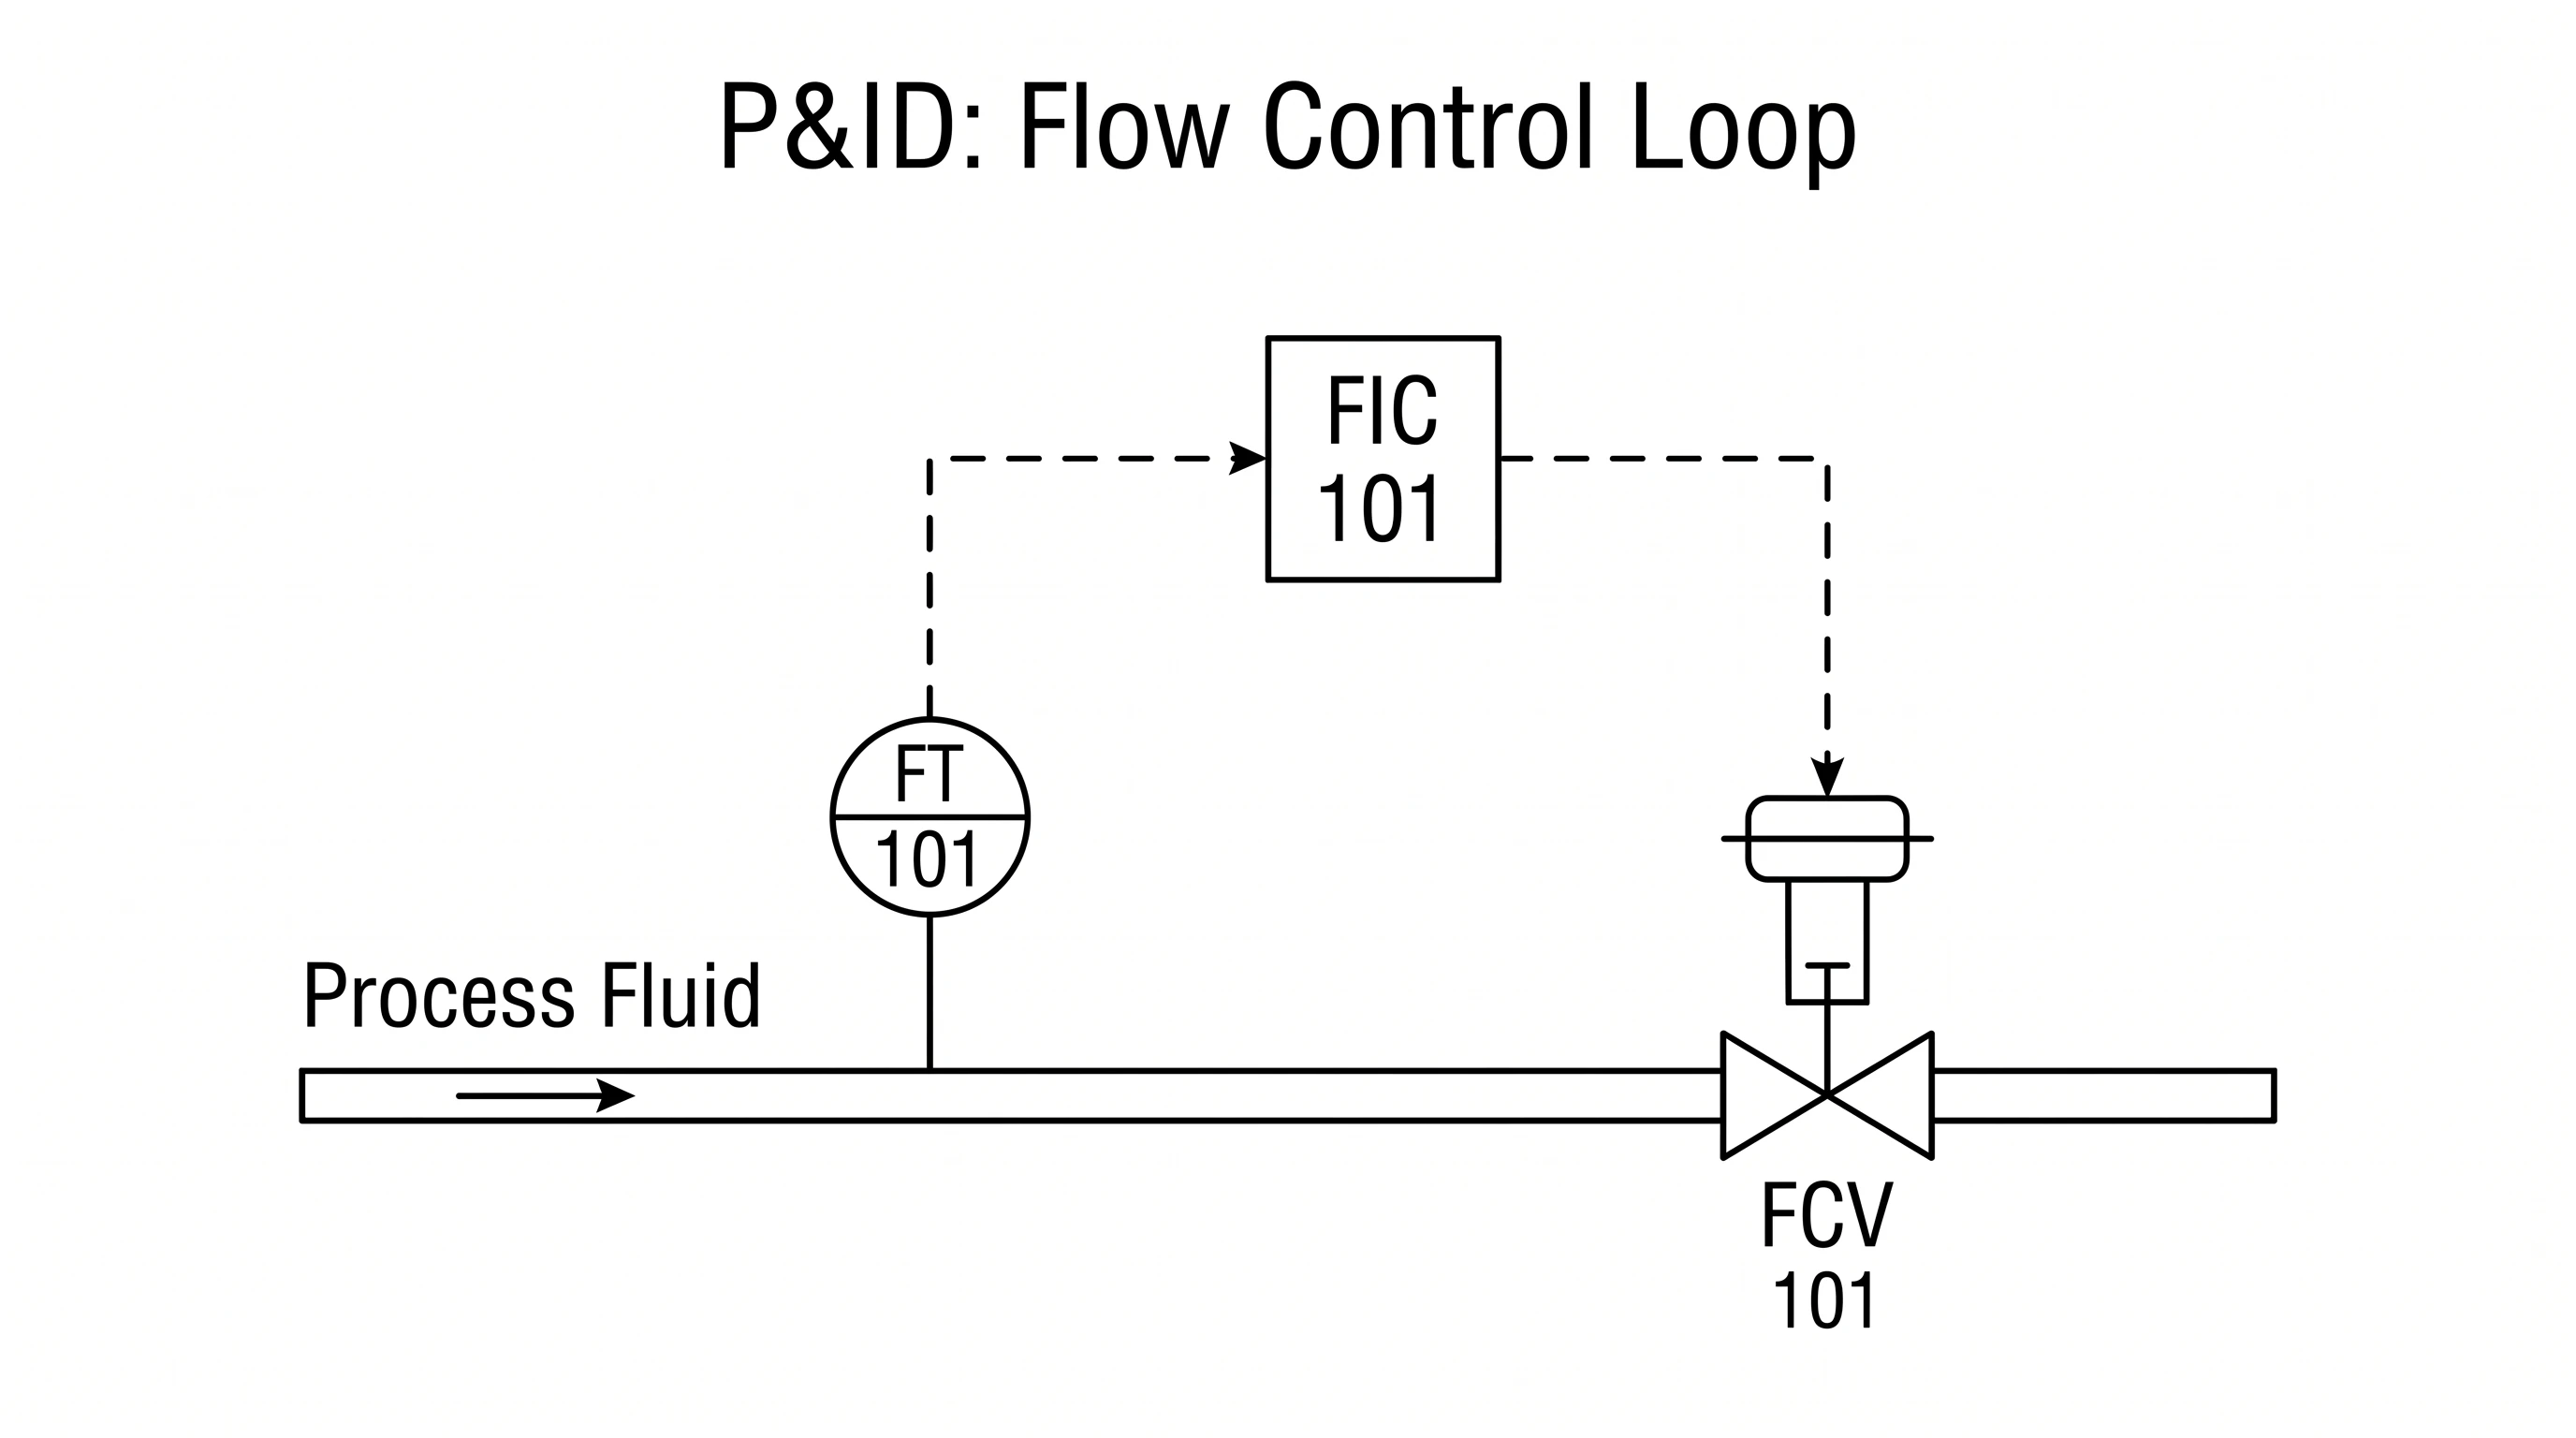
Instruments are drawn as circles, and two things tell you what each one does:
- The letters inside follow the ISA tag system. The first letter is the measured variable (F = flow, T = temperature, P = pressure, L = level), and the following letters are the function (I = indicator, T = transmitter, C = controller, R = recorder). So FIC is a flow indicating controller and PT is a pressure transmitter.
- The line through the bubble tells you where it lives: no line = a field instrument near the process; a solid line = mounted in the control room; a dashed line = a shared/DCS function. Dashed lines connecting instruments are signal lines, not pipes.
How to Read a P&ID
- Follow the process lines (the heavy lines) to trace the flow of material through the plant.
- Identify the equipment by its symbol and tag number (for example T-101 for a tank, P-101 for a pump).
- Note the valves along each line and what type they are.
- Read the instrument bubbles to see what is measured and controlled, and how the control loops work.
- Distinguish signal lines (dashed) from process pipes (solid).
P&ID vs PFD
A process flow diagram (PFD) is the big-picture overview: it shows the major equipment and the main flow of material, often with operating conditions, but leaves out most valves and instruments. A P&ID zooms in and adds every valve, line, and instrument needed to actually build and control the plant. In short: the PFD shows what the process does; the P&ID shows how it is built and controlled.
Common Mistakes
- Confusing process lines and signal lines. Solid heavy lines are pipes; dashed (or specially marked) lines are instrument signals.
- Misreading instrument tags. The first letter is the variable, the rest are the function — FIC ≠ FI.
- Ignoring the bubble line convention. No line, solid line, and dashed line mean different instrument locations.
- Treating a P&ID like a PFD. A P&ID is detailed and to-symbol, not a simplified overview.
FAQ
What is a P&ID?
A P&ID (piping and instrumentation diagram) is a detailed schematic showing all the equipment, piping, valves, and instrumentation in a process and how they are connected. It is used for design, construction, operation, and maintenance.
What do the symbols on a P&ID mean?
They are standardized graphics (commonly ISA S5.1) for piping, valves, vessels, pumps, heat exchangers, and instruments. Each symbol represents a specific component so the diagram can be read consistently.
What do the letters in an instrument bubble mean?
They follow the ISA tag system: the first letter is the measured variable (F, T, P, L) and the following letters are the function (I = indicator, T = transmitter, C = controller). For example, FIC is a flow indicating controller.
What is the difference between a P&ID and a PFD?
A PFD (process flow diagram) is a simplified overview of the major equipment and flow. A P&ID is far more detailed, showing every valve, line, and instrument needed to build and control the process.
What standard is used for P&ID symbols?
The most widely used is ISA S5.1 (Instrumentation Symbols and Identification) from the International Society of Automation, which defines instrument symbols and tag identification.
Further Reading
分类
更多文章
")
8 Best Free Visme Alternatives in 2026 (No Watermark)
Best free Visme alternatives: Canva, ConceptViz, Piktochart, Google Slides, Design.com & more. Create infographics and presentations without watermarks or subscriptions.

Column Chart Maker Guide: When to Use Column Charts and How to Make One
Learn when to use a column chart, how it differs from a bar chart, and how to make clean grouped, stacked, and spreadsheet-ready column charts.
")
How to Illustrate Science: Methods, Tools & Examples (2026)
Learn 8 proven ways to illustrate science for research papers, posters, and presentations. Covers diagrams, infographics, graphical abstracts, and more.