Wave Diagram Generator for Transverse & Longitudinal Waves
Create a labeled wave diagram in seconds. Show crest, trough, wavelength, amplitude, rest position, frequency, and period for transverse waves — or compression and rarefaction for longitudinal waves — then download your diagram, free.
Wave Diagram Generator
Free to try ·
Your wave diagram will appear here
Describe what you need and click Generate
Wave Diagram Examples
Labeled transverse and longitudinal wave diagrams for physics
Labeled Transverse Wave
All key parts in one diagram — crest, trough, wavelength, amplitude, and equilibrium line clearly labeled.
Transverse vs Longitudinal Wave
Transverse oscillation is perpendicular to wave travel; longitudinal oscillation is parallel — shown side by side.
Parts of a Wave
Every part of a wave labeled on one diagram — ideal for notes, posters, and revision.
Wavelength and Amplitude
Wavelength is one full cycle; amplitude is the displacement from rest — both measured and labeled.
Longitudinal Wave: Compression & Rarefaction
Compression (dense) and rarefaction (spread) regions labeled on a longitudinal wave with wavelength marked.
Blank Wave Worksheet
Leader lines, no labels — print and hand out for students to identify crest, trough, amplitude, and wavelength.
What is a wave diagram?
A wave diagram is a labeled drawing that shows the shape and key measurements of a wave. For a transverse wave it is a sinusoidal curve with annotations pointing to the crest, trough, wavelength, amplitude, and rest (equilibrium) position. For a longitudinal wave it is a coiled spring or series of dots showing alternating compressions and rarefactions, with the wavelength spanning one complete compression-rarefaction pair. Wave diagrams appear in every introductory physics course because they connect the visual pattern of a wave to the quantities — wavelength, amplitude, frequency, and period — that appear in equations.
Parts of a wave: crest, trough, wavelength, amplitude, and rest position
- Crest: the highest point of a transverse wave — the peak of the sinusoidal curve.
- Trough: the lowest point of a transverse wave — the valley of the sinusoidal curve.
- Wavelength (λ): the distance from one crest to the next (or trough to trough, or any two identical points one full cycle apart). Measured in metres.
- Amplitude (A): the maximum displacement of the medium from the rest position — the vertical distance from the equilibrium line to the crest. Larger amplitude means more energy.
- Rest position (equilibrium line): the undisturbed position of the medium, drawn as a horizontal dashed line through the middle of the wave.
- Frequency (f): the number of complete waves that pass a point per second. Measured in hertz (Hz). Related to period by f = 1/T.
- Period (T): the time for one complete wave cycle. Measured in seconds. Related to frequency by T = 1/f.
Transverse waves vs longitudinal waves
In a transverse wave the particles of the medium oscillate perpendicular to the direction the wave travels — like a rope shaken up and down while the wave moves along the rope. Light and water surface waves are transverse. In a longitudinal wave the particles oscillate parallel to the wave's direction of travel — like the coils of a spring being pushed and pulled along its length. Sound is a longitudinal wave. Both types share the same wave-speed formula v = fλ, but their diagrams look very different: a transverse wave is drawn as a sinusoidal curve, while a longitudinal wave is shown as alternating compressions and rarefactions.
Compression and rarefaction in longitudinal waves
- Compression: a region where the particles of the medium are pushed together — the coils of a spring are densely packed. This is the equivalent of a crest in a transverse wave.
- Rarefaction: a region where the particles are spread apart — the coils are widely spaced. This is the equivalent of a trough in a transverse wave.
- One full wavelength of a longitudinal wave spans exactly one compression and one rarefaction.
- Sound waves in air are longitudinal: the speaker cone pushes air molecules together (compression) then pulls them apart (rarefaction), and the wave carries that pressure pattern outward.
The wave equation: v = fλ
The wave equation v = fλ links wave speed (v, in m/s), frequency (f, in Hz), and wavelength (λ, in m). Since period T = 1/f, you can also write it as v = λ/T. If you know any two of the three quantities you can find the third. For example, sound travels at about 340 m/s in air; if the frequency is 340 Hz the wavelength is 1 m. A wave diagram makes these relationships visual: wavelength is the length of one cycle, and frequency tells you how many of those cycles pass a fixed point every second.
Labeled vs blank wave diagrams for worksheets
Teachers often need two versions of the same diagram: a fully labeled one for notes and slides, and an unlabeled version with empty leader lines for students to fill in as a quiz or homework. With this generator you can describe a labeled wave for your lesson and then ask for a printer-friendly, black-and-white blank version of the same layout — no redrawing required. You can also adjust complexity, for instance asking for a simple single-wave diagram for middle school or a multi-wave comparison poster for A-level physics.
Frequently Asked Questions
Related Physics Tools
 Physics
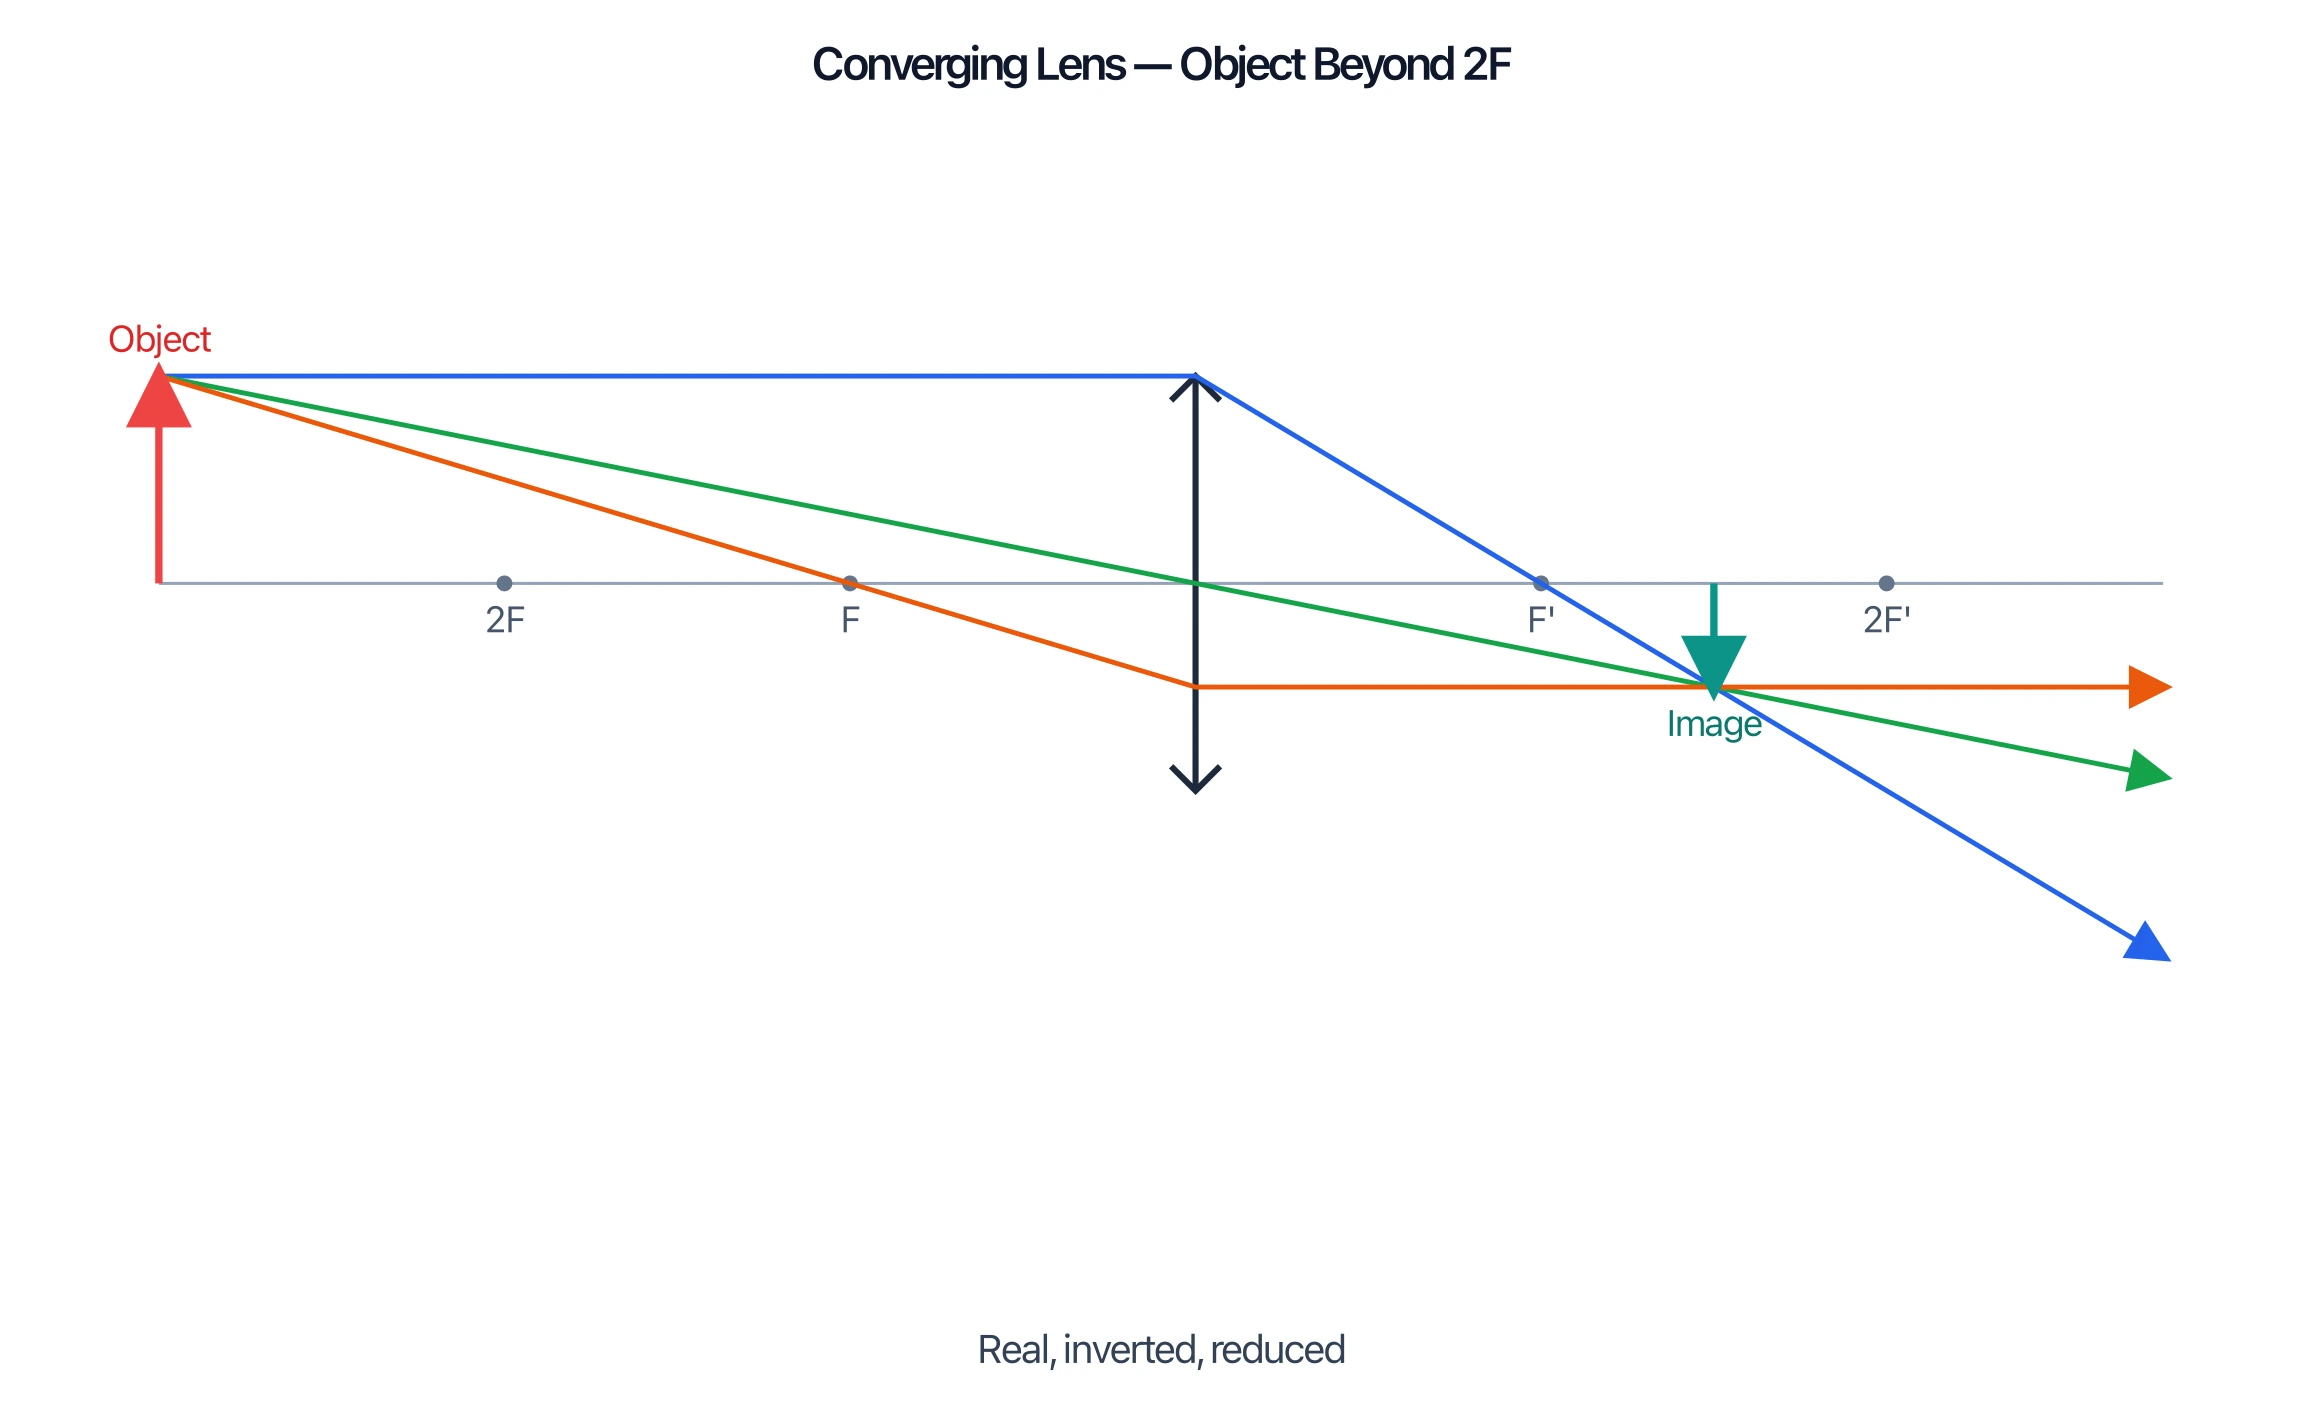
Ray Diagram Generator
Draw accurate ray diagrams for converging and diverging lenses and concave and convex mirrors with labeled focal points and image formation.
 Physics
Motion Diagram Physics Maker
Build motion diagrams with position dots, velocity arrows, and acceleration arrows at equal time intervals.
 Physics
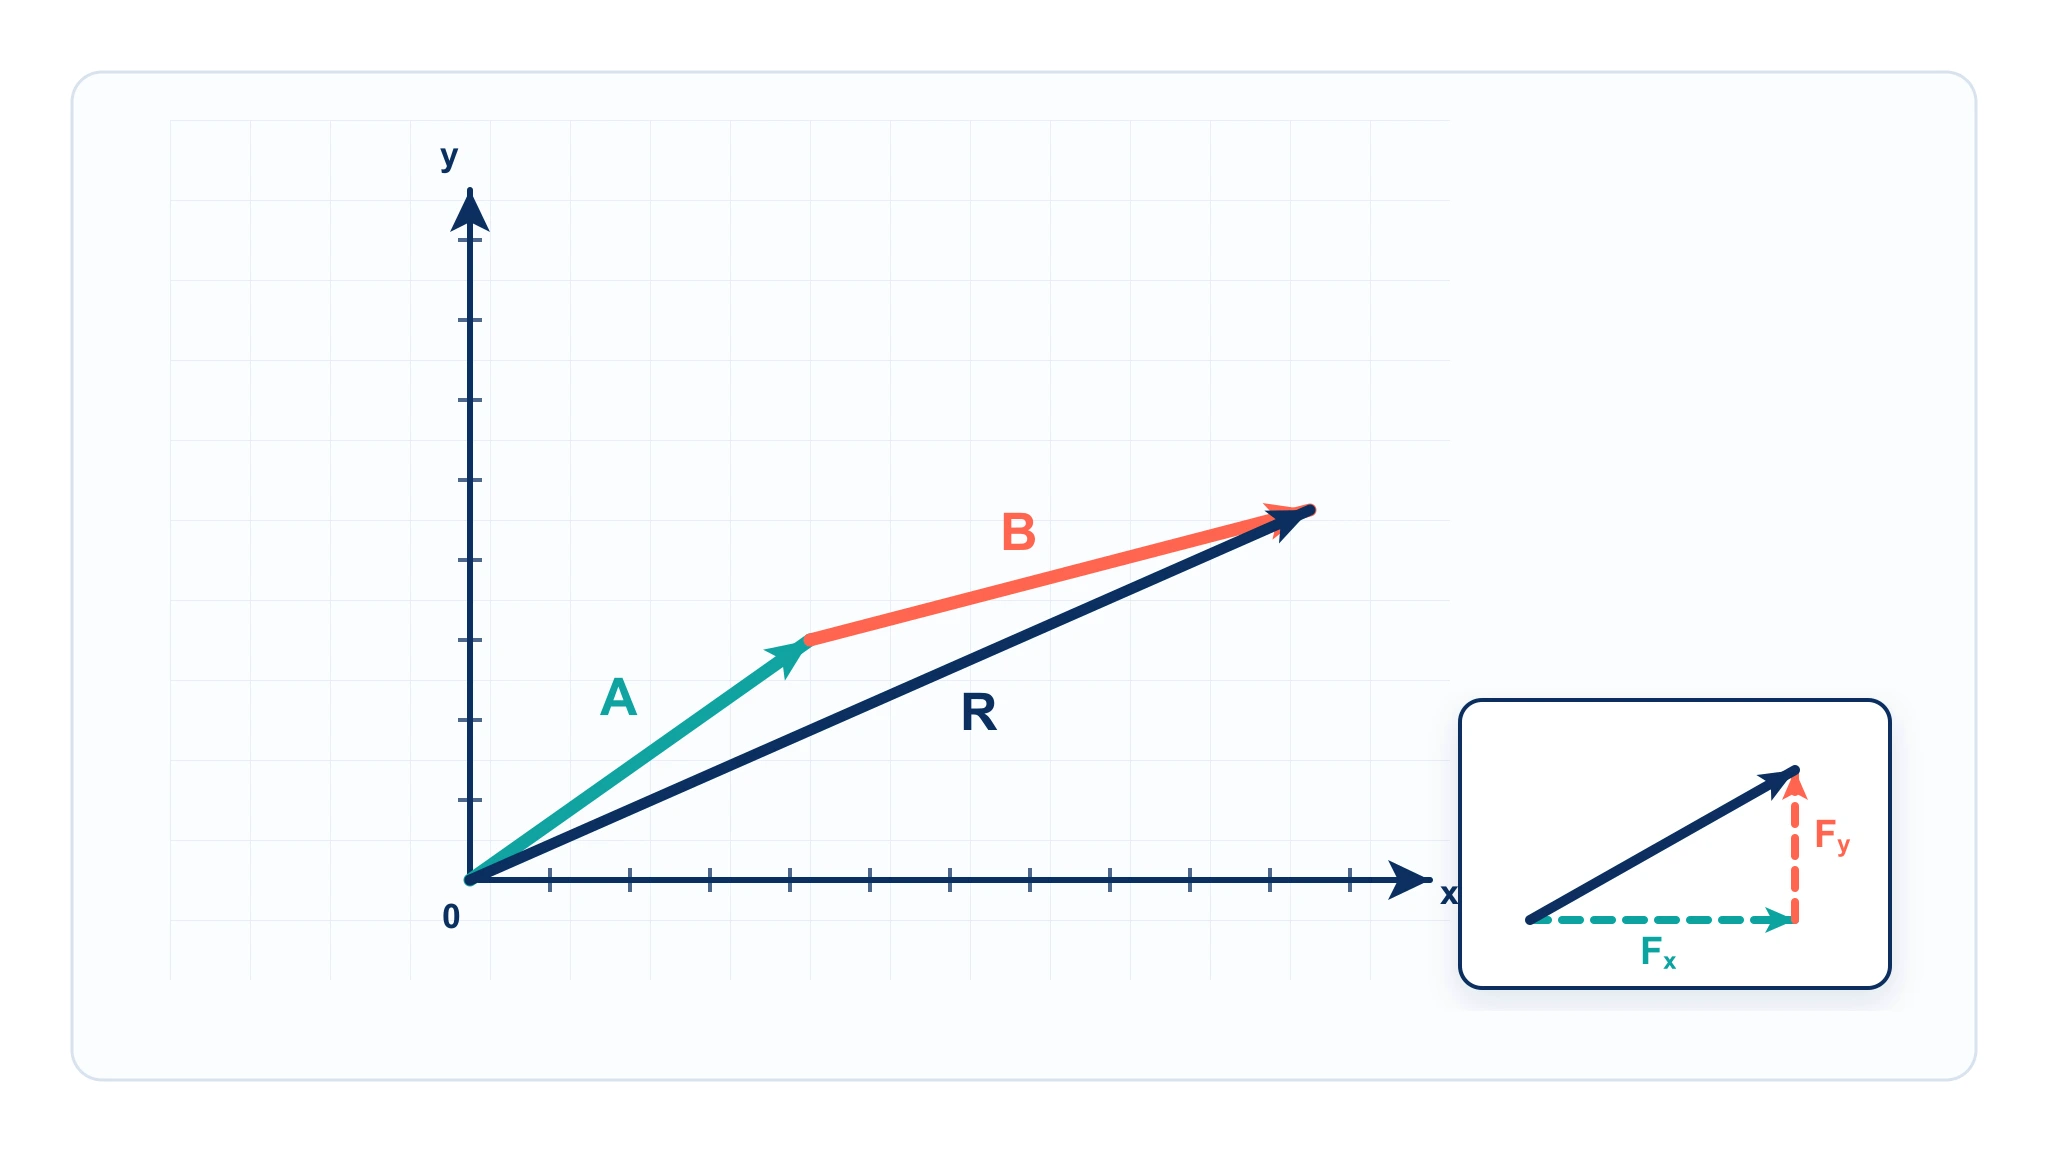
Vector Diagram Physics Maker
Draw vector arrows, components, and resultants with precise angles and scale for physics problems.