Stem-and-Leaf Plot Generator Make a Stemplot from Data
Make a stem-and-leaf plot (stemplot) from your own data in seconds. Paste any list of numbers and get a clean, labeled two-column plot with a stem, a leaf, and a key — plus back-to-back plots for comparing two datasets. Choose the leaf place value, sort the leaves, and export SVG or PNG. Deterministic precise mode plus an AI sketch mode.
Stem-and-Leaf Plot Examples
Common stemplot layouts: labeled plots, keys, back-to-back comparisons, and worksheets
Labeled Stem-and-Leaf Plot
The standard two-column stemplot: stems on the left, sorted leaves on the right, key below.
How to Read a Stemplot
A worked row showing how the stem and leaf combine into a single data value.
Stemplot with a Key
Every stemplot needs a key — it tells the reader how to rebuild the original numbers.
Back-to-Back Stemplot
Two datasets share one stem column so you can compare their shapes side by side.
Stemplot from Data
From a raw list of numbers to a finished stemplot, stems from smallest to largest.
Blank Stemplot Worksheet
A printable template with stems in place for students to fill in the leaves and key.
What is a stem-and-leaf plot?
A stem-and-leaf plot — also called a stemplot — is a way of showing a set of numbers that keeps every original value while also revealing the overall shape of the data. Each number is split into two parts: a stem, made of the leading digit or digits, and a leaf, which is the final digit. Numbers that share the same stem are grouped on one row, and their leaves are listed out beside the stem. The result looks like a sideways bar chart made of digits: rows with more leaves are the taller bars, so you can instantly see where the data clusters, spot gaps and outliers, and read off the minimum, maximum, and median — all without losing a single data point. That combination of a real data table and a visual summary is why stem-and-leaf plots are a staple of introductory statistics.
How to read the stem, the leaf, and the key
- Reading a stemplot comes down to gluing the stem back onto each leaf. For two-digit data the stem is the tens digit and the leaf is the ones digit, so a stem of 3 with a leaf of 2 means the value 32.
- Because the same stem can represent tens, hundreds, or ones depending on the data, every stem-and-leaf plot includes a key (also called a legend). A key such as "3 | 2 = 32" tells you exactly how to combine a stem and a leaf into a value. Always read the key first.
- Within a row, each leaf is a separate data point. A row that reads "2 | 1 5 5" contains three values — 21, 25, and 25 — so repeated leaves show up as repeated digits, which is how the plot captures frequency.
Making a stem-and-leaf plot from data
- To build a stemplot by hand, first decide which digit is the leaf. For values like 12, 25, and 38, the ones digit is the leaf and the tens digit is the stem. Then list every stem from the smallest to the largest in a column — including any stems that have no leaves, because those empty rows are what give the plot its correct shape.
- Next, go through the data and write each value's leaf next to its stem. Finally, sort the leaves in each row into ascending order and add a key. This tool does all of that for you: paste or type your numbers separated by commas, spaces, or new lines, choose whether the leaf is the ones, tens, or hundreds digit, and the plot updates instantly.
- For example, the data 7, 12, 13, 21, 25, 25, 38, 41 produces stems 0 through 4: 0 | 7, then 1 | 2 3, then 2 | 1 5 5, then 3 | 8, then 4 | 1, with the key 1 | 2 = 12.
Back-to-back stem-and-leaf plots
- A back-to-back stemplot compares two datasets that share the same stems. The stem column runs down the middle, one group's leaves extend to the right in the usual way, and the other group's leaves extend to the left.
- The left-hand leaves are read outward from the stem, so the smallest leaf sits closest to the divider. This mirror layout makes it easy to compare the two distributions at a glance — which group is higher, which is more spread out, and where each one clusters.
- To make one here, tick the back-to-back option and paste a second dataset into the Group B box. Both groups are plotted against one shared set of stems so the comparison stays fair.
Tips for a clean, readable stemplot
- Sort the leaves. A sorted plot is far easier to read and lets you find the median and quartiles by counting inward from the ends.
- Pick the right leaf place value. If your numbers are in the hundreds, using the ones digit as the leaf creates too many stems; switch the leaf to the tens digit so the plot groups the data into a readable number of rows.
- Keep the key visible and export at high resolution. Export SVG for crisp printing at any size, or PNG (rendered at 2x) for slides and handouts. Precise mode runs entirely in your browser and uses no image-generation credits, so you can print a whole class set for free.
Frequently Asked Questions
Related Math Tools
 Education
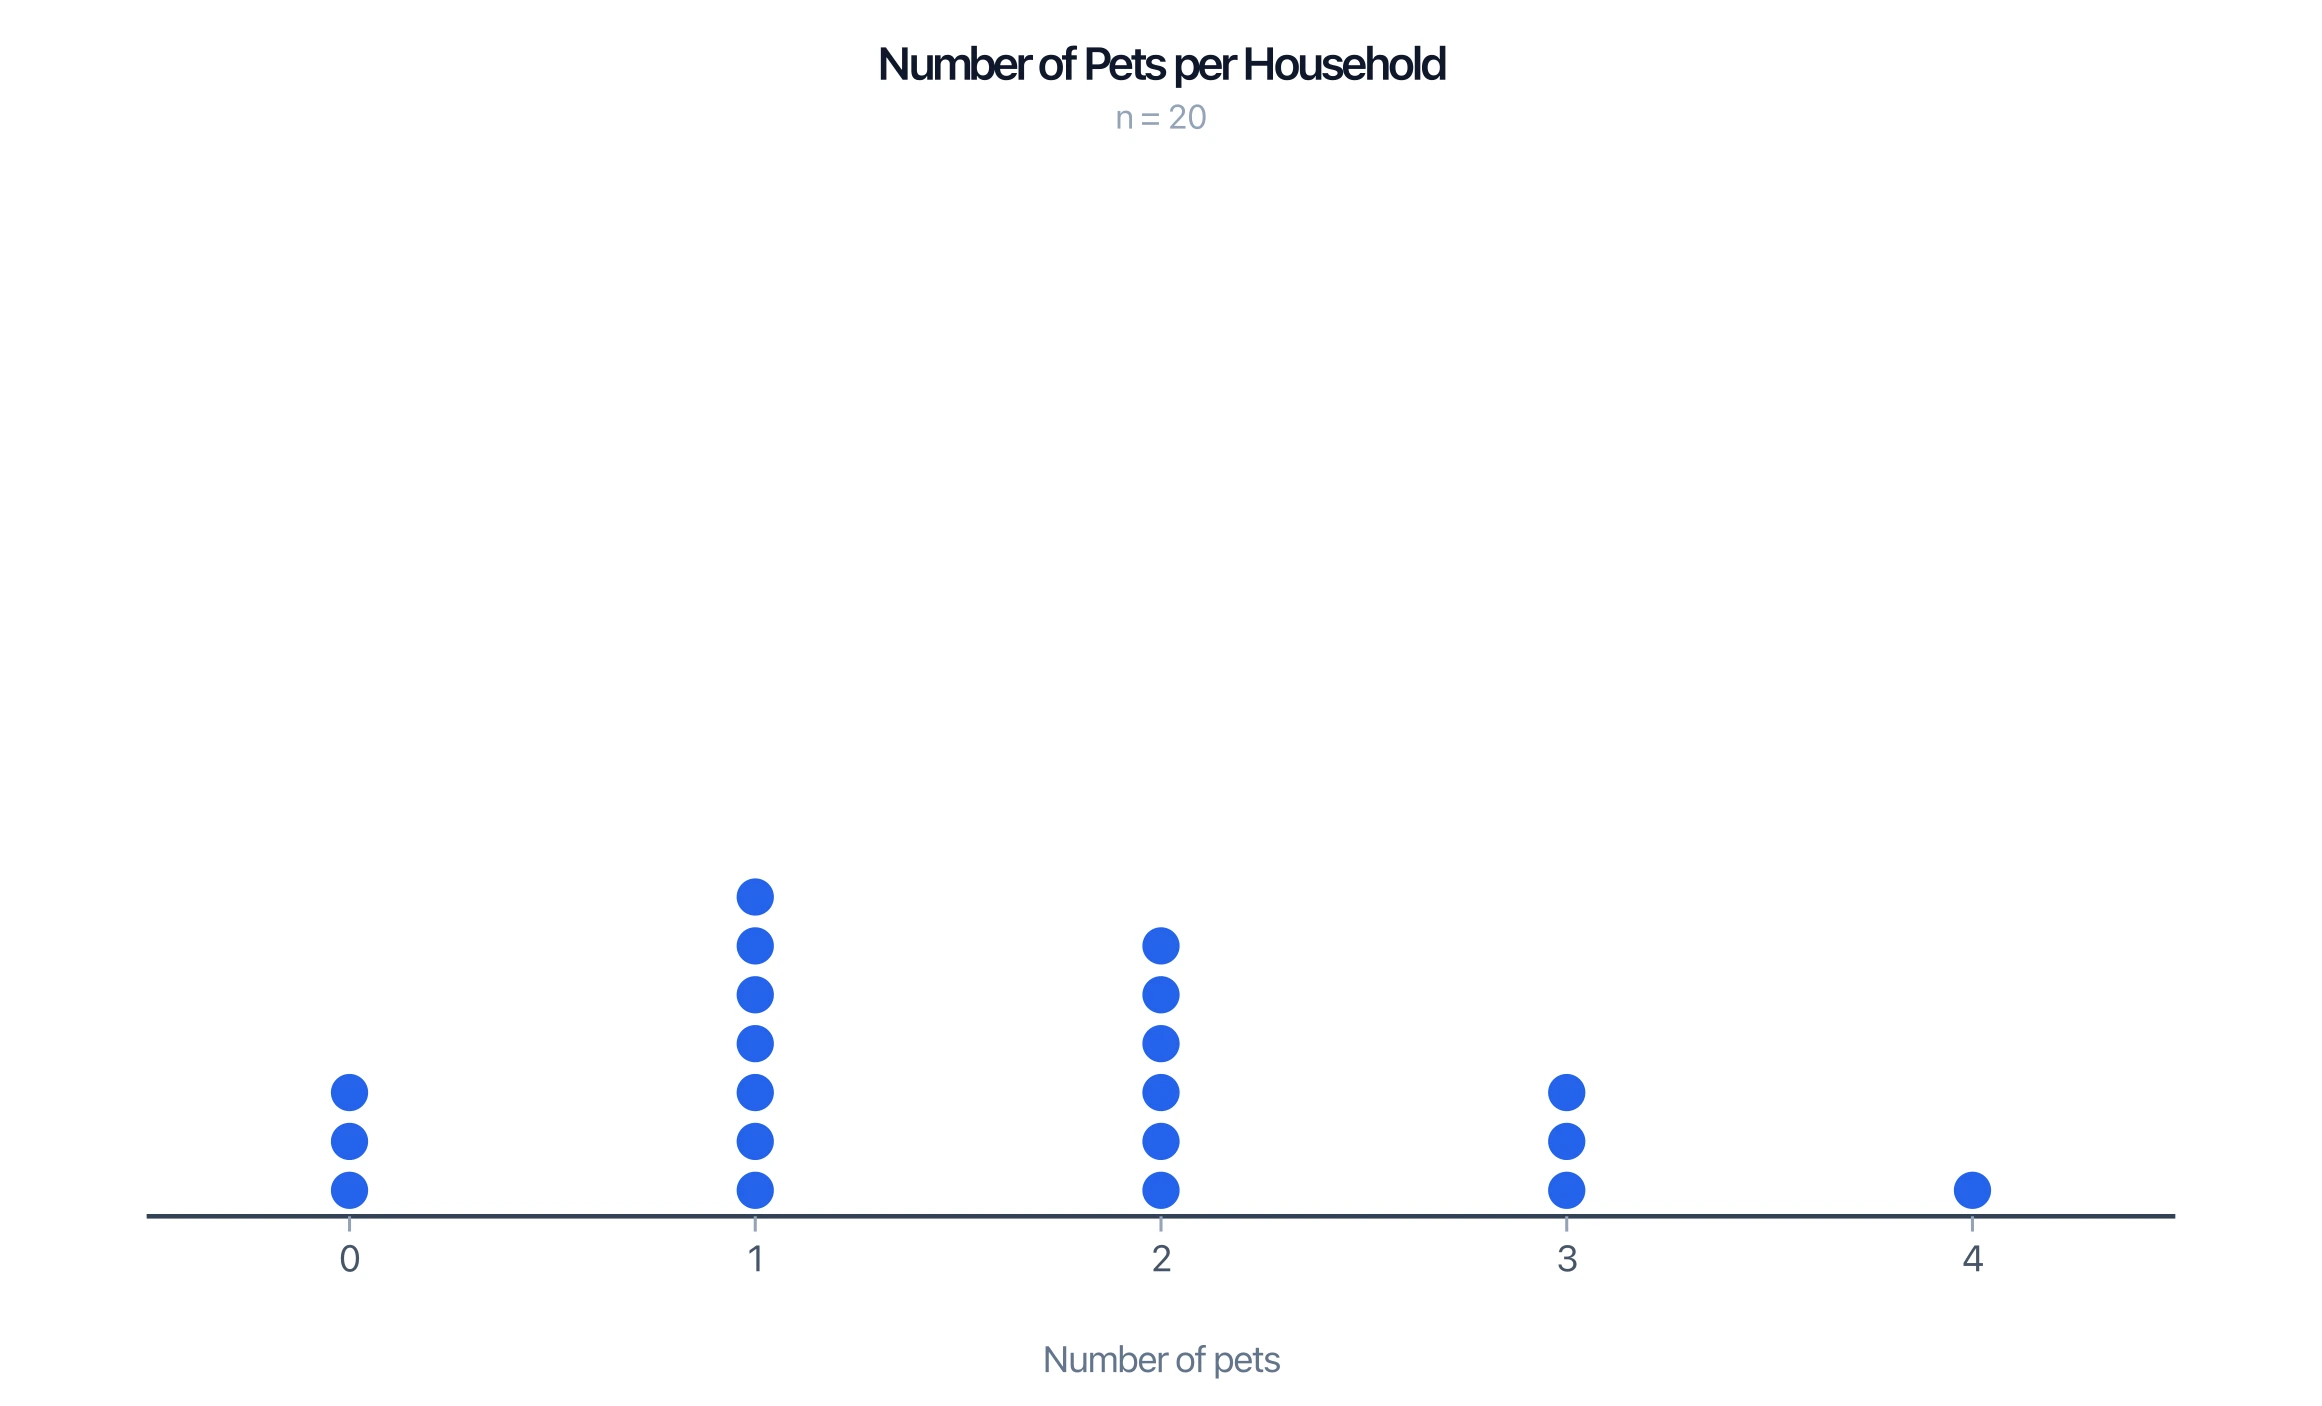
Dot Plot Generator
Turn a list of numbers into a precise dot plot — stacked dots over a number line that show frequency and shape at a glance.
 Education
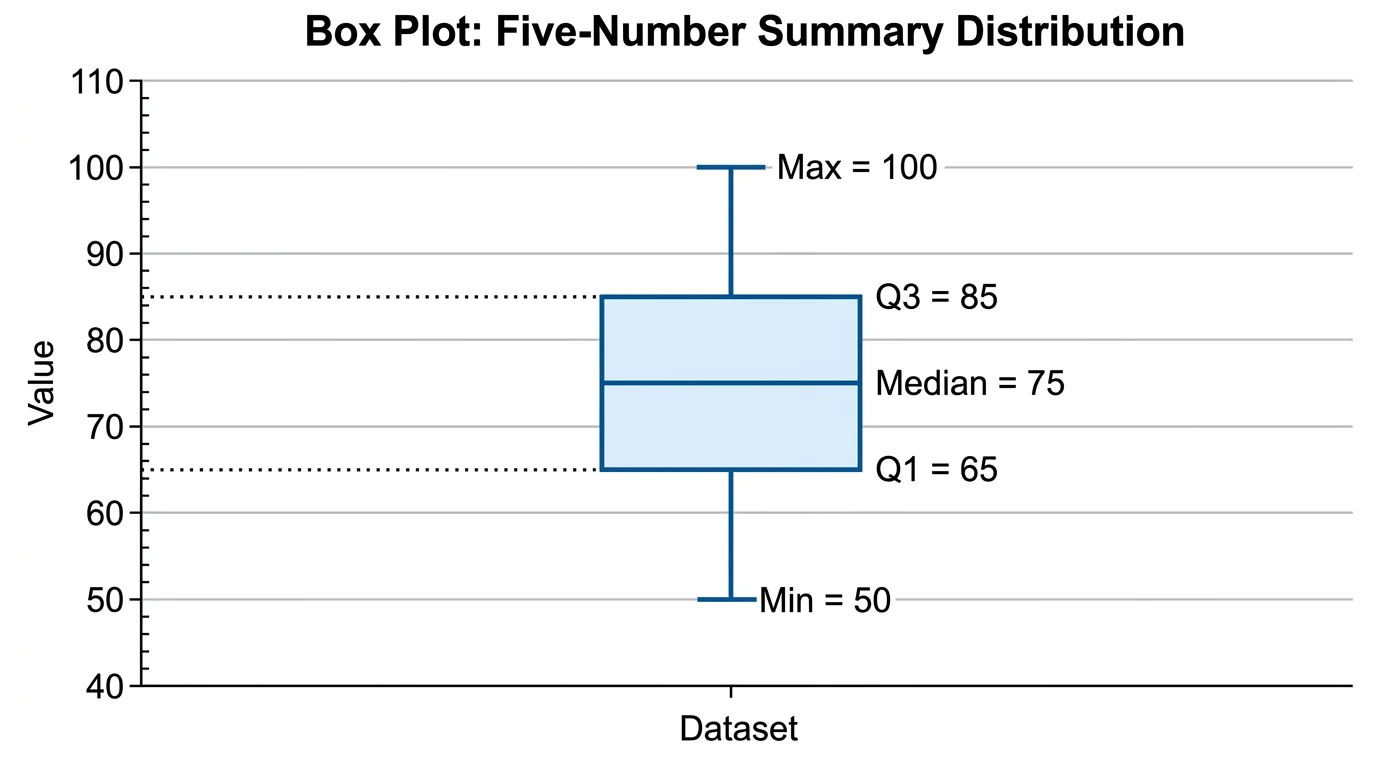
Box Plot Generator
Build box-and-whisker plots from your data, showing the median, quartiles, range, and outliers of a distribution.
 Education
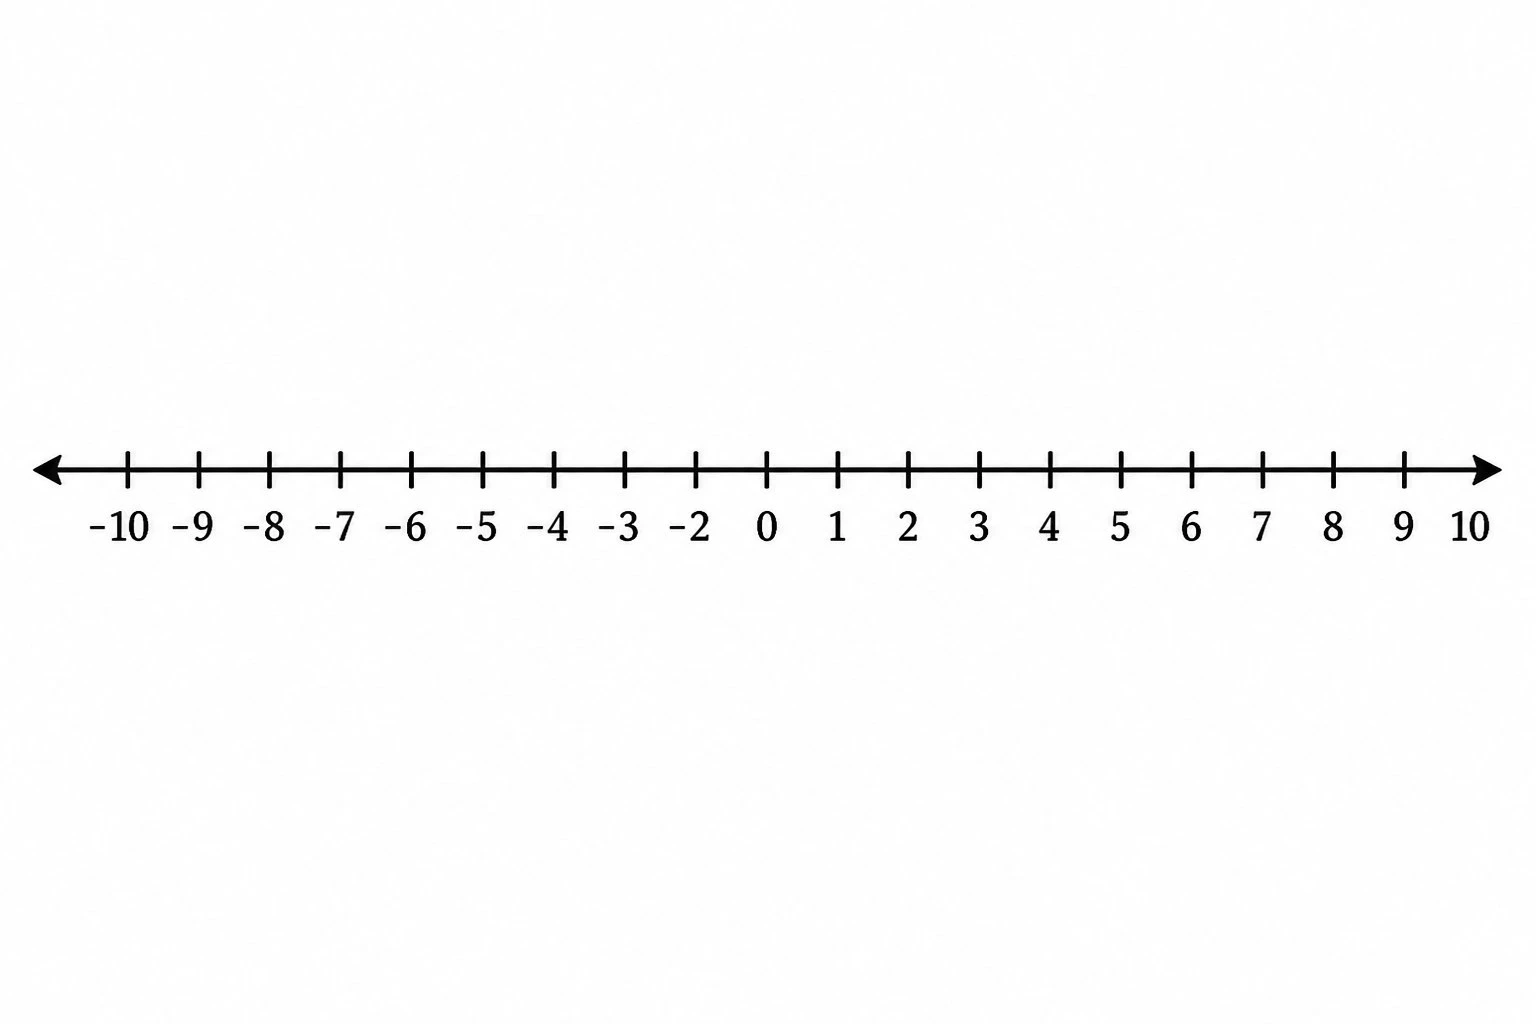
Number Line Generator
Create precise number lines: plot points, graph inequalities and intervals, and mark fractions or decimals.