Sequence Diagram Generator for UML Message Flows
Auto-generate UML sequence diagrams from a text description. Lay out participants, lifelines, synchronous and async messages, activation bars, and loop/alt/opt fragments to map API call flows, login and auth flows, and system interactions online.
Sequence Diagram Generator
Free to try ·
Your sequence diagram will appear here
Describe the interaction and click Generate
Sequence Diagram Examples
API call flows, auth flows, and system interactions in standard UML notation
API Call Flow
A REST request traced across lifelines, with activation bars and dashed return messages.
Microservice Order Flow
Synchronous calls plus an async event, with an alt fragment for the out-of-stock branch.
OAuth 2.0 Auth Flow
The authorization-code handshake: redirect, login, code, token exchange, resource access.
Event-Driven Pub/Sub
A publish event fans out to several consumers, with a dead-letter path for failures.
Banking Transfer
A money transfer with fraud screening in an alt fragment and ordered debit/credit steps.
Real-Time Chat Delivery
WebSocket delivery for online users and a push-notification fallback for offline ones.
What is a UML sequence diagram?
A UML sequence diagram is an interaction diagram that shows how participants in a system exchange messages over time. Each participant gets a vertical lifeline, time runs top to bottom, and the ordered arrows between lifelines spell out exactly who calls whom and in what order. Because it captures the order of events rather than the static structure, a sequence diagram is the clearest way to document a single scenario — an API request, a login attempt, or a checkout — without burying it in code. This generator draws that whole interaction from a plain-English description, placing every lifeline, message, and fragment for you.
Core elements: lifelines, messages, and fragments
- Actors and participants: an actor (a stick figure) is a user or external system, while a participant is an object, service, or component drawn as a labeled box at the top of a lifeline.
- Lifelines: the dashed vertical line under each participant representing its existence through time.
- Synchronous messages: a solid line with a filled arrowhead — the caller waits for a response (a normal method call or blocking request).
- Return messages: a dashed line with an open arrowhead carrying the reply back to the caller.
- Asynchronous messages: a solid line with an open arrowhead — the sender does not wait (events, queued messages, fire-and-forget calls).
- Activation (execution) bars: the thin rectangles on a lifeline showing when a participant is actively processing a message.
- Combined fragments: boxed regions for control flow — loop for repetition, alt for either/or branches, and opt for an optional step that may be skipped.
Sequence diagram vs flowchart
A flowchart shows the steps of a single process or algorithm — decisions, actions, and the path through them — usually from one actor’s point of view. A sequence diagram instead shows how several participants collaborate: the emphasis is on the messages exchanged between lifelines and their exact ordering over time. Reach for a flowchart when you are modeling logic inside one component, and a sequence diagram when the interesting part is the conversation between components — which service calls which, what comes back, and what happens in parallel. The two are complementary, and many designs use a flowchart for internal logic and a sequence diagram for the cross-service call flow.
Common uses: API, auth, and system interactions
- API call flows: trace a request from client through gateway, services, and database, with each response drawn as a return message.
- Login and authentication flows: model password checks, two-factor OTP, OAuth 2.0 authorization-code handshakes, and JWT issuance step by step.
- Microservice interactions: show synchronous service-to-service calls alongside asynchronous events published to a broker like Kafka.
- Distributed and real-time systems: capture WebSocket delivery, pub/sub fan-out, retries, and fallback paths for offline or failed cases.
- Documentation and review: a sequence diagram makes a design reviewable — reviewers can see ordering and error branches at a glance.
How to generate a sequence diagram from text
Describe the interaction in plain language: name the participants (actors, services, objects), list the messages they exchange and the order they happen in, and call out any conditional paths, loops, or async calls. The generator turns that into a sequence diagram with proper lifelines, solid arrows for synchronous calls, dashed arrows for returns, open arrowheads for async messages, activation bars, and loop/alt/opt fragments where you describe them. The more specific you are — for example, "if the payment is declined, show an alt fragment that returns an error" — the more accurate the result. Generate a few options, pick the clearest, and download it.
Modeling loops, alternatives, and async messages
Real interactions are rarely a straight line, and combined fragments are how a sequence diagram handles that. Use a loop fragment for steps that repeat, such as polling a job until it completes or processing each item in a batch. Use an alt fragment for mutually exclusive branches — success versus failure, authorized versus rejected — and an opt fragment for a step that only sometimes runs, like sending a notification only when a user has opted in. Asynchronous messages (open-arrowhead arrows) model work that does not block the caller, such as emitting an event or enqueuing a task, so the timeline keeps moving. Describe these conditions in your prompt and the generator draws the right fragments and arrow styles for each.
Frequently Asked Questions
Related Diagram Tools
 Software
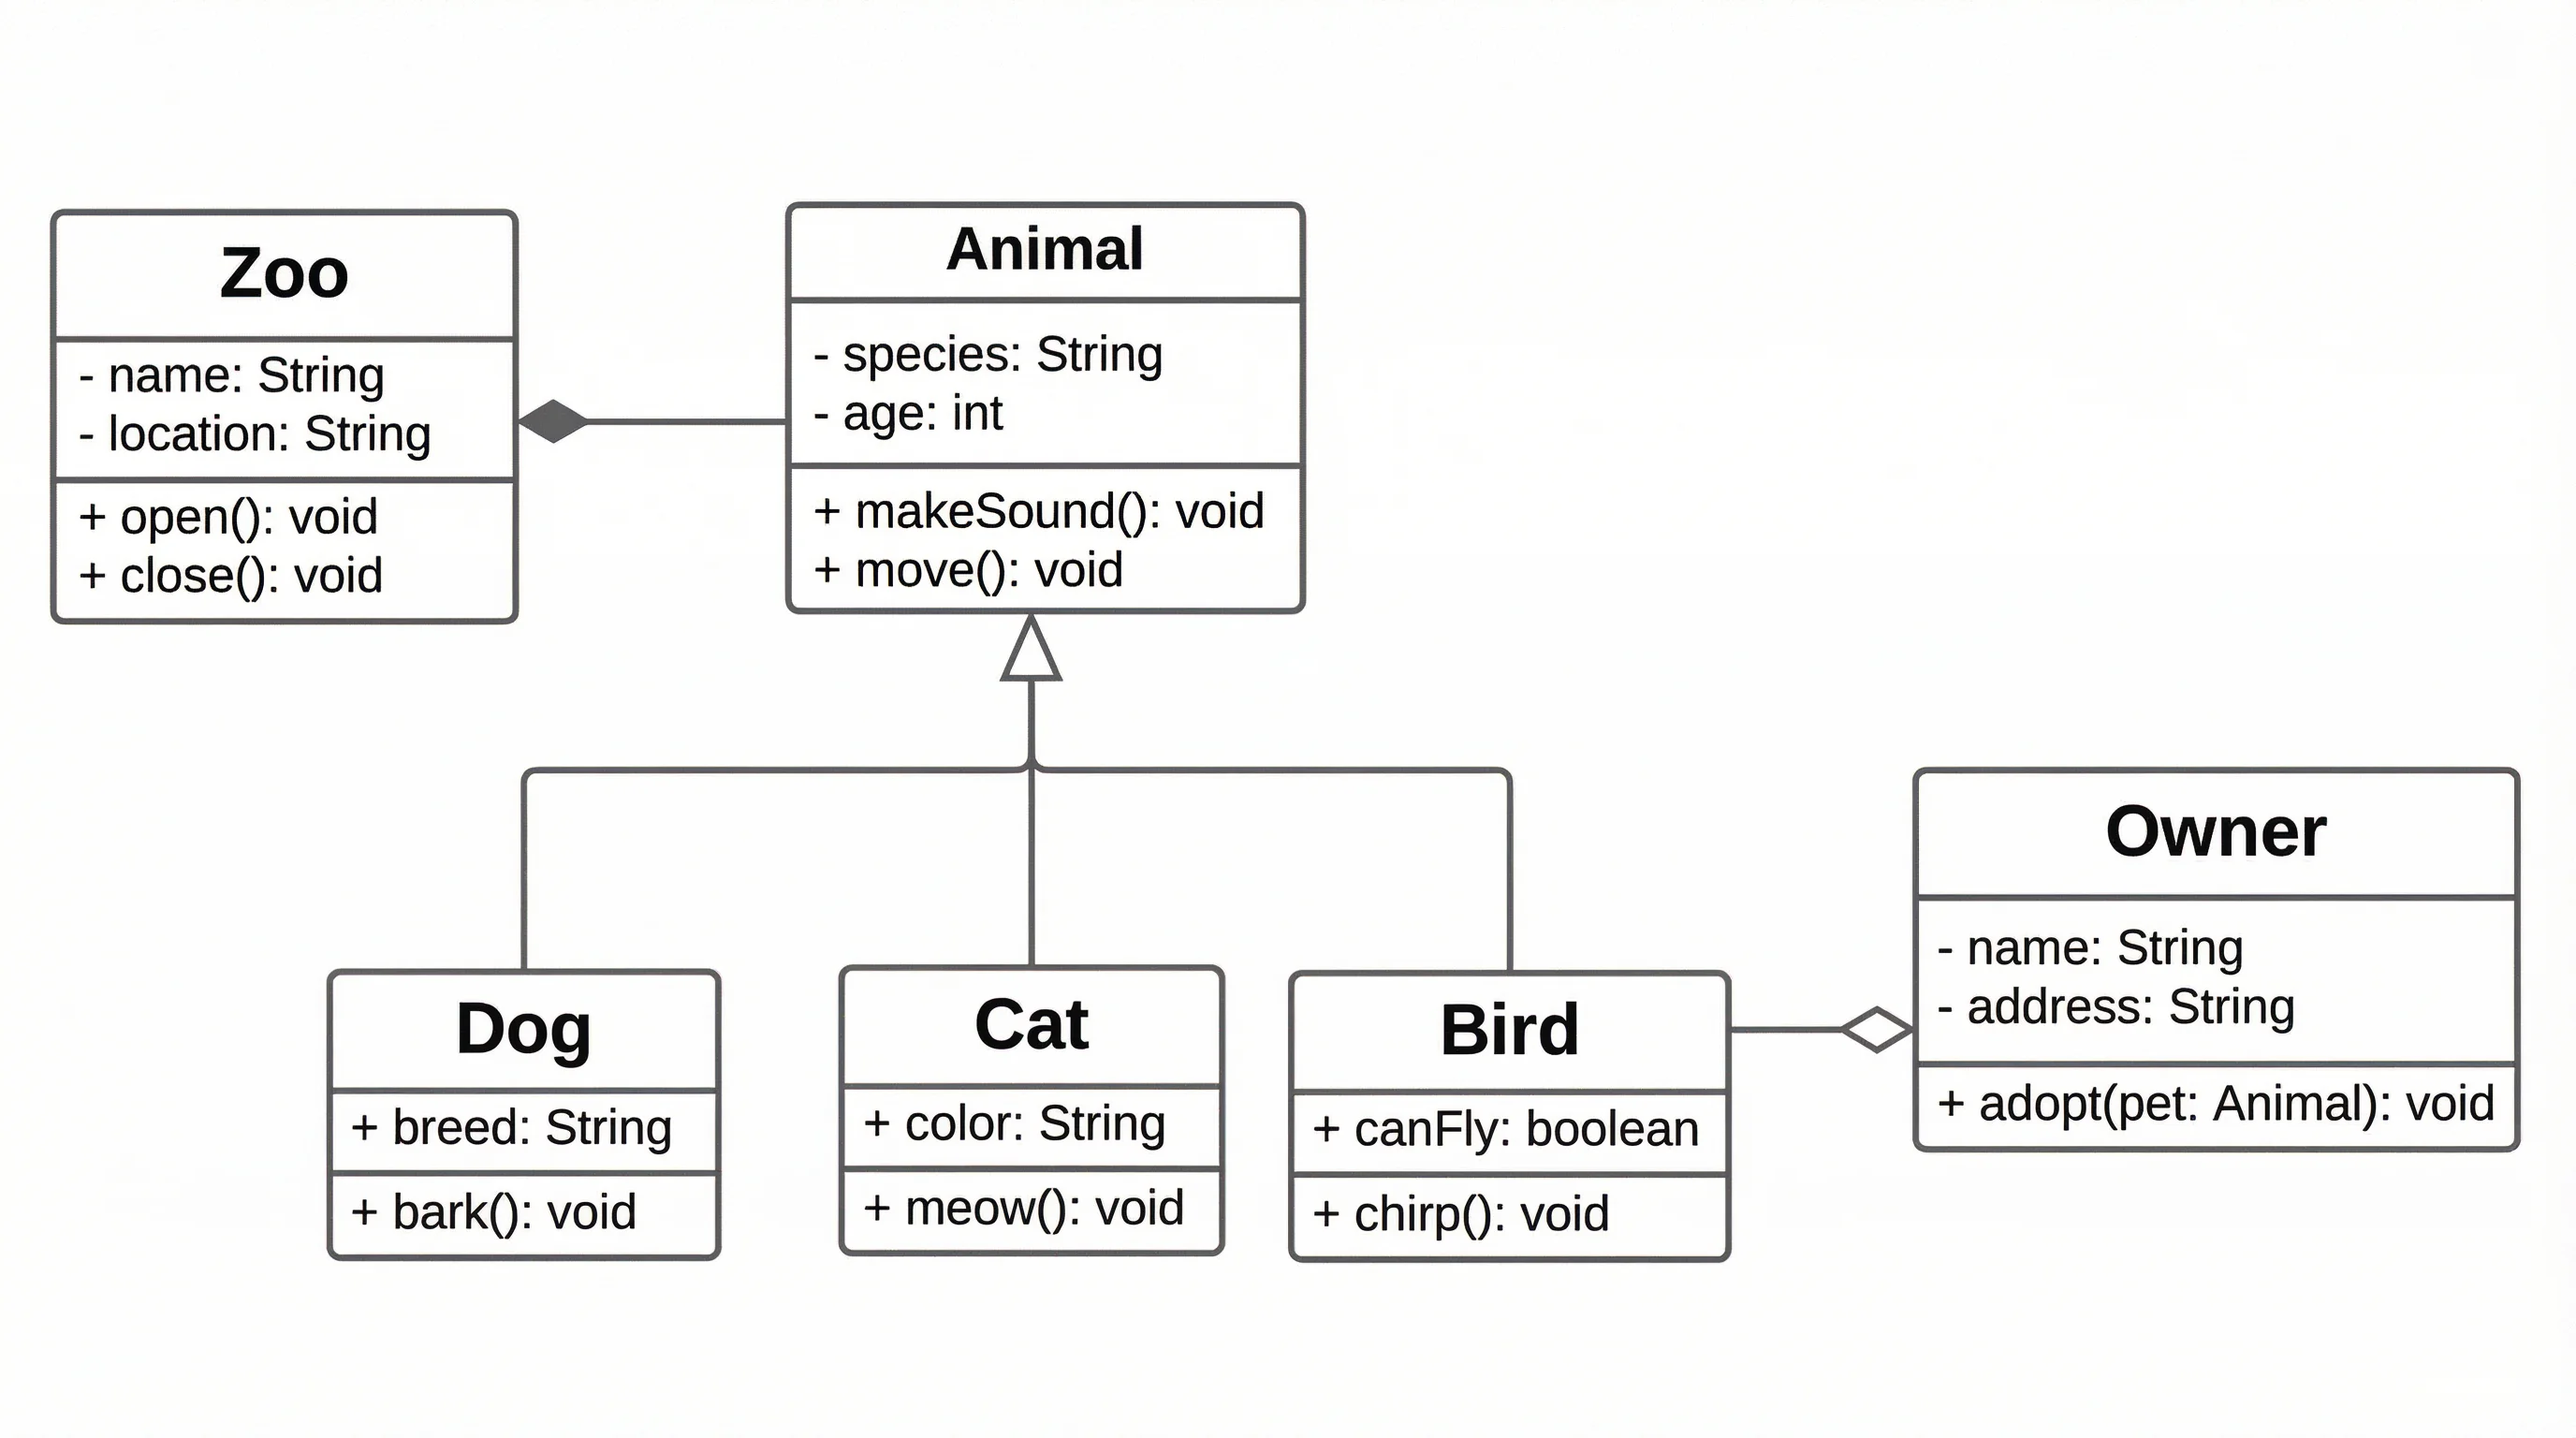
UML Diagram Generator
Create class, use case, component, and other UML diagrams from a description.
 Software
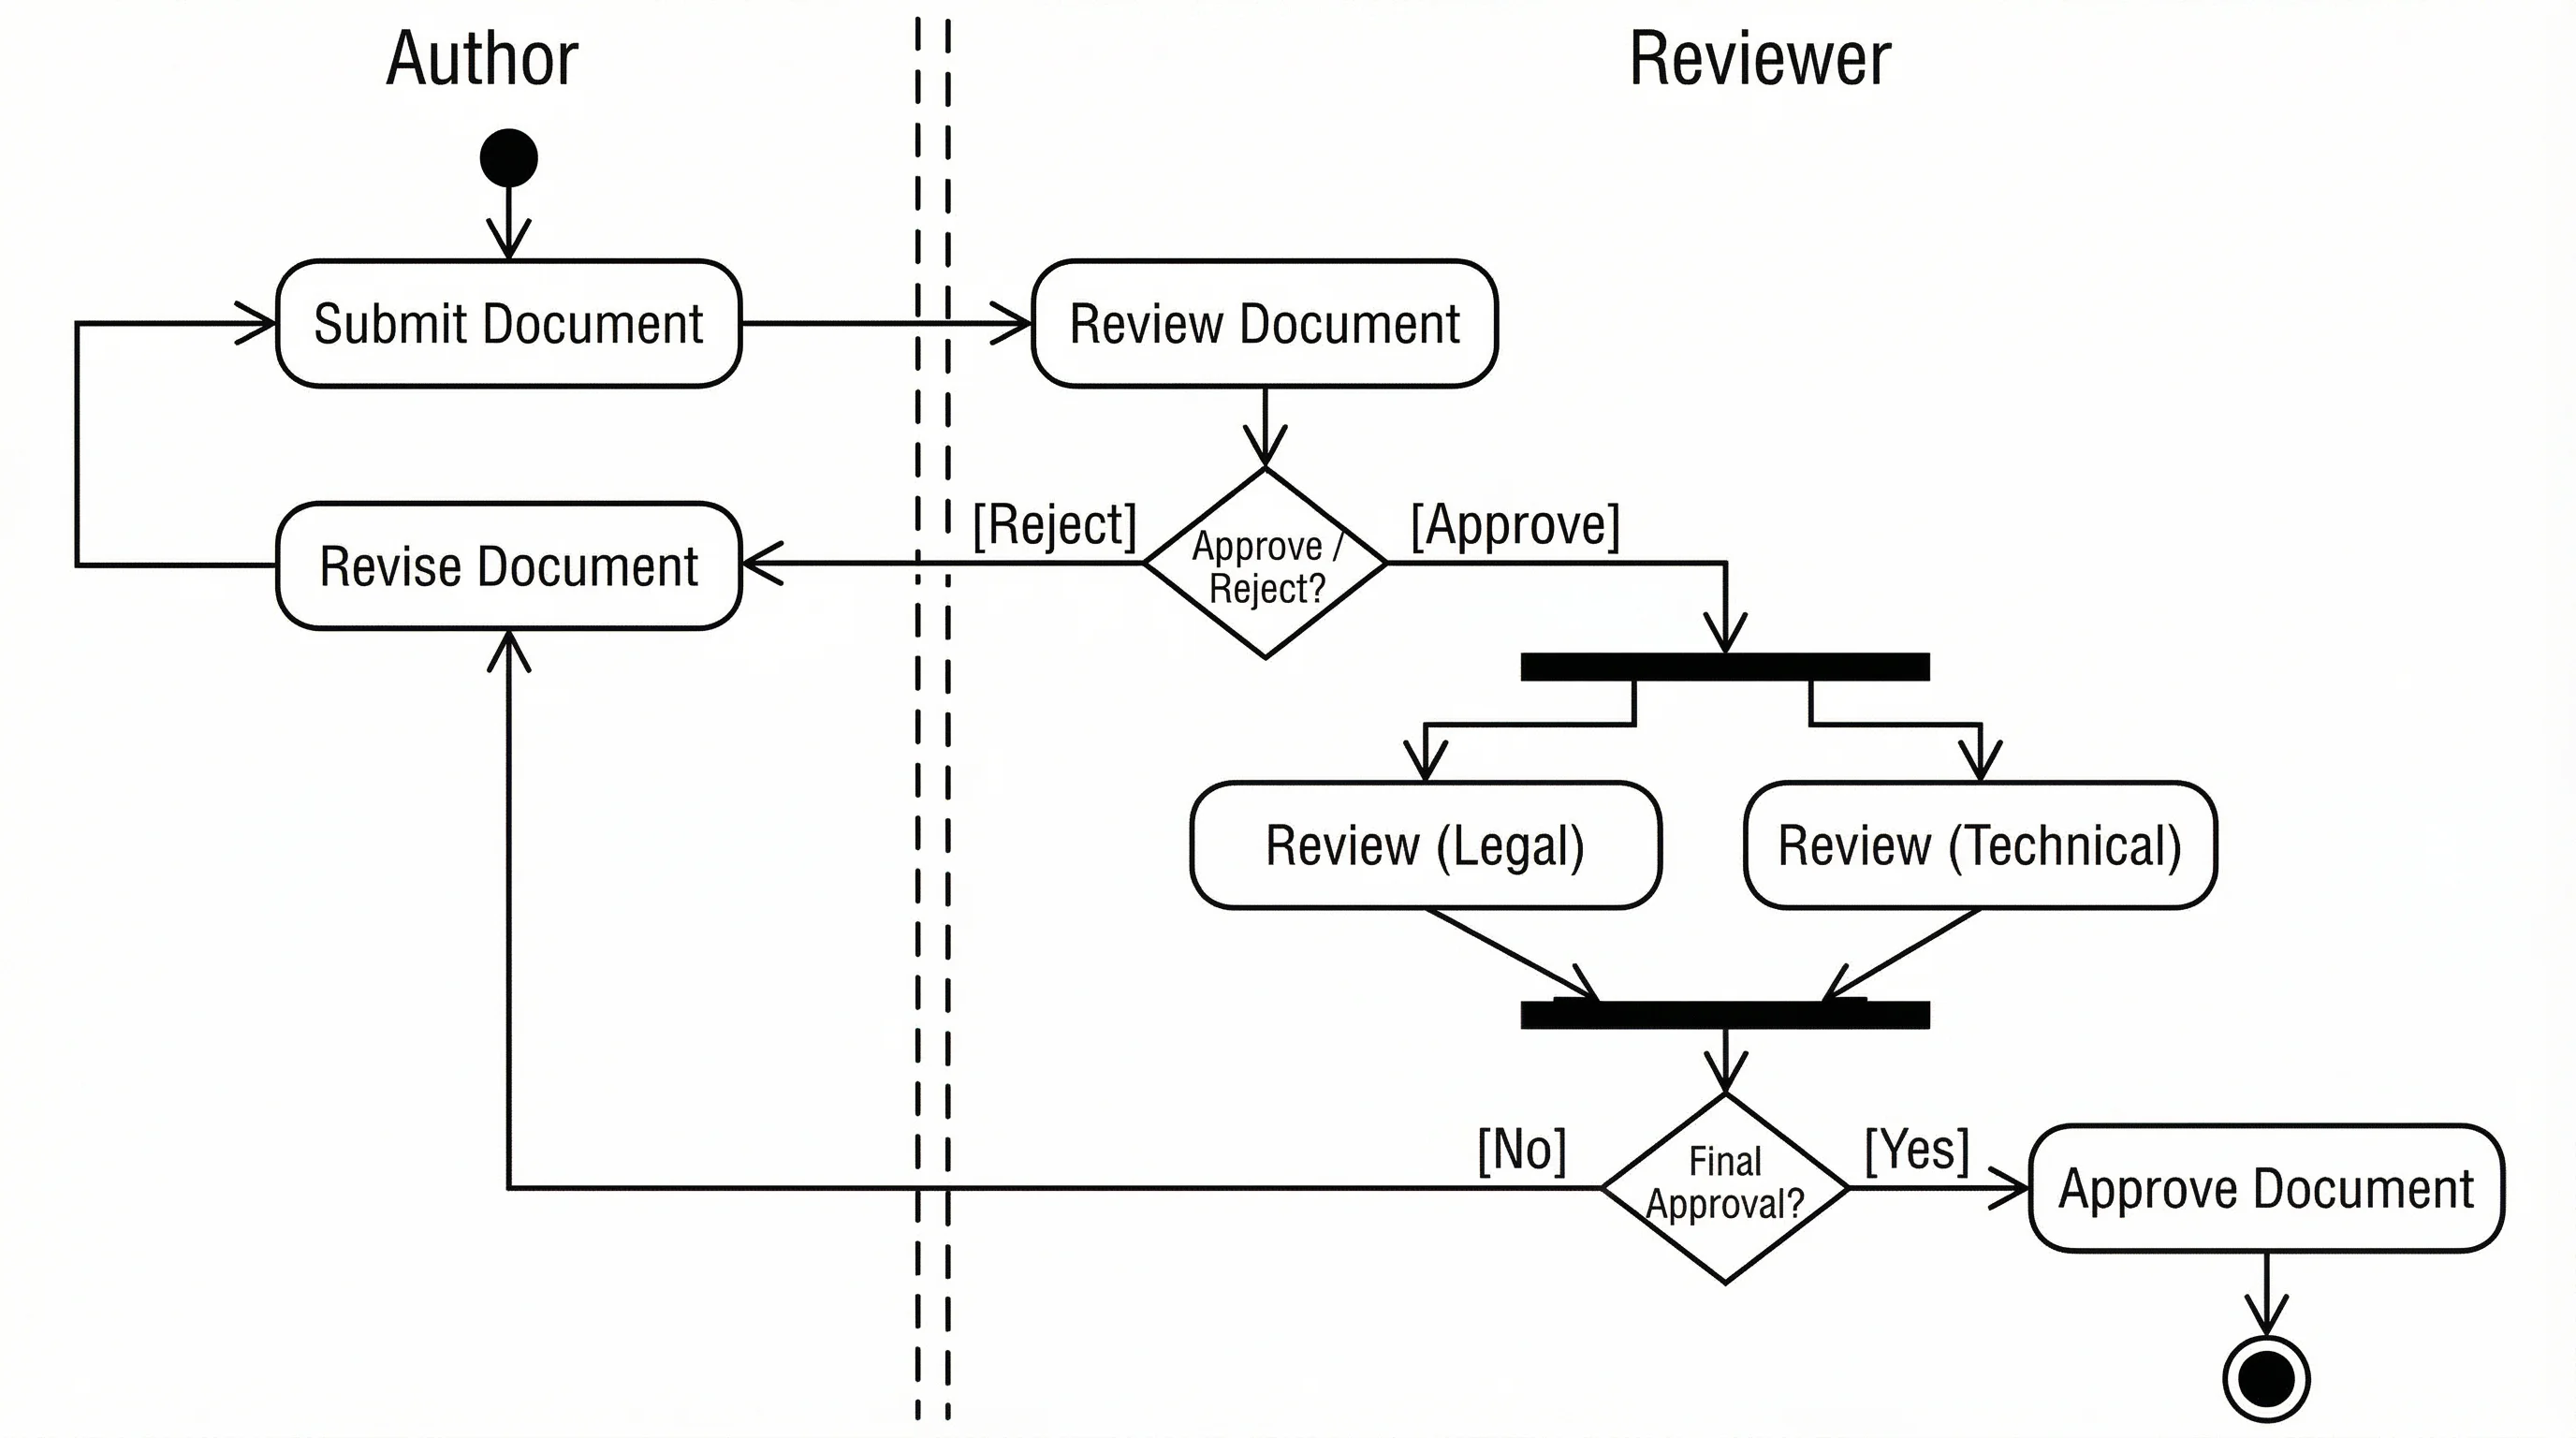
Activity Diagram Generator
Model workflows and processes with UML activity diagrams — actions, decisions, and swimlanes.
 Software
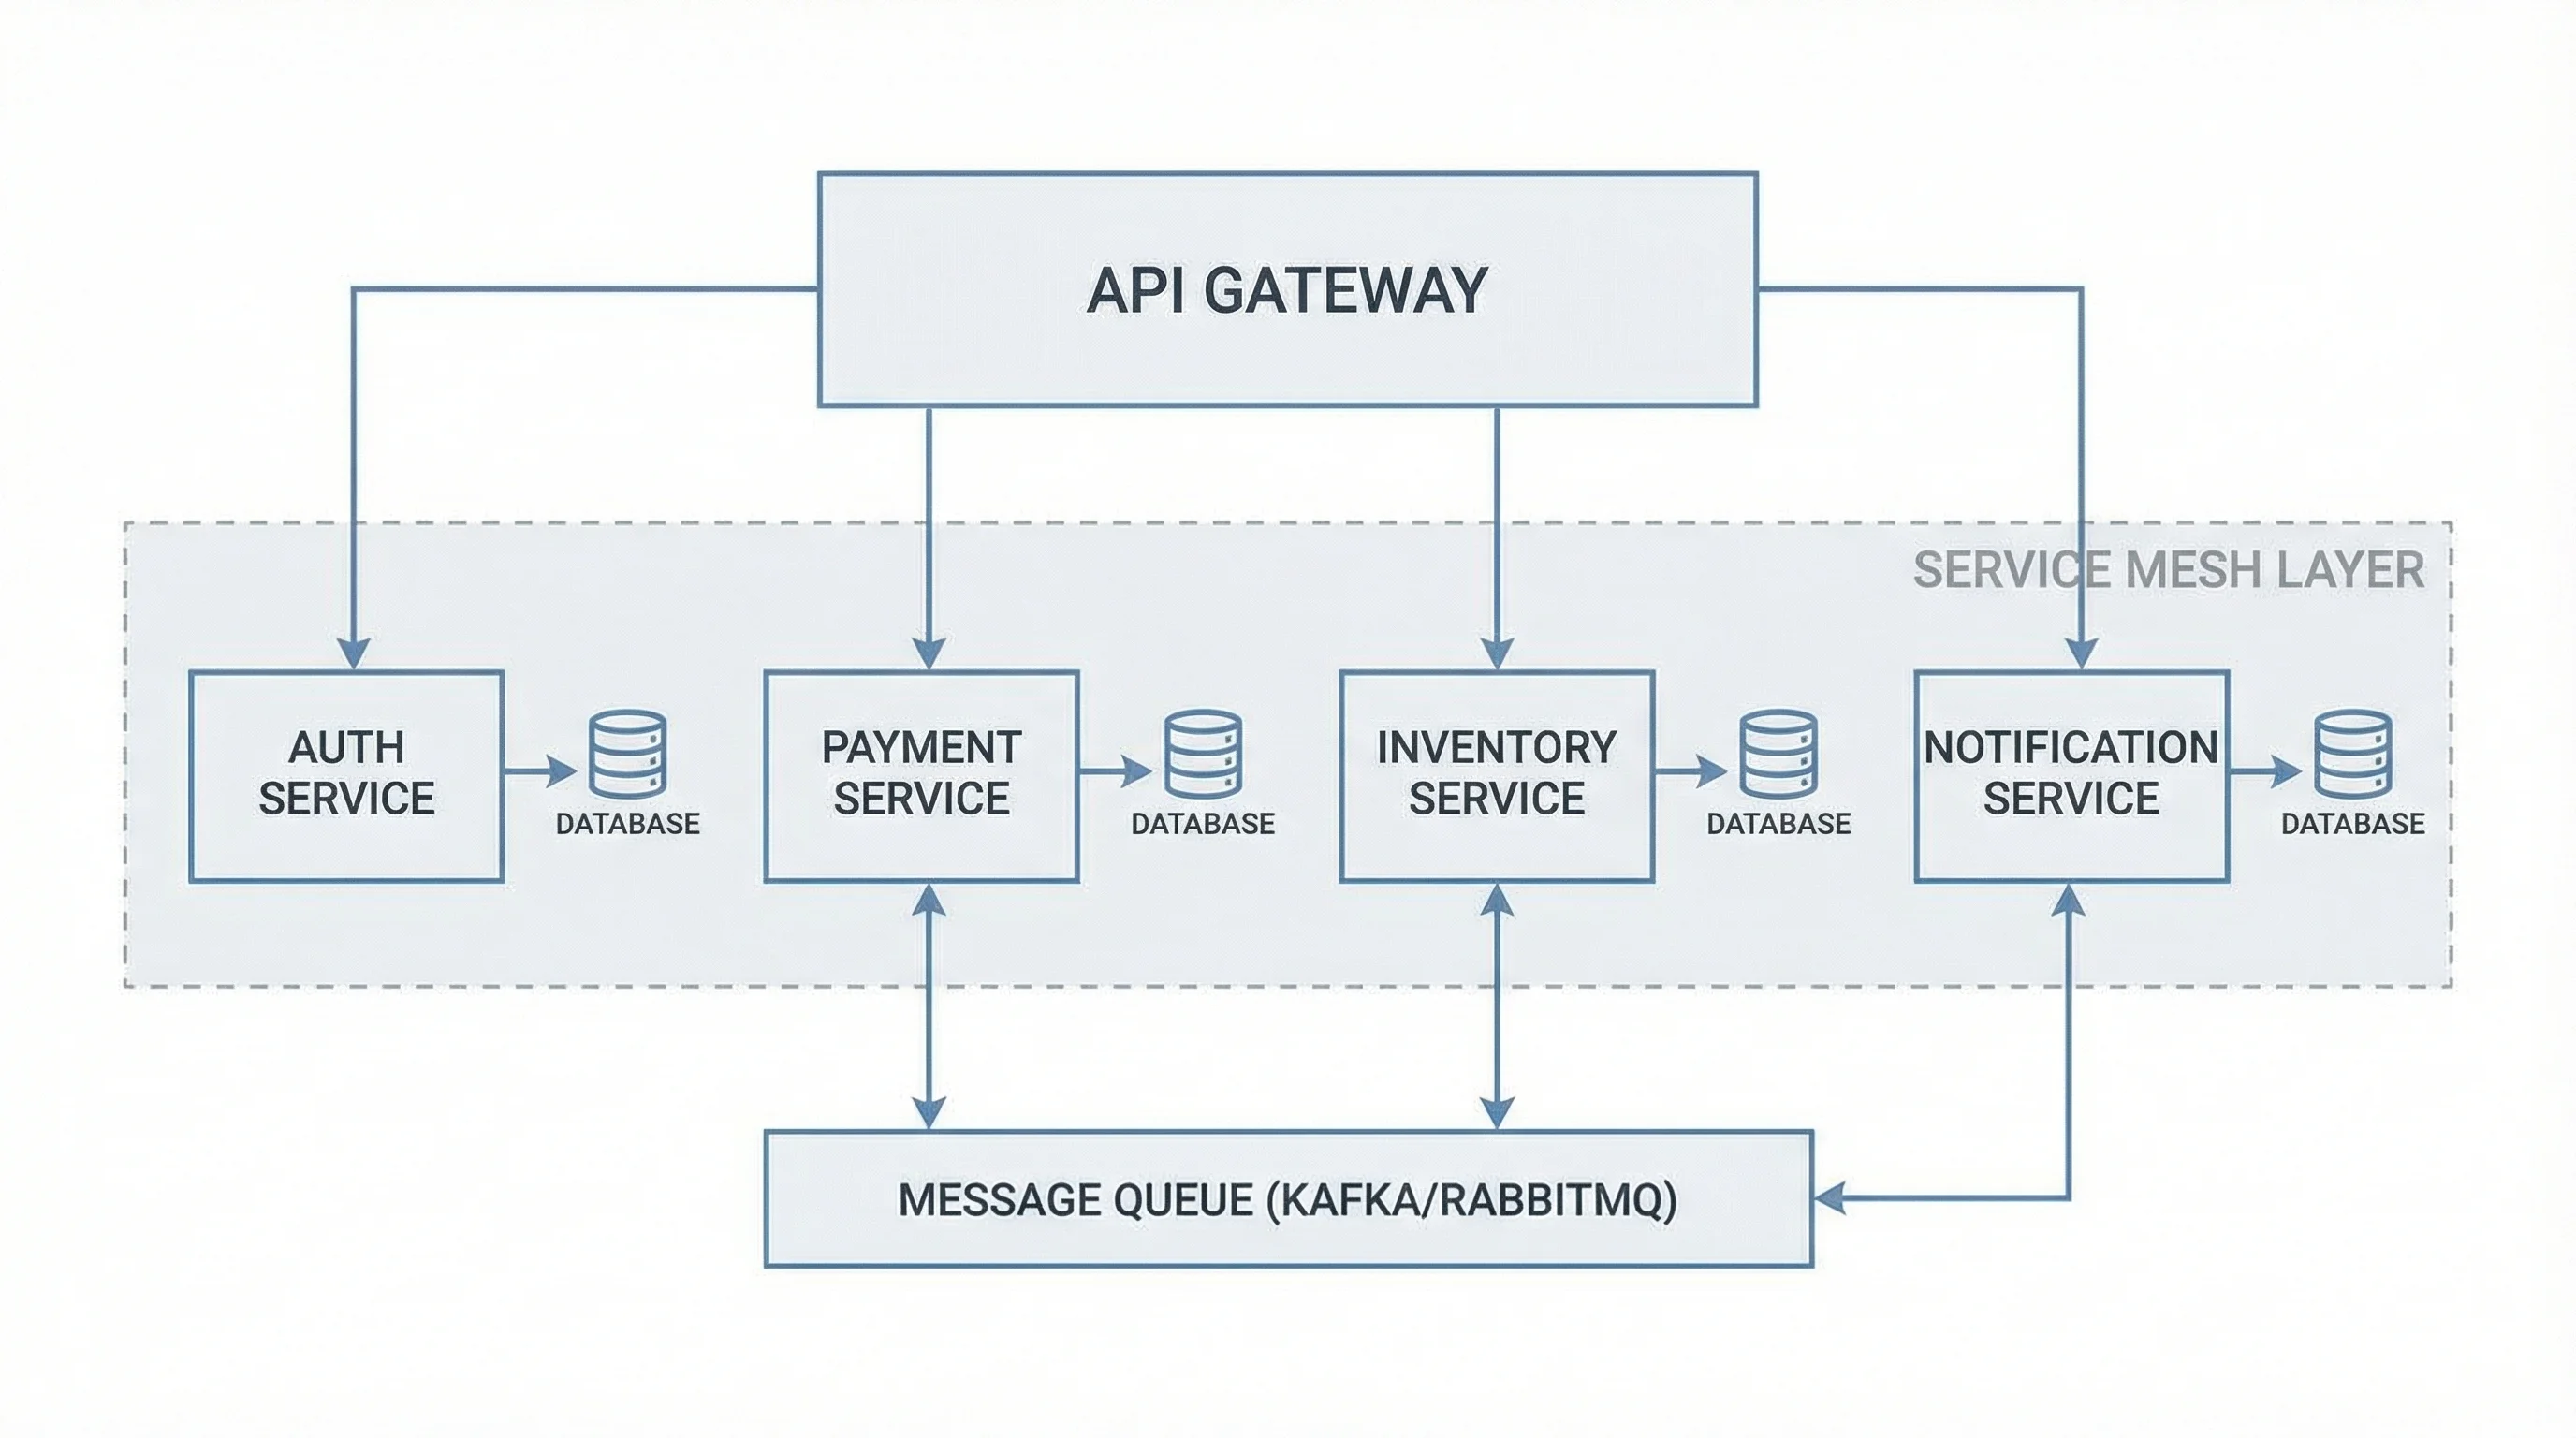
Software Architecture Diagram
Diagram microservices, layers, and system components and how they connect.