Place Value Chart Generator with Any Number
Make a place value chart for any number: place each digit in its column from ones to millions, show digit values and expanded form, export SVG or PNG.
Place Value Chart Examples
Common ways to build and label a place value chart
Labeled Place Value Chart
A clean place value chart with labeled place columns and the digits placed in their columns.
Place Value with Decimals
A place value chart that extends past the decimal point into tenths and hundredths.
Large Number Place Value
A place value chart for a large number grouped into Ones, Thousands, and Millions periods.
Digit Values Chart
A place value chart that shows the value of each digit, such as 3000, 400, 50, and 2.
Expanded Form Chart
A place value chart with the expanded form of the number written out below the grid.
Blank Place Value Chart
A blank place value chart with labeled place columns and empty cells for practice.
What is a place value chart?
A place value chart is a table that shows what each digit in a number is worth based on its position. Each column stands for a place — ones, tens, hundreds, thousands, and so on — and every place is exactly ten times the place to its right. When you write a digit in a column, its value is the digit multiplied by that place. In 3,452 the 3 sits in the thousands column, so it is worth 3,000, while the same digit 3 in the tens column would be worth only 30. Lining the digits up in labeled columns makes that idea concrete: students can see at a glance why the position of a digit, not just the digit itself, decides its value. This generator draws the chart exactly, placing each digit in the correct column so the number is always represented faithfully, no matter how large.
The places from ones to millions
- Reading a whole number from right to left, the places are ones, tens, hundreds, then thousands, ten thousands, hundred thousands, then millions, ten millions, hundred thousands, and onward into billions. Each step to the left multiplies the place value by ten.
- That ten-times pattern is the heart of our base-ten number system. The 5 in 50 is worth ten times the 5 in 5; the 5 in 500 is worth a hundred times as much. Seeing the columns side by side makes the pattern impossible to miss.
- Choose how far the chart reaches with the tool. A three-digit number only needs ones, tens, and hundreds, while a seven-digit number stretches all the way up to the millions column.
Decimals: tenths, hundredths, and thousandths
- Place value keeps going to the right of the ones column, past a decimal point, into fractions of one. The first place after the point is tenths, then hundredths, then thousandths — each one still ten times smaller than the place to its left.
- In 12.75 the 7 sits in the tenths column and is worth 0.7, and the 5 sits in the hundredths column and is worth 0.05. The decimal point marks the boundary between whole numbers and parts of a whole; it always sits between the ones and the tenths.
- Use the "Show places down to" menu to extend the chart to tenths, hundredths, or thousandths so decimal numbers line up cleanly under their whole-number neighbors.
Digit values and expanded form
- Turn on "Show the value of each digit" and the chart writes what each digit is worth beneath it — for 3,452 that reads 3000, 400, 50, and 2. This bridges the gap between seeing a digit and understanding its size.
- Expanded form takes the same idea and writes the number as a sum of those values: 3,452 becomes 3000 + 400 + 50 + 2. It shows exactly how the parts combine to make the whole and is a standard way to demonstrate place-value understanding.
- For decimals the expanded form includes the fractional parts, so 12.75 is 10 + 2 + 0.7 + 0.05. The tool builds these strings from the digits themselves, so they are always exact.
Using periods and groups
- Large numbers are easier to read when their digits are grouped in threes, and each group of three places is called a period: the ones period, the thousands period, the millions period, the billions period, and so on. This is why 1234567 is written 1,234,567.
- Switch on "Show period (group) headers" and the tool draws a shaded band over each group — Ones, Thousands, Millions — so students can see how the commas in a large number line up with the periods.
- Naming the periods also helps with reading numbers aloud: 1,234,567 is read as one million, two hundred thirty-four thousand, five hundred sixty-seven — each chunk matching one period on the chart.
Frequently Asked Questions
Related Math Tools
 Education
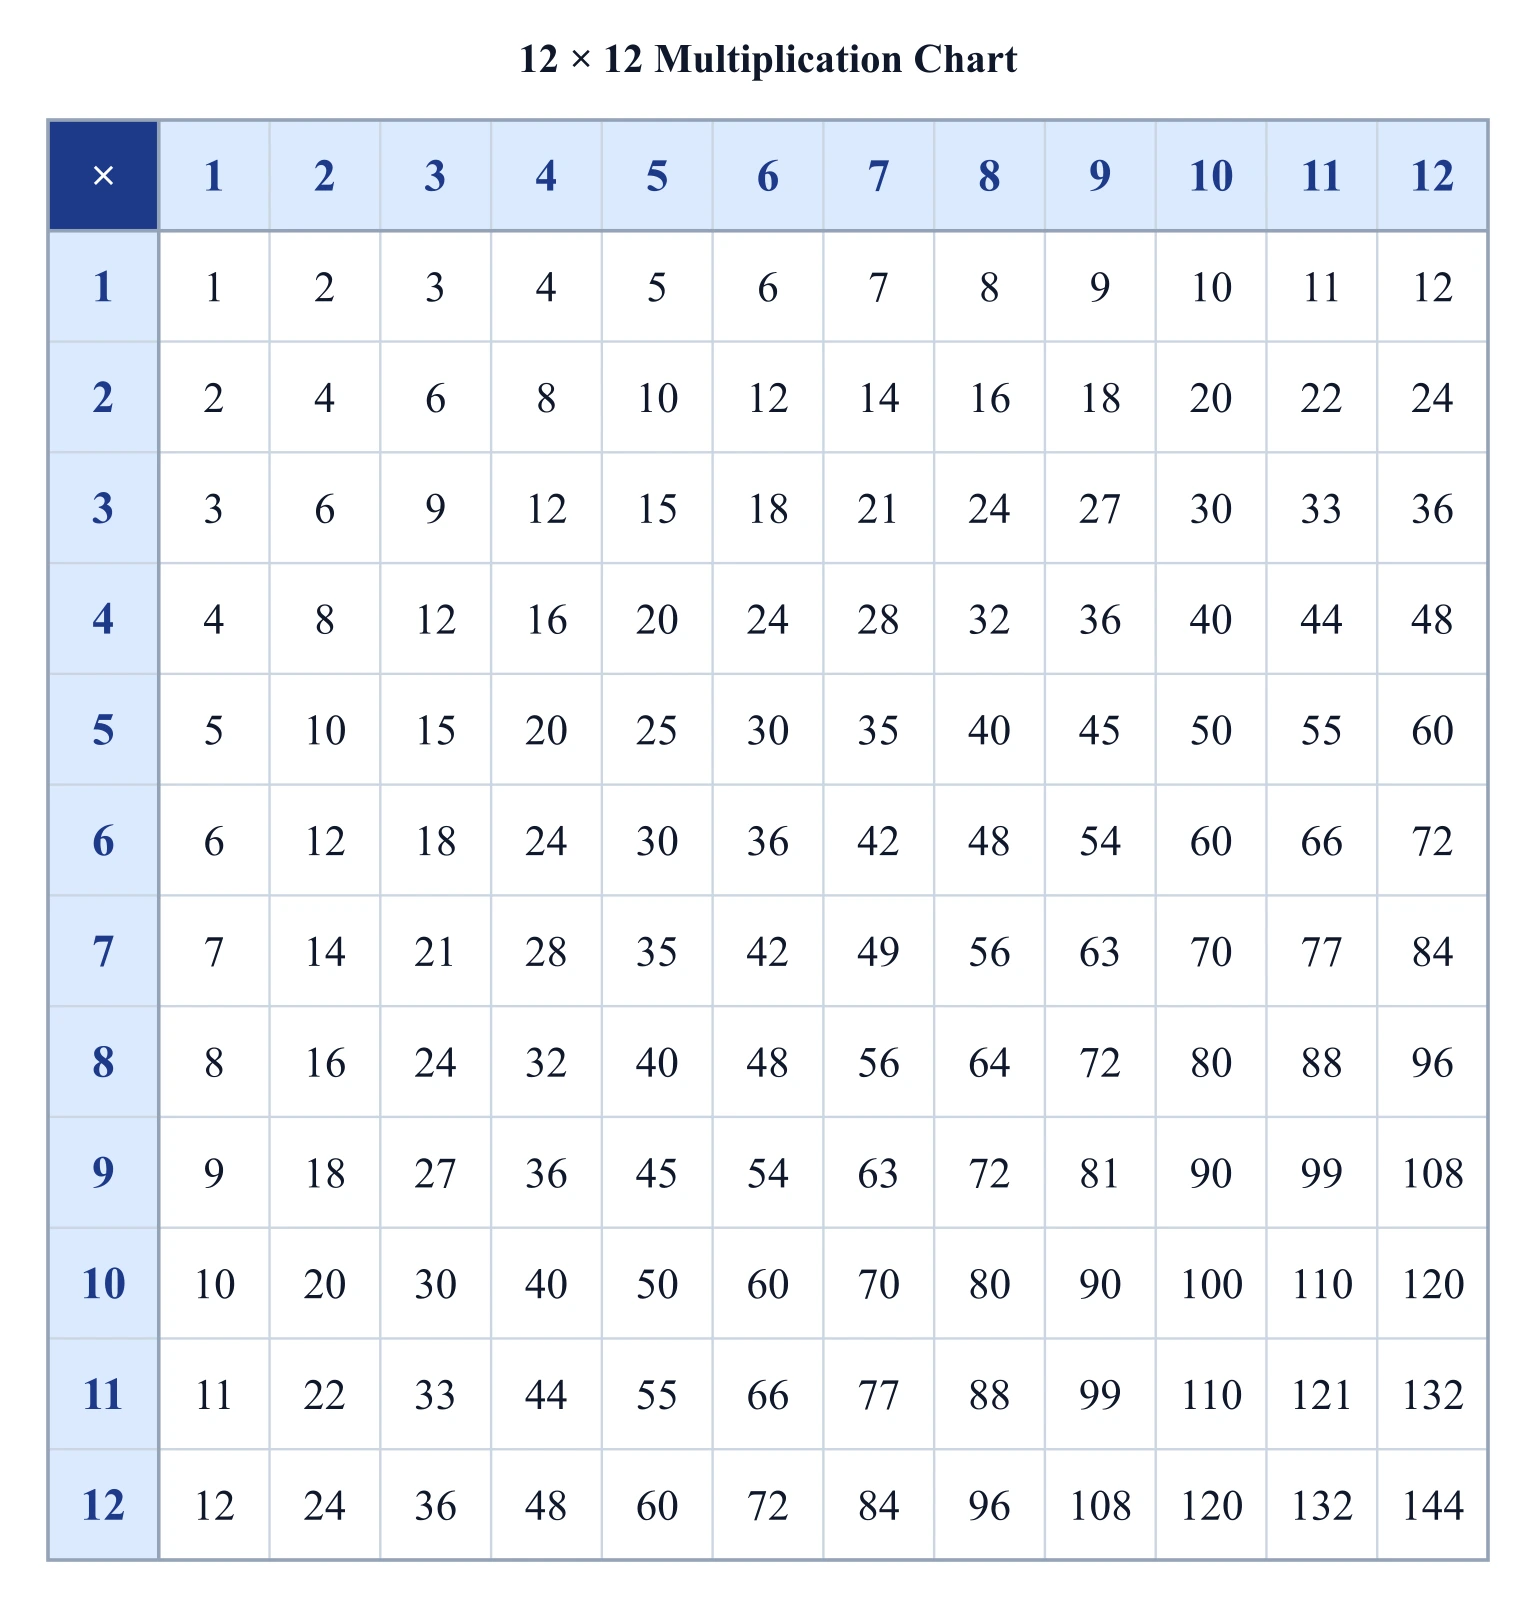
Multiplication Chart Generator
Create a printable multiplication chart: pick the grid size, highlight any times table, and export a clean SVG or PNG.
 Education
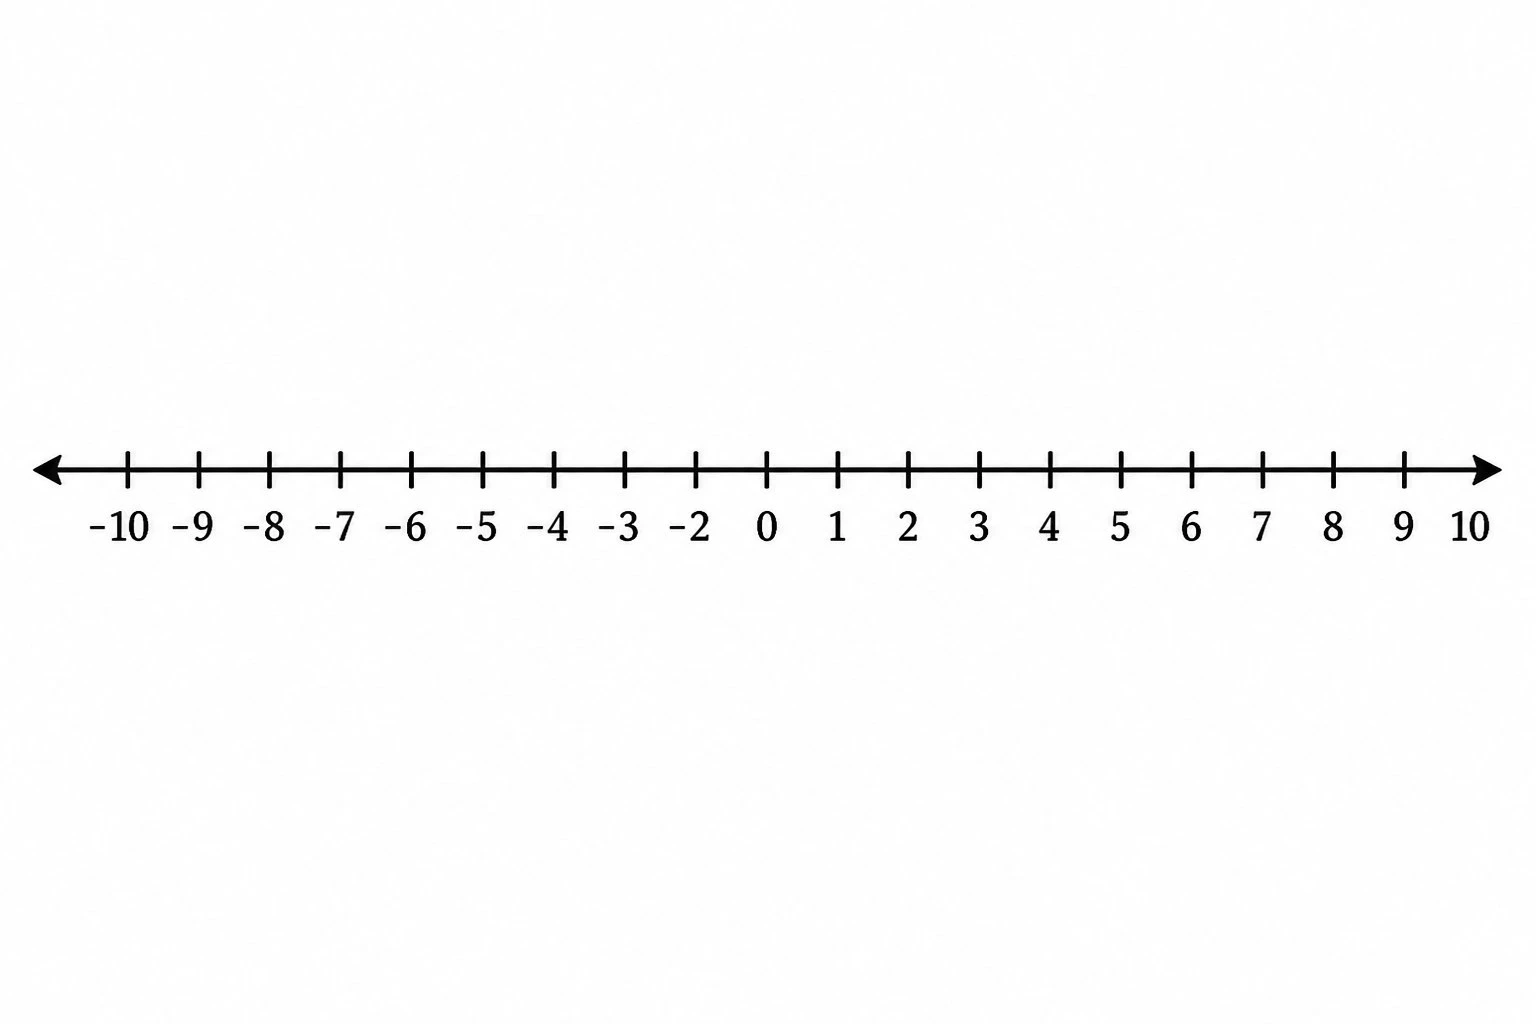
Number Line Generator
Create precise number lines: plot points, graph inequalities and intervals, and mark fractions or decimals.
 Education
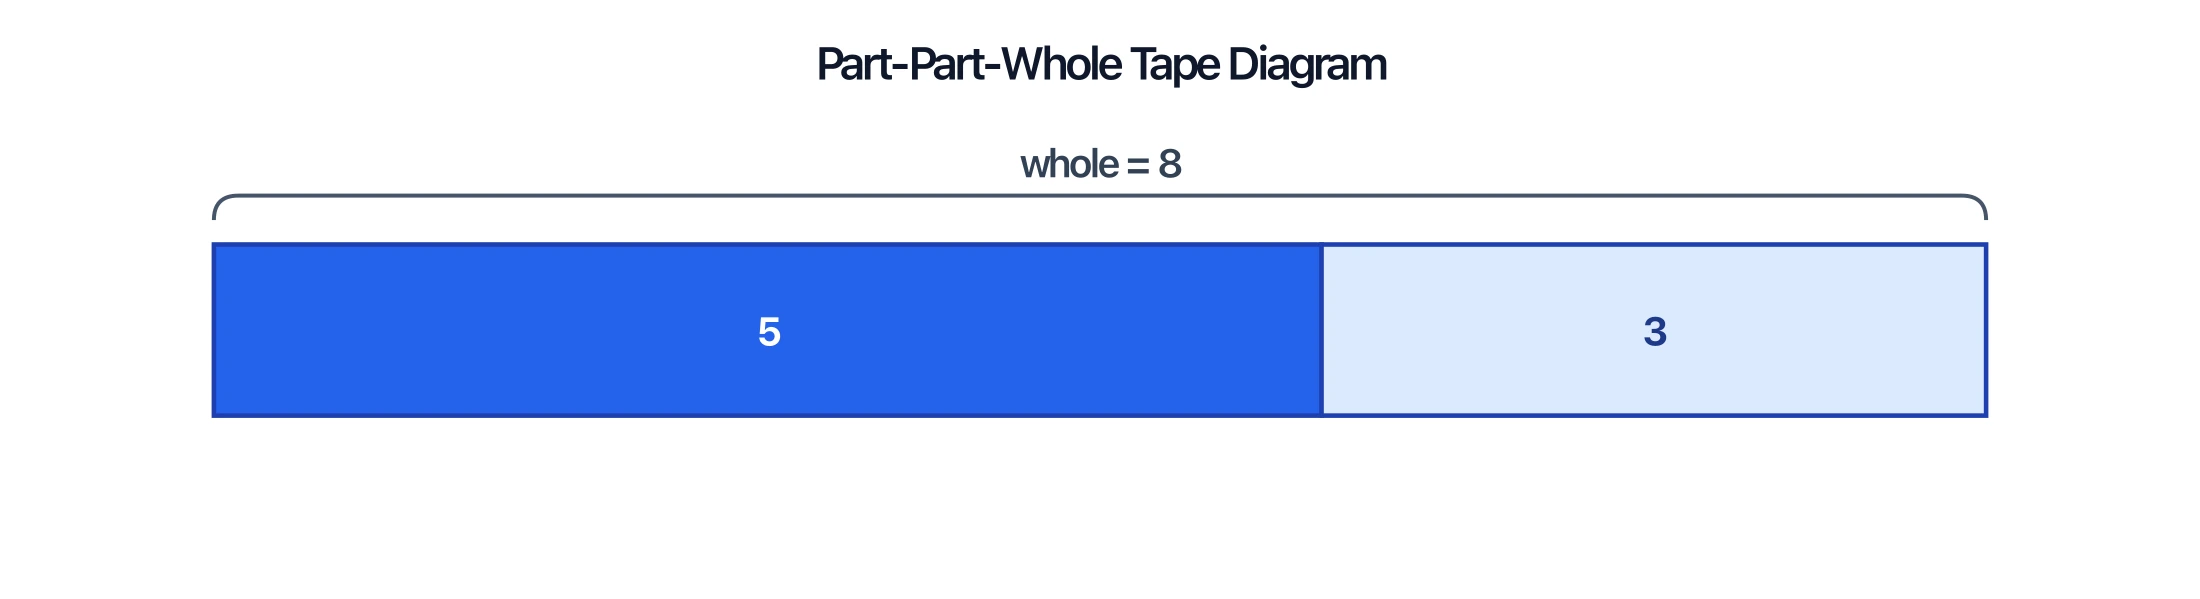
Tape Diagram Generator
Draw part-part-whole tape diagrams and bar models for fractions, ratios, and word problems.