Layers of the Earth Diagram Generator Labeled Earth Layers Diagrams
Create a labeled layers of the earth diagram with AI. Show the crust (continental and oceanic), mantle (lithosphere, asthenosphere, upper and lower), outer core (liquid), and inner core (solid) — with depth, temperature, composition, and state of matter for each layer. Download as PNG for earth science class, notes, or worksheets.
AI Layers of the Earth Diagram Generator
Free to try ·
Your earth layers diagram will appear here
Describe the layers to show and click Generate
Layers of the Earth Diagram Examples
Labeled cross-sections, temperature diagrams, compositional vs mechanical layers comparisons, and blank worksheets
Labeled Earth Layers Cross-Section
A full labeled cross-section of Earth showing every layer from crust to inner core with depths and states of matter.
Earth Layers with Temperature and Depth
Adds temperature and depth data to each layer — useful for high-school earth science and geology units.
Simple Earth Layers for Kids
A clean, color-coded version with plain-language labels — ideal for elementary and early middle school.
Compositional vs Mechanical Layers
Shows both classification systems side by side — compositional (crust/mantle/core) and mechanical (lithosphere/asthenosphere/mesosphere).
Lithosphere and Asthenosphere Detail
A close-up of the upper mechanical layers — the rigid lithosphere and the partially molten asthenosphere beneath it.
Blank Earth Layers Worksheet
An unlabeled cross-section with leader lines — print as a quiz or fill-in worksheet for class.
What does a layers of the earth diagram show?
A layers of the earth diagram is a labeled cross-section that shows Earth's internal structure from the surface to the center. A complete diagram identifies the two types of crust (thin oceanic crust and thicker continental crust), the mantle (which makes up about 84% of Earth's volume and includes the upper and lower mantle), the outer core (liquid iron and nickel that generates Earth's magnetic field), and the inner core (a solid iron ball at the very center). Diagrams often also show the mechanical layer classification — lithosphere, asthenosphere, mesosphere — which cuts across the compositional layers and matters most for understanding plate tectonics. This generator creates clear, labeled earth layers diagrams for earth science and geology classes.
The main layers of the earth
- Crust: Earth's outermost solid shell. Continental crust is 30–70 km thick, made of lighter granite-type rocks. Oceanic crust is only 5–10 km thick, made of denser basalt. The boundary between the crust and the mantle is called the Mohorovičić discontinuity (Moho).
- Upper mantle and asthenosphere: Directly below the crust. The rigid upper mantle plus the crust form the lithosphere — the tectonic plates. Below that is the asthenosphere, a partially molten layer that allows tectonic plates to move slowly over it.
- Lower mantle (mesosphere): From about 660 km to 2,900 km depth. Under extreme pressure the rock here is solid even though it is very hot, and it flows extremely slowly over millions of years.
- Outer core: From about 2,900 km to 5,150 km depth. This is liquid iron and nickel at temperatures of 4,000–5,000 °C. Convection currents in the outer core generate Earth's magnetic field.
- Inner core: From about 5,150 km to the center at 6,371 km. Despite temperatures of around 5,200 °C — similar to the surface of the Sun — the extreme pressure keeps iron solid. It rotates slightly faster than the rest of Earth.
Compositional layers vs mechanical layers
Earth's layers are classified two different ways, and many students encounter both systems in the same unit. The compositional classification divides Earth by what it is made of: crust (silicate rocks), mantle (silicate rocks with more iron and magnesium), and core (iron and nickel). The mechanical classification divides Earth by how the material behaves under stress: the lithosphere (rigid, includes crust and uppermost mantle), the asthenosphere (partially molten, flows slowly), the mesosphere (solid but slowly convecting lower mantle), and the outer and inner core. Both systems appear in earth science courses, and a well-labeled diagram of Earth's layers usually shows both sets of boundaries.
Depth, temperature, and state of each layer
- Crust: 0–5 km (oceanic) to 0–70 km (continental). Temperatures near 0 °C at the surface to about 300–500 °C at the Moho. Solid.
- Upper mantle / asthenosphere: 70–660 km. Temperatures roughly 300–3,000 °C. Mostly solid with a partially molten zone (asthenosphere) at about 100–350 km.
- Lower mantle: 660–2,900 km. Temperatures 3,000–4,000 °C. Solid under enormous pressure.
- Outer core: 2,900–5,150 km. Temperatures 4,000–5,000 °C. Liquid iron-nickel alloy.
- Inner core: 5,150–6,371 km. Temperature about 5,200 °C. Solid iron under extreme pressure.
Tips for a clear earth layers diagram
Choose the type of diagram you need: a fully labeled cross-section for study notes, a temperature-and-depth version for a more advanced geology class, a compositional-vs-mechanical comparison for students who need to understand both systems, a simplified version for younger students, or a blank worksheet for a quiz. Specify which labels you want — layer names, depth ranges, temperatures, state of matter — and how much detail is appropriate for your grade level. Generating a few variants and downloading the clearest one for your slides or handout takes only seconds.
Frequently Asked Questions
Related Earth Science Tools
 Earth Science
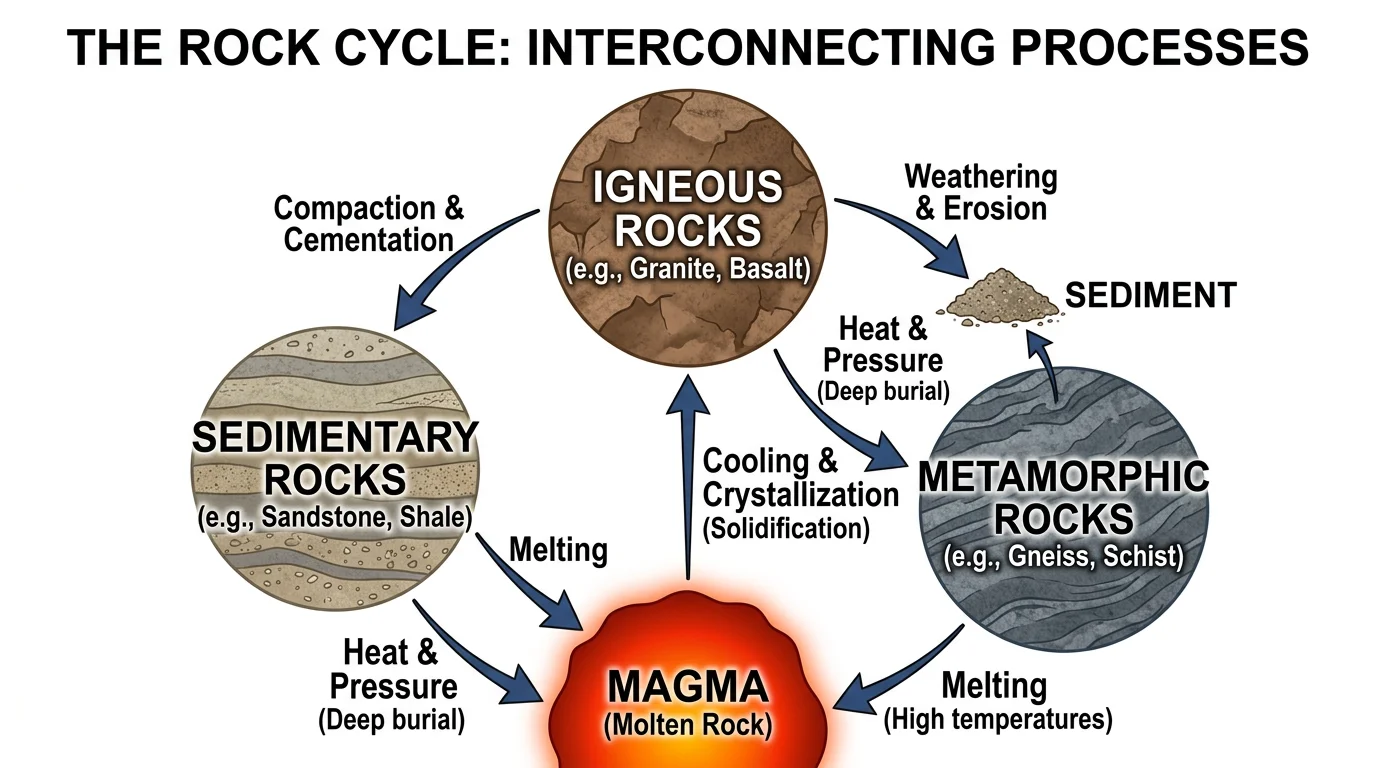
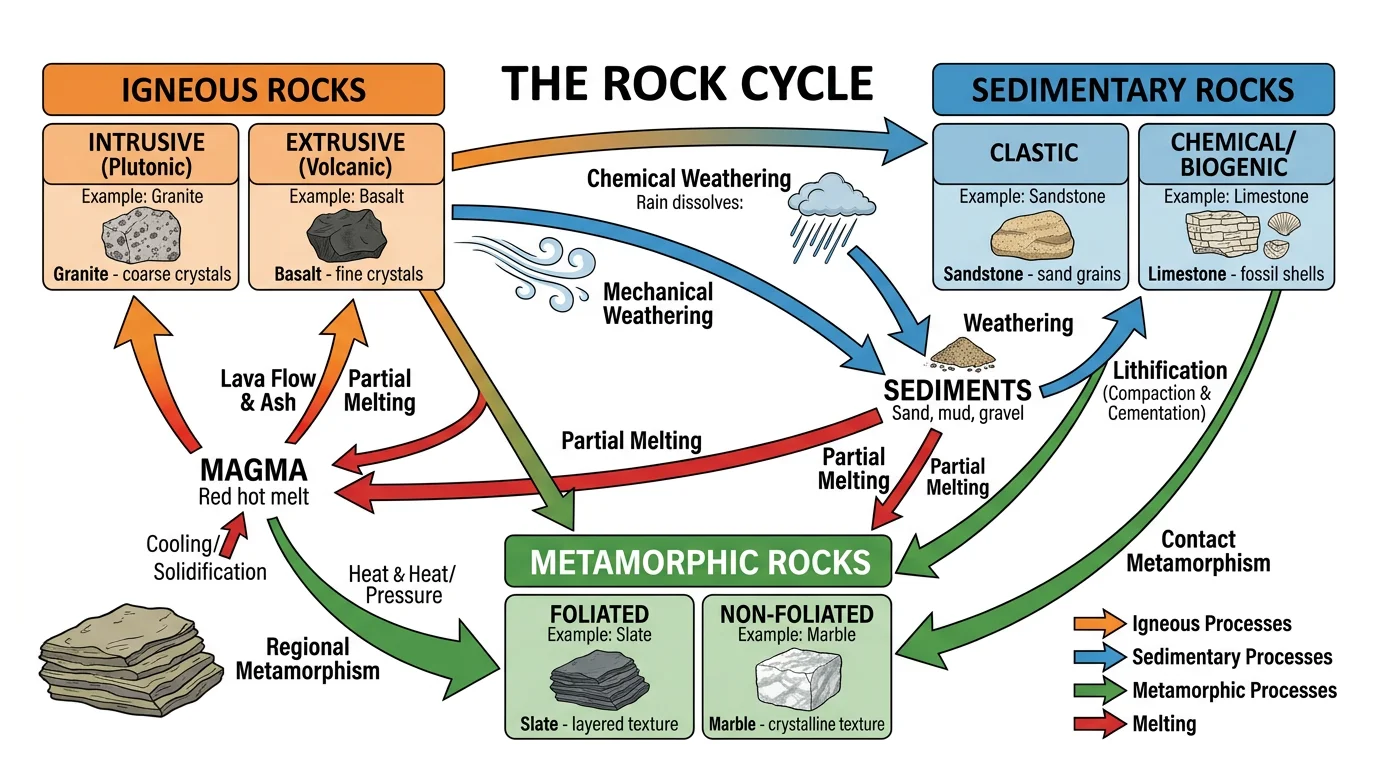
Rock Cycle Diagram Generator
Create labeled rock cycle diagrams showing igneous, sedimentary, and metamorphic rocks and the processes that connect them.
 Earth Science
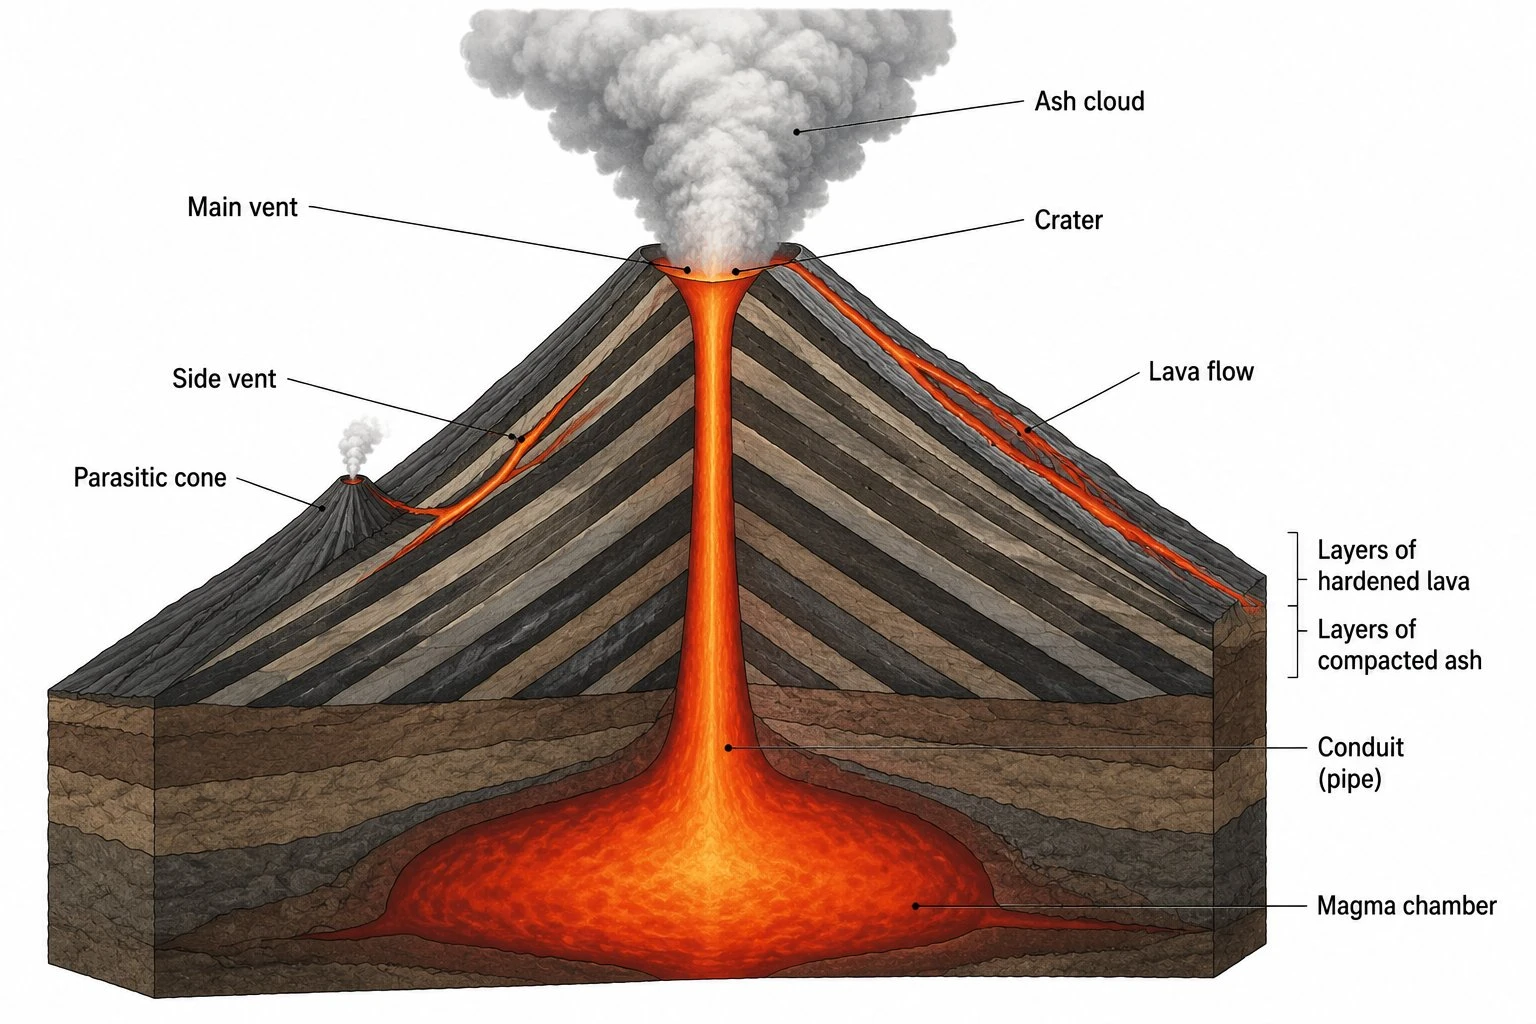
Volcano Diagram Generator
Generate labeled volcano diagrams showing the magma chamber, conduit, vent, crater, lava flows, and ash cloud — or compare shield, composite, and cinder cone types.
 Earth Science
Water Cycle Diagram Generator
Generate labeled water cycle diagrams covering evaporation, condensation, precipitation, and runoff for earth science class.