Hundreds Chart Generator Printable 1–100 Grid
Make a printable hundreds chart — a 10×10 grid of numbers 1 to 100. Skip count, highlight multiples or primes, or print a blank chart. Free SVG & PNG.
Number range
Hundreds Chart Examples
Common ways to build and shade a 1–100 number grid
Labeled Hundreds Chart
A clean 10×10 hundreds chart with the numbers 1 to 100 in order.
Count by 5s
A hundreds chart with the multiples of 5 shaded to show skip counting.
Prime Numbers
A hundreds chart with the prime numbers from 1 to 100 highlighted.
Even and Odd
A hundreds chart with even and odd numbers tinted in two shades.
Blank Hundreds Chart
A blank 10×10 grid for filling in the numbers 1 to 100 by hand.
Hundreds Chart 0–99
The 0–99 variant, useful for place value and counting from zero.
What is a hundreds chart?
A hundreds chart is a 10×10 grid that holds the numbers 1 to 100 in order — the first row runs 1 to 10, the second row 11 to 20, and so on down to 91–100 in the bottom row. Because the numbers are arranged in a fixed, predictable layout, the chart turns counting into a visual pattern: move one cell to the right to add one, and move straight down to add ten. That simple structure makes a hundreds chart one of the most versatile tools in early math, used for counting, skip counting, place value, addition and subtraction strategies, and spotting number patterns. This generator draws the grid exactly, so every number sits in its correct place whether you print the standard 1–100 chart or the 0–99 variant.
Skip counting and multiples
- Choose a number in the "Highlight multiples of" menu and every multiple of it is shaded, turning skip counting into a picture. Shade the 5s and a student sees 5, 10, 15, 20 marching down two neat columns; shade the 10s and the whole last column lights up.
- These shaded patterns are how children first meet times tables without memorizing anything. The 2s reveal every even number, the 3s trace a gentle diagonal stripe, and the 9s slope from the top-right toward the bottom-left — each table has its own signature shape on the grid.
- Comparing two tables is just as useful: shade the 4s one day and the 6s the next, and learners start to notice the numbers both tables share, an early, hands-on route into common multiples.
Even and odd numbers
- Turn on even/odd coloring and the chart splits into two tinted sets, so the alternating stripe of even and odd numbers becomes obvious at a glance. Every column ends in the same digit, which makes the pattern easy to name: columns ending in 0, 2, 4, 6, and 8 are even, and the rest are odd.
- Seeing evens and odds laid out this way helps students generalize the rule — a number is even when its last digit is even — instead of checking each number one at a time.
- It also sets up later work on doubling, halving, and the idea that even plus even stays even while even plus odd turns odd.
Prime numbers on a hundreds chart
- Switch on "Highlight prime numbers" to mark every prime from 1 to 100 — 2, 3, 5, 7, 11, 13, and the rest, twenty-five in all. Because the tool tests each number exactly, the primes are always correct, and 1 is left unshaded since it is not prime.
- A hundreds chart is the classic home of the Sieve of Eratosthenes: cross out the multiples of 2, then 3, then 5, then 7, and whatever survives is prime. The highlighted view shows the finished sieve so students can compare their own work against it.
- The pattern also reveals that, apart from 2 and 5, primes only ever end in 1, 3, 7, or 9 — a neat consequence of how our base-ten number system works.
Blank charts for practice
- Turn on "Blank chart" to keep the 10×10 grid but drop the numbers, giving students an empty frame to fill in themselves. Writing the numbers 1 to 100 by hand builds counting fluency and cements the tens-and-ones structure far better than reading a finished chart.
- Blank grids double as game boards and mystery-number puzzles: cover a few cells and ask what belongs there, or call out moves like "start at 34, jump down two rows and left one" to practice adding and subtracting tens and ones.
- Everything renders in your browser and exports as a crisp SVG or a high-resolution PNG, so the charts print sharply on any paper size and drop cleanly into worksheets and slides.
Frequently Asked Questions
Related Math Tools
 Education
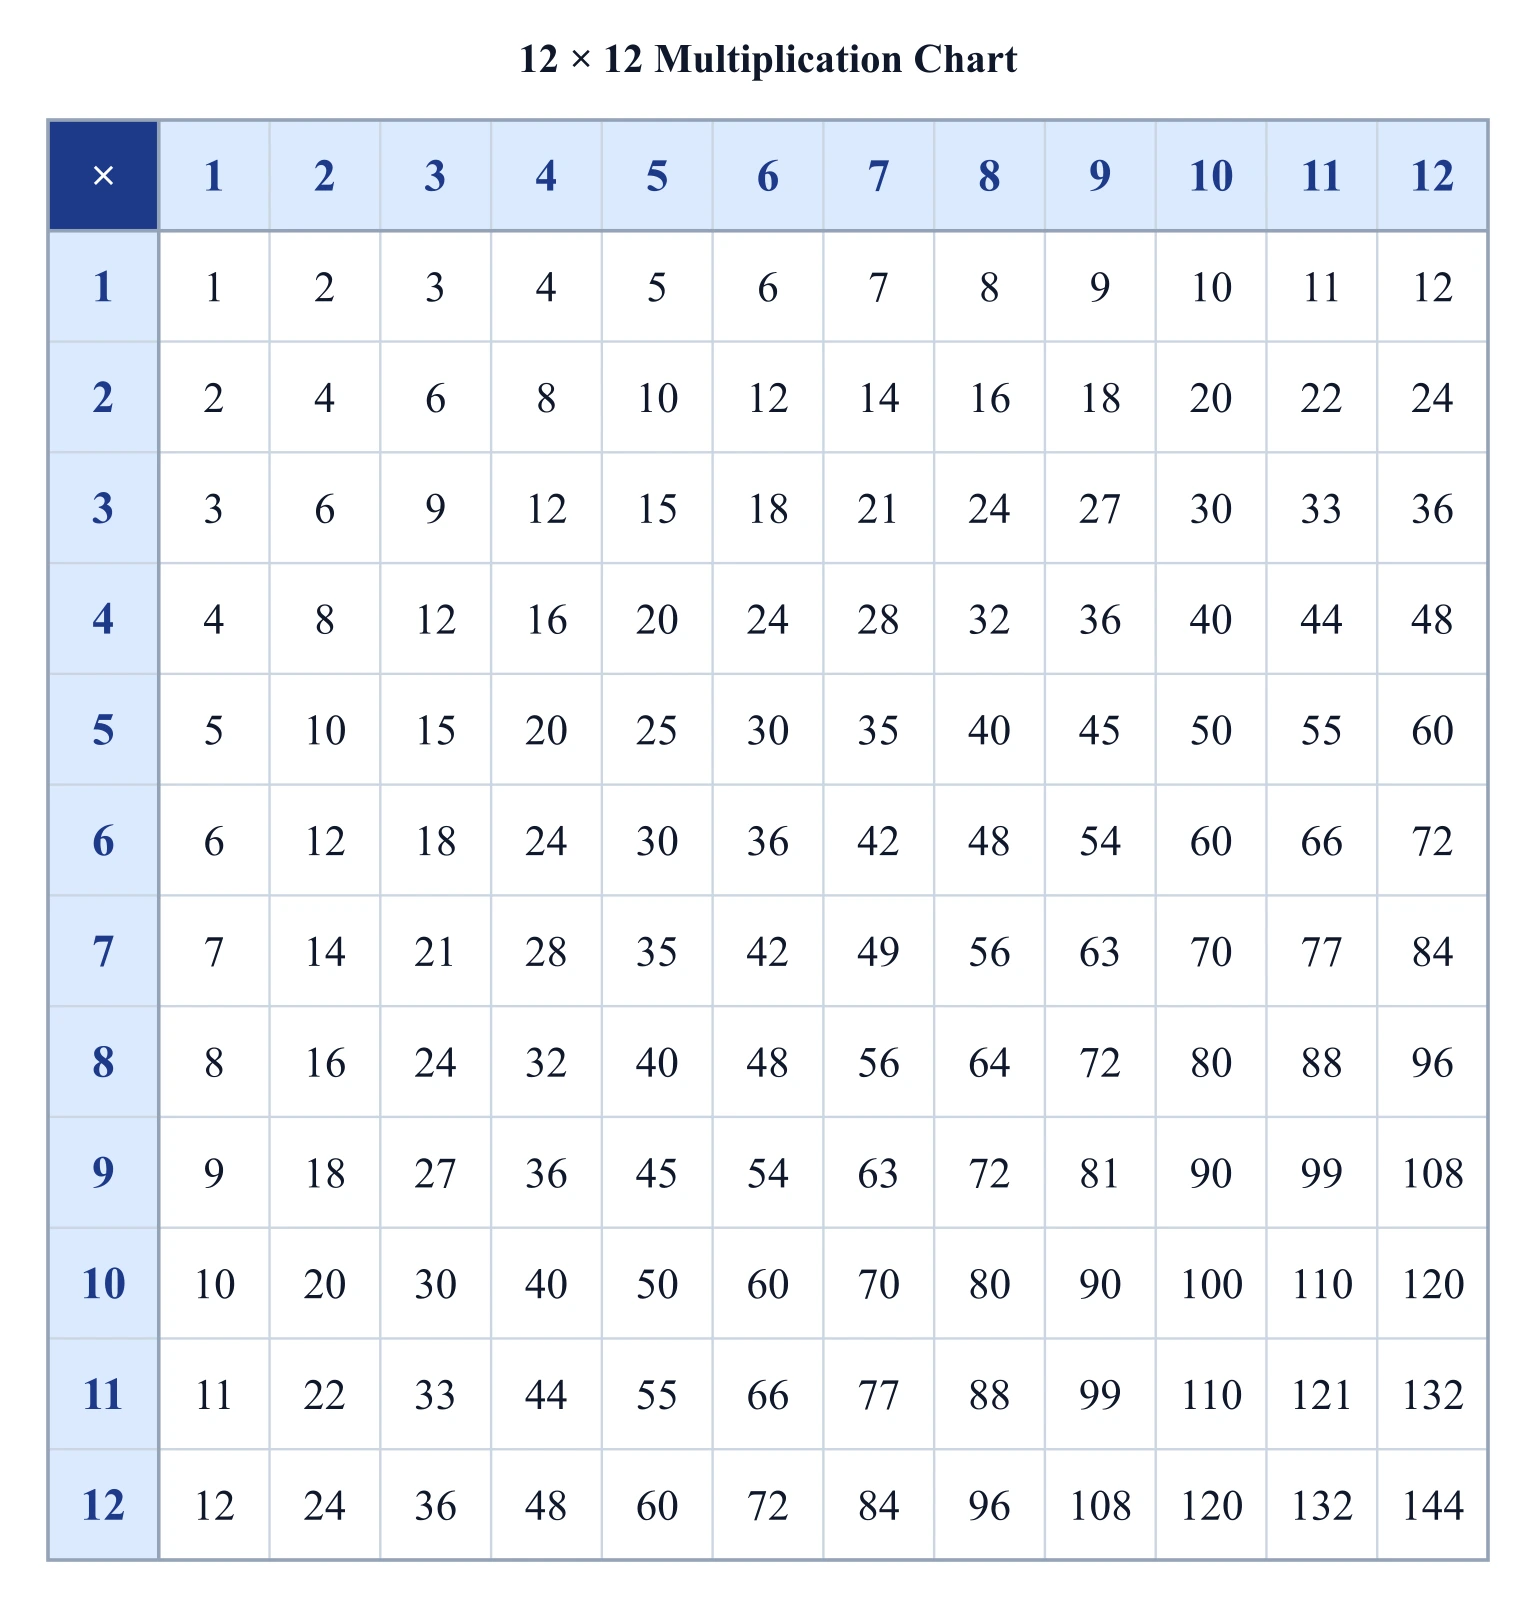
Multiplication Chart Generator
Create a printable multiplication chart: pick the grid size, highlight any times table, and export a clean SVG or PNG.
 Education
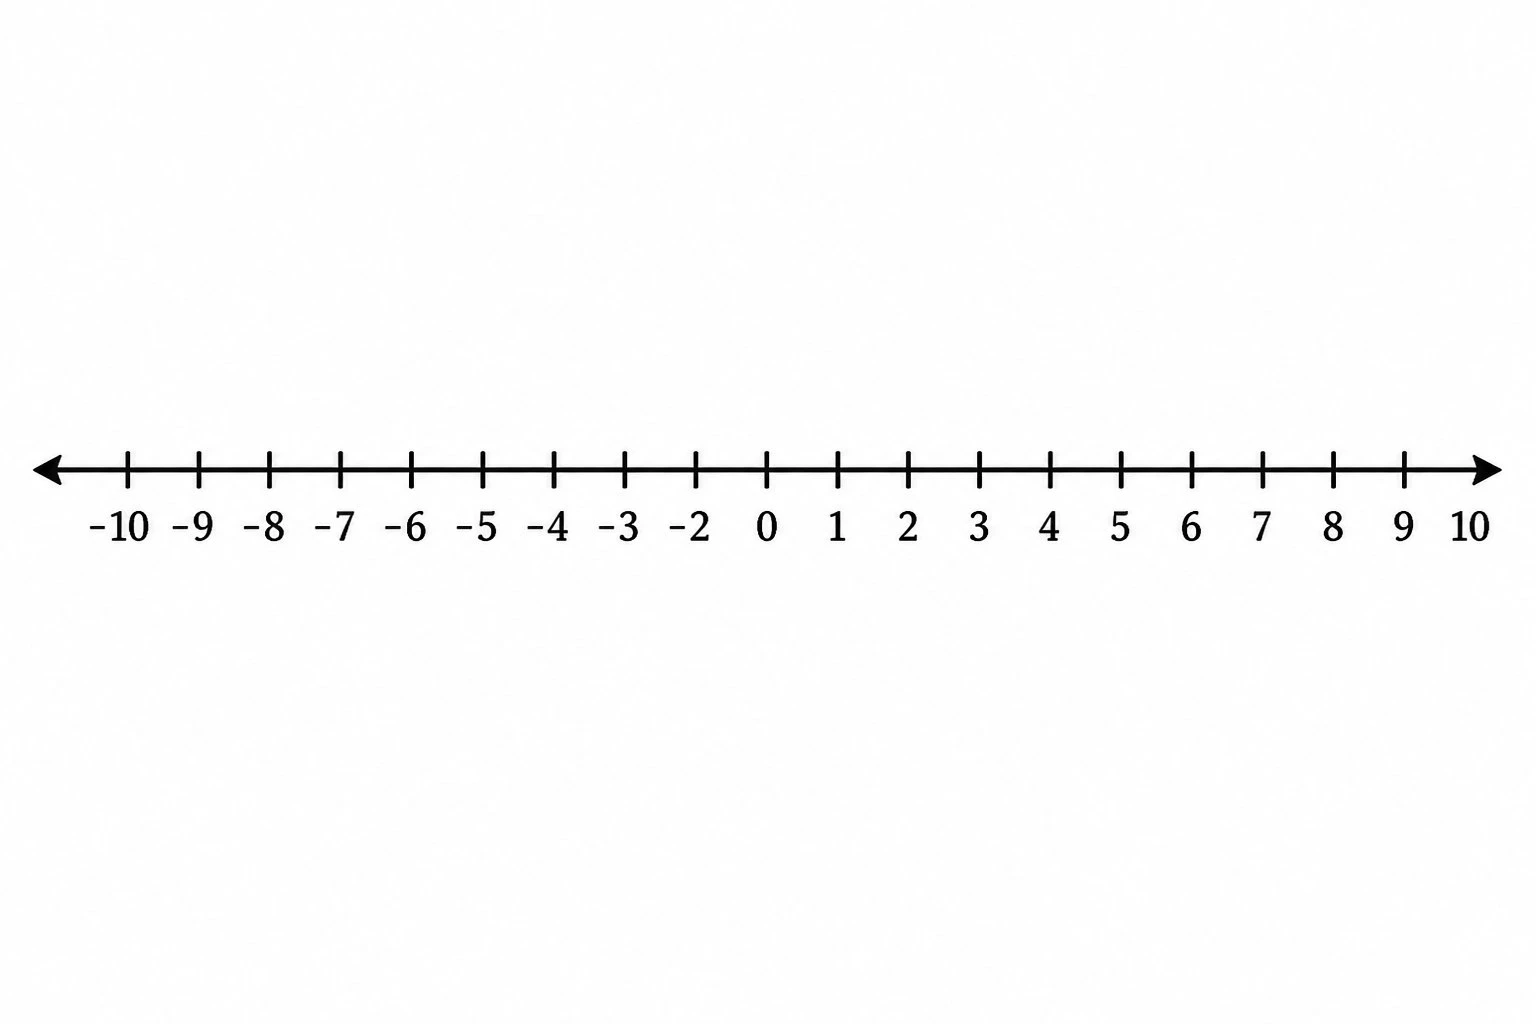
Number Line Generator
Create precise number lines: plot points, graph inequalities and intervals, and mark fractions or decimals.
 Education
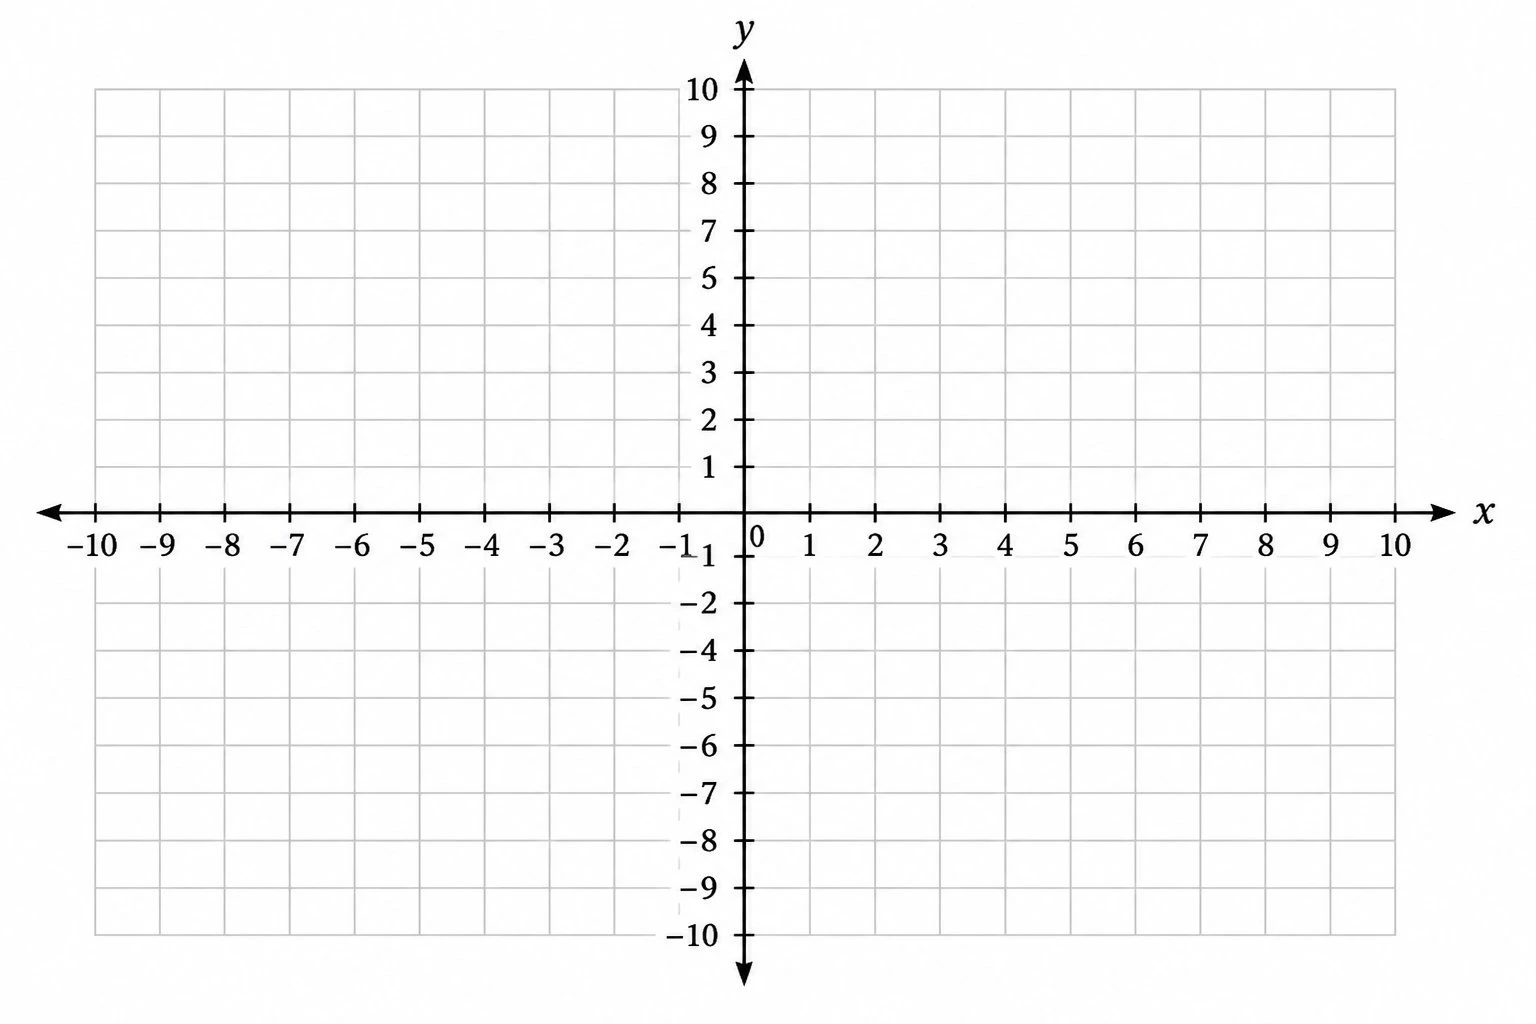
Coordinate Plane Generator
Create clean, printable Cartesian planes: plot ordered pairs, graph lines by slope and intercept, and label the four quadrants.