
How to Create a Vector Image: A Complete Guide for Beginners and Researchers
Learn how to create vector images using Inkscape, Adobe Illustrator, and AI tools. Complete guide covering SVG format, tracing raster images, scientific illustration, and best practices.
A vector image is a graphic built from mathematical equations — lines, curves, and shapes defined by coordinates and formulas — rather than a fixed grid of pixels. The result is an image that can be scaled from postage-stamp size to billboard dimensions without losing a single pixel of sharpness.
This property makes vector images indispensable in scientific publishing, logo design, technical illustration, and any context where images will be reproduced at multiple sizes or in print. This guide covers everything you need to create vector images from scratch: what they are, which tools to use, when to trace raster images into vectors, and how to optimize the result for publication.
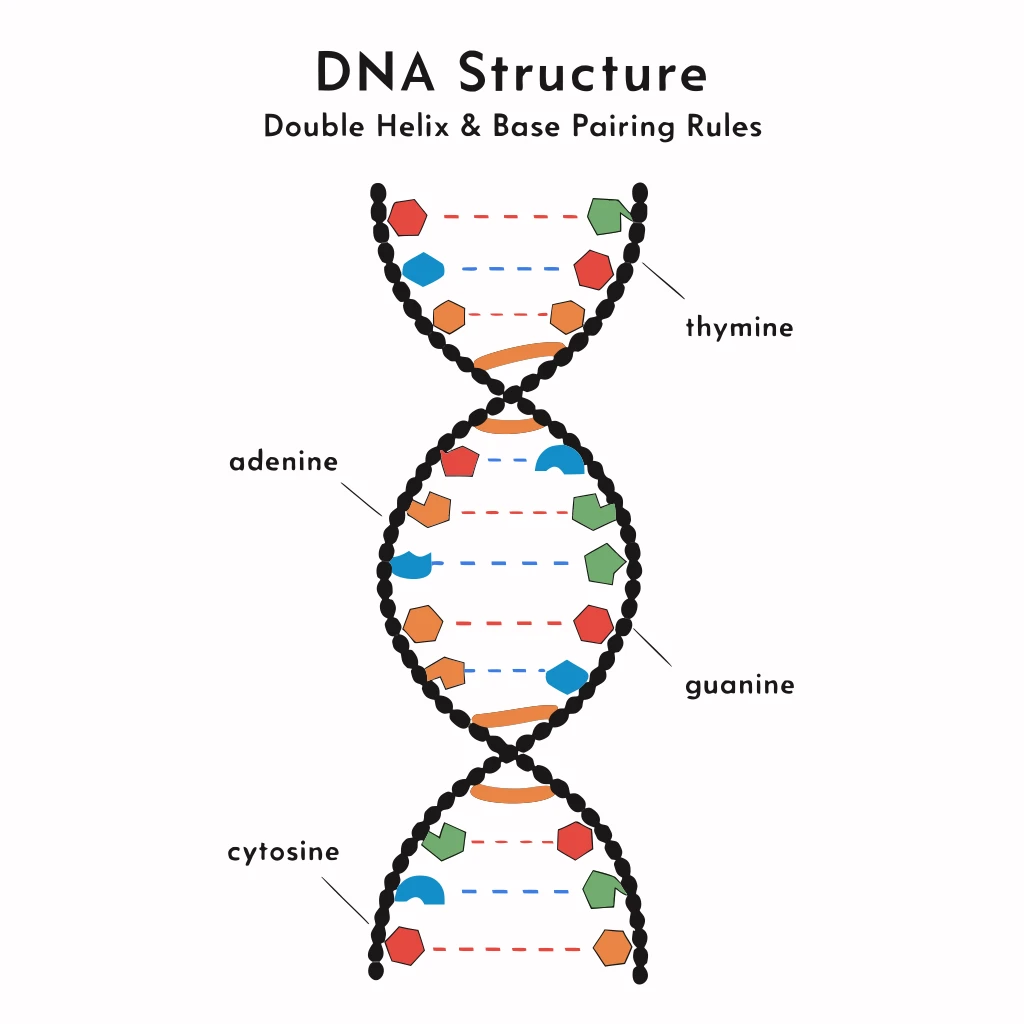
Image to SVG Converter
Convert raster images (PNG, JPG, WebP) to clean SVG vector graphics with AI-powered tracing.
Try it free →What Is a Vector Image?
A vector image stores graphic data as a set of mathematical instructions: "draw a curve from point A to point B with this curvature and this color." Compare this to a raster image (JPEG, PNG, BMP), which stores the color value of every individual pixel in a grid.
The key difference in practice:
| Property | Vector Image | Raster Image |
|---|---|---|
| Scalability | Infinite — no quality loss at any size | Fixed — blurs and pixelates when enlarged |
| File size | Small for simple shapes; grows with complexity | Grows with pixel dimensions |
| Best for | Logos, diagrams, illustrations, icons, text | Photographs, complex textures, screenshots |
| Formats | SVG, AI, EPS, PDF | PNG, JPEG, WebP, GIF, TIFF |
| Editability | Fully editable — shapes, colors, paths | Pixel-level editing only |
For scientific and academic work specifically, vector graphics are strongly preferred for figures submitted to journals. Nature, Science, Cell, and most high-impact journals require figures at 300–600 DPI minimum. Vector figures are resolution-independent by definition and will print at any quality without re-export.
Vector Image Formats Explained
SVG (Scalable Vector Graphics)
SVG is the web standard for vector graphics — a W3C-defined XML format supported natively by all modern browsers. According to Adobe's SVG format guide, SVG files can be styled with CSS, animated with JavaScript, and embedded directly into HTML pages. For web use, SVG is almost always the right choice.
AI (Adobe Illustrator)
The native format of Adobe Illustrator. Preserves all layer, artboard, and effect information from an Illustrator project. Not universally readable without Illustrator or compatible software.
EPS (Encapsulated PostScript)
A legacy vector format widely used in professional printing. Most scientific journals that accept vector figures accept EPS. Inkscape, Illustrator, and CorelDRAW can all export EPS.
PDF (Portable Document Format)
PDF can embed vector graphics with full fidelity. LaTeX-generated figures exported as PDF are inherently vector-based and are accepted by virtually all scientific journals.
Tools for Creating Vector Images
Free and Open-Source
Inkscape (inkscape.org) is the leading free, open-source vector graphics editor. It uses SVG as its native format and supports import/export to EPS, PDF, and AI. Inkscape's built-in bitmap tracing tool (Path > Trace Bitmap) can convert raster images to vector paths automatically.
For beginners, the official Inkscape tutorials cover the Pen tool, shape tools, node editing, and text — the four things you'll use for 90% of scientific diagrams.
draw.io / diagrams.net is a free browser-based tool that produces SVG diagrams for flowcharts, network diagrams, and technical schematics. Not a full illustration tool, but excellent for structured vector diagrams without any drawing skill required.
Professional Tools
Adobe Illustrator is the industry-standard vector graphics application. Its Pen tool, Live Trace (image tracing), and extensive symbol libraries make it the fastest professional tool for complex illustration work. Subscription-based at approximately $21/month as a standalone app.
Affinity Designer is a one-time-purchase alternative to Illustrator ($70 desktop, $20 iPad) with strong SVG export and a fully capable Pen tool. Many scientific illustrators use Affinity Designer as a more affordable alternative that doesn't require ongoing subscription fees.
AI-Powered Tools
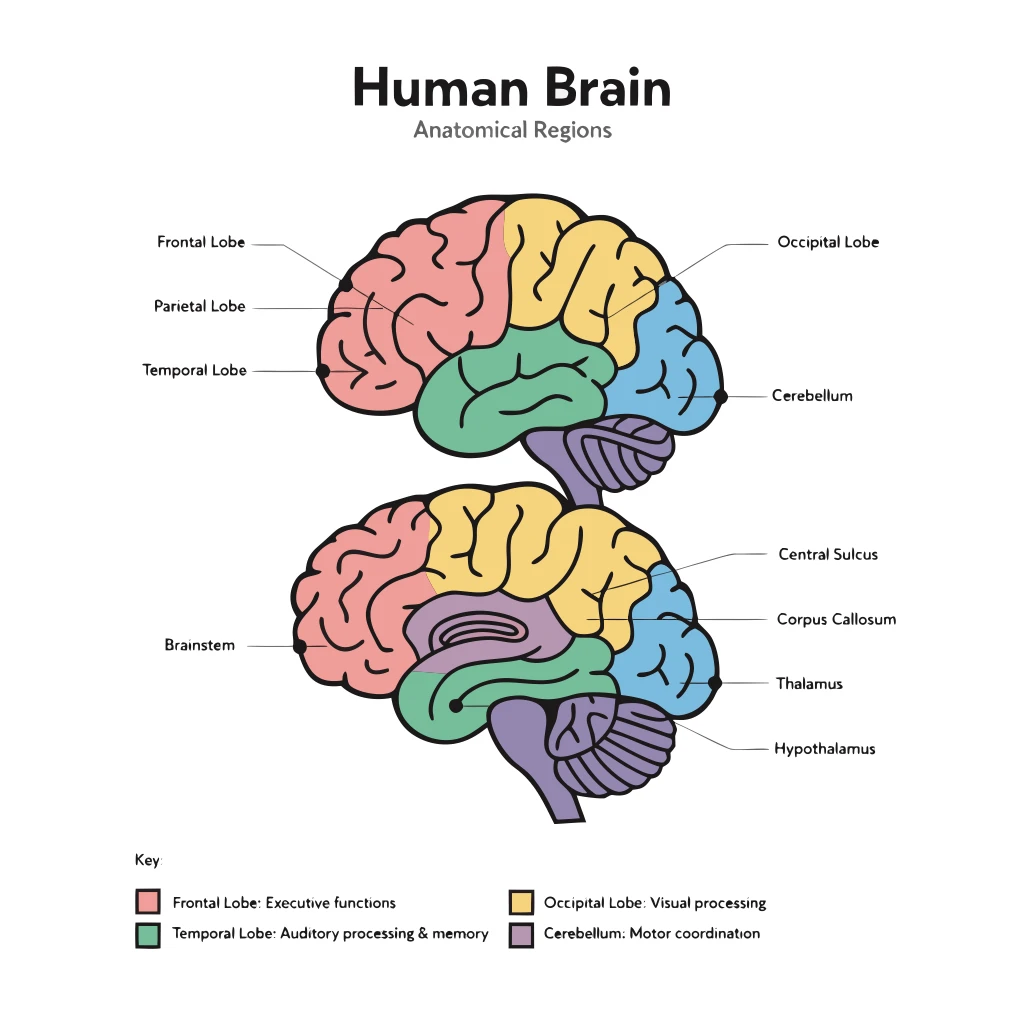
Image to SVG Converter
Convert PNG or JPG scientific diagrams and logos to clean, scalable SVG with AI-powered auto-tracing.
Science Drawing Generator
Create publication-ready scientific illustrations and diagrams from text descriptions.
Vector Magic (vectormagic.com) specializes in bitmap-to-vector conversion using a more sophisticated algorithm than most built-in trace tools. Useful when you need to convert a raster logo or illustration to a clean vector with minimal manual cleanup.
Step-by-Step: Creating a Vector Image from Scratch in Inkscape
Inkscape is free, runs on Windows, Mac, and Linux, and is capable enough for publication-quality scientific illustration. Here is the workflow:
Step 1: Set up the document
Open Inkscape and set the document size:
- File > Document Properties
- Set dimensions in mm or inches to match your target output (e.g., a single journal column is typically 85mm wide)
- Set the DPI to 300 (for print) or 96 (for screen/web)
Step 2: Use the Pen tool for precise shapes
The Pen tool (shortcut: P in Inkscape) is the foundation of vector drawing. Click to place anchor points; click and drag to create curved segments. This produces Bézier curves — the same mathematical curves used to define smooth shapes in all vector formats.
Key Pen tool actions:
- Click: place a corner anchor point (sharp angle)
- Click + drag: place a smooth anchor point with curve handles
- Press Enter to finish a path; press Escape to cancel
The Inkscape official Basic tutorial covers the Pen and Bézier tools in detail with illustrated examples.
Step 3: Use Shape tools for geometric elements
For rectangles, circles, polygons, and stars, use the dedicated shape tools (Rectangle: R, Ellipse/Circle: E, Star: *). Hold Shift while drawing to constrain proportions. These shapes are parametrically defined — you can adjust corner radius, number of sides, etc. after drawing.
Step 4: Add and style text
The Text tool (T) places text as a vector element. For publication figures, always convert text to paths before export:
- Select all text
- Path > Object to Path This embeds the glyph shapes into the file so the correct font renders even on systems without it installed.
Step 5: Apply fills and strokes
Select any shape and use the Fill and Stroke dialog (Shift+Ctrl+F) to:
- Set fill color (solid, linear gradient, radial gradient, pattern, or none)
- Set stroke color and width
- Adjust stroke style (dash pattern, line cap, line join)
For scientific figures, use a consistent, colorblind-accessible palette. The Okabe-Ito palette is widely recommended in academic publishing.
Step 6: Organize with layers
Complex figures should use layers (Layer > Add Layer). Typical layer organization for a scientific diagram:
- Background elements (grid, axes)
- Main structural shapes
- Labels and annotations
- Callout arrows
Lock layers you're not editing to avoid accidentally moving elements.
Step 7: Export
- For web/HTML: File > Export PNG Image (raster), or File > Save As > SVG
- For print/journal submission: File > Save As > Encapsulated PostScript (EPS) or PDF
- For LaTeX: Export as PDF and include with
\includegraphics
How to Convert a Raster Image to Vector (Image Tracing)
Converting an existing raster image (photograph, scan, or bitmap logo) to a vector representation is called vectorization or image tracing. This is useful when you:
- Need to scale a bitmap logo without quality loss
- Want to create an editable version of a scanned hand-drawn diagram
- Need to convert a PNG scientific figure to an SVG for web use
An original raster image of a DNA structure diagram — suitable for tracing to SVG for publication or web use.
Method 1: Inkscape Trace Bitmap
- Import the raster image into Inkscape (File > Import)
- Select the image
- Path > Trace Bitmap (Shift+Alt+B)
- Choose a tracing algorithm:
- Brightness cutoff: works for simple black-and-white line art
- Edge detection: captures outlines of shapes
- Color quantization: converts a multi-color image to a limited-palette vector
- Adjust the threshold and click OK to preview the trace
- The traced vector path appears on top of the original raster; delete the raster layer
Method 2: AI-Powered Auto-Tracing
For more complex images, AI-powered tracing tools produce significantly cleaner results than algorithmic trace functions. ConceptViz's Image to SVG Converter uses AI to intelligently separate foreground and background, reconstruct curves, and produce an SVG that maintains the visual fidelity of the original without excessive anchor points.
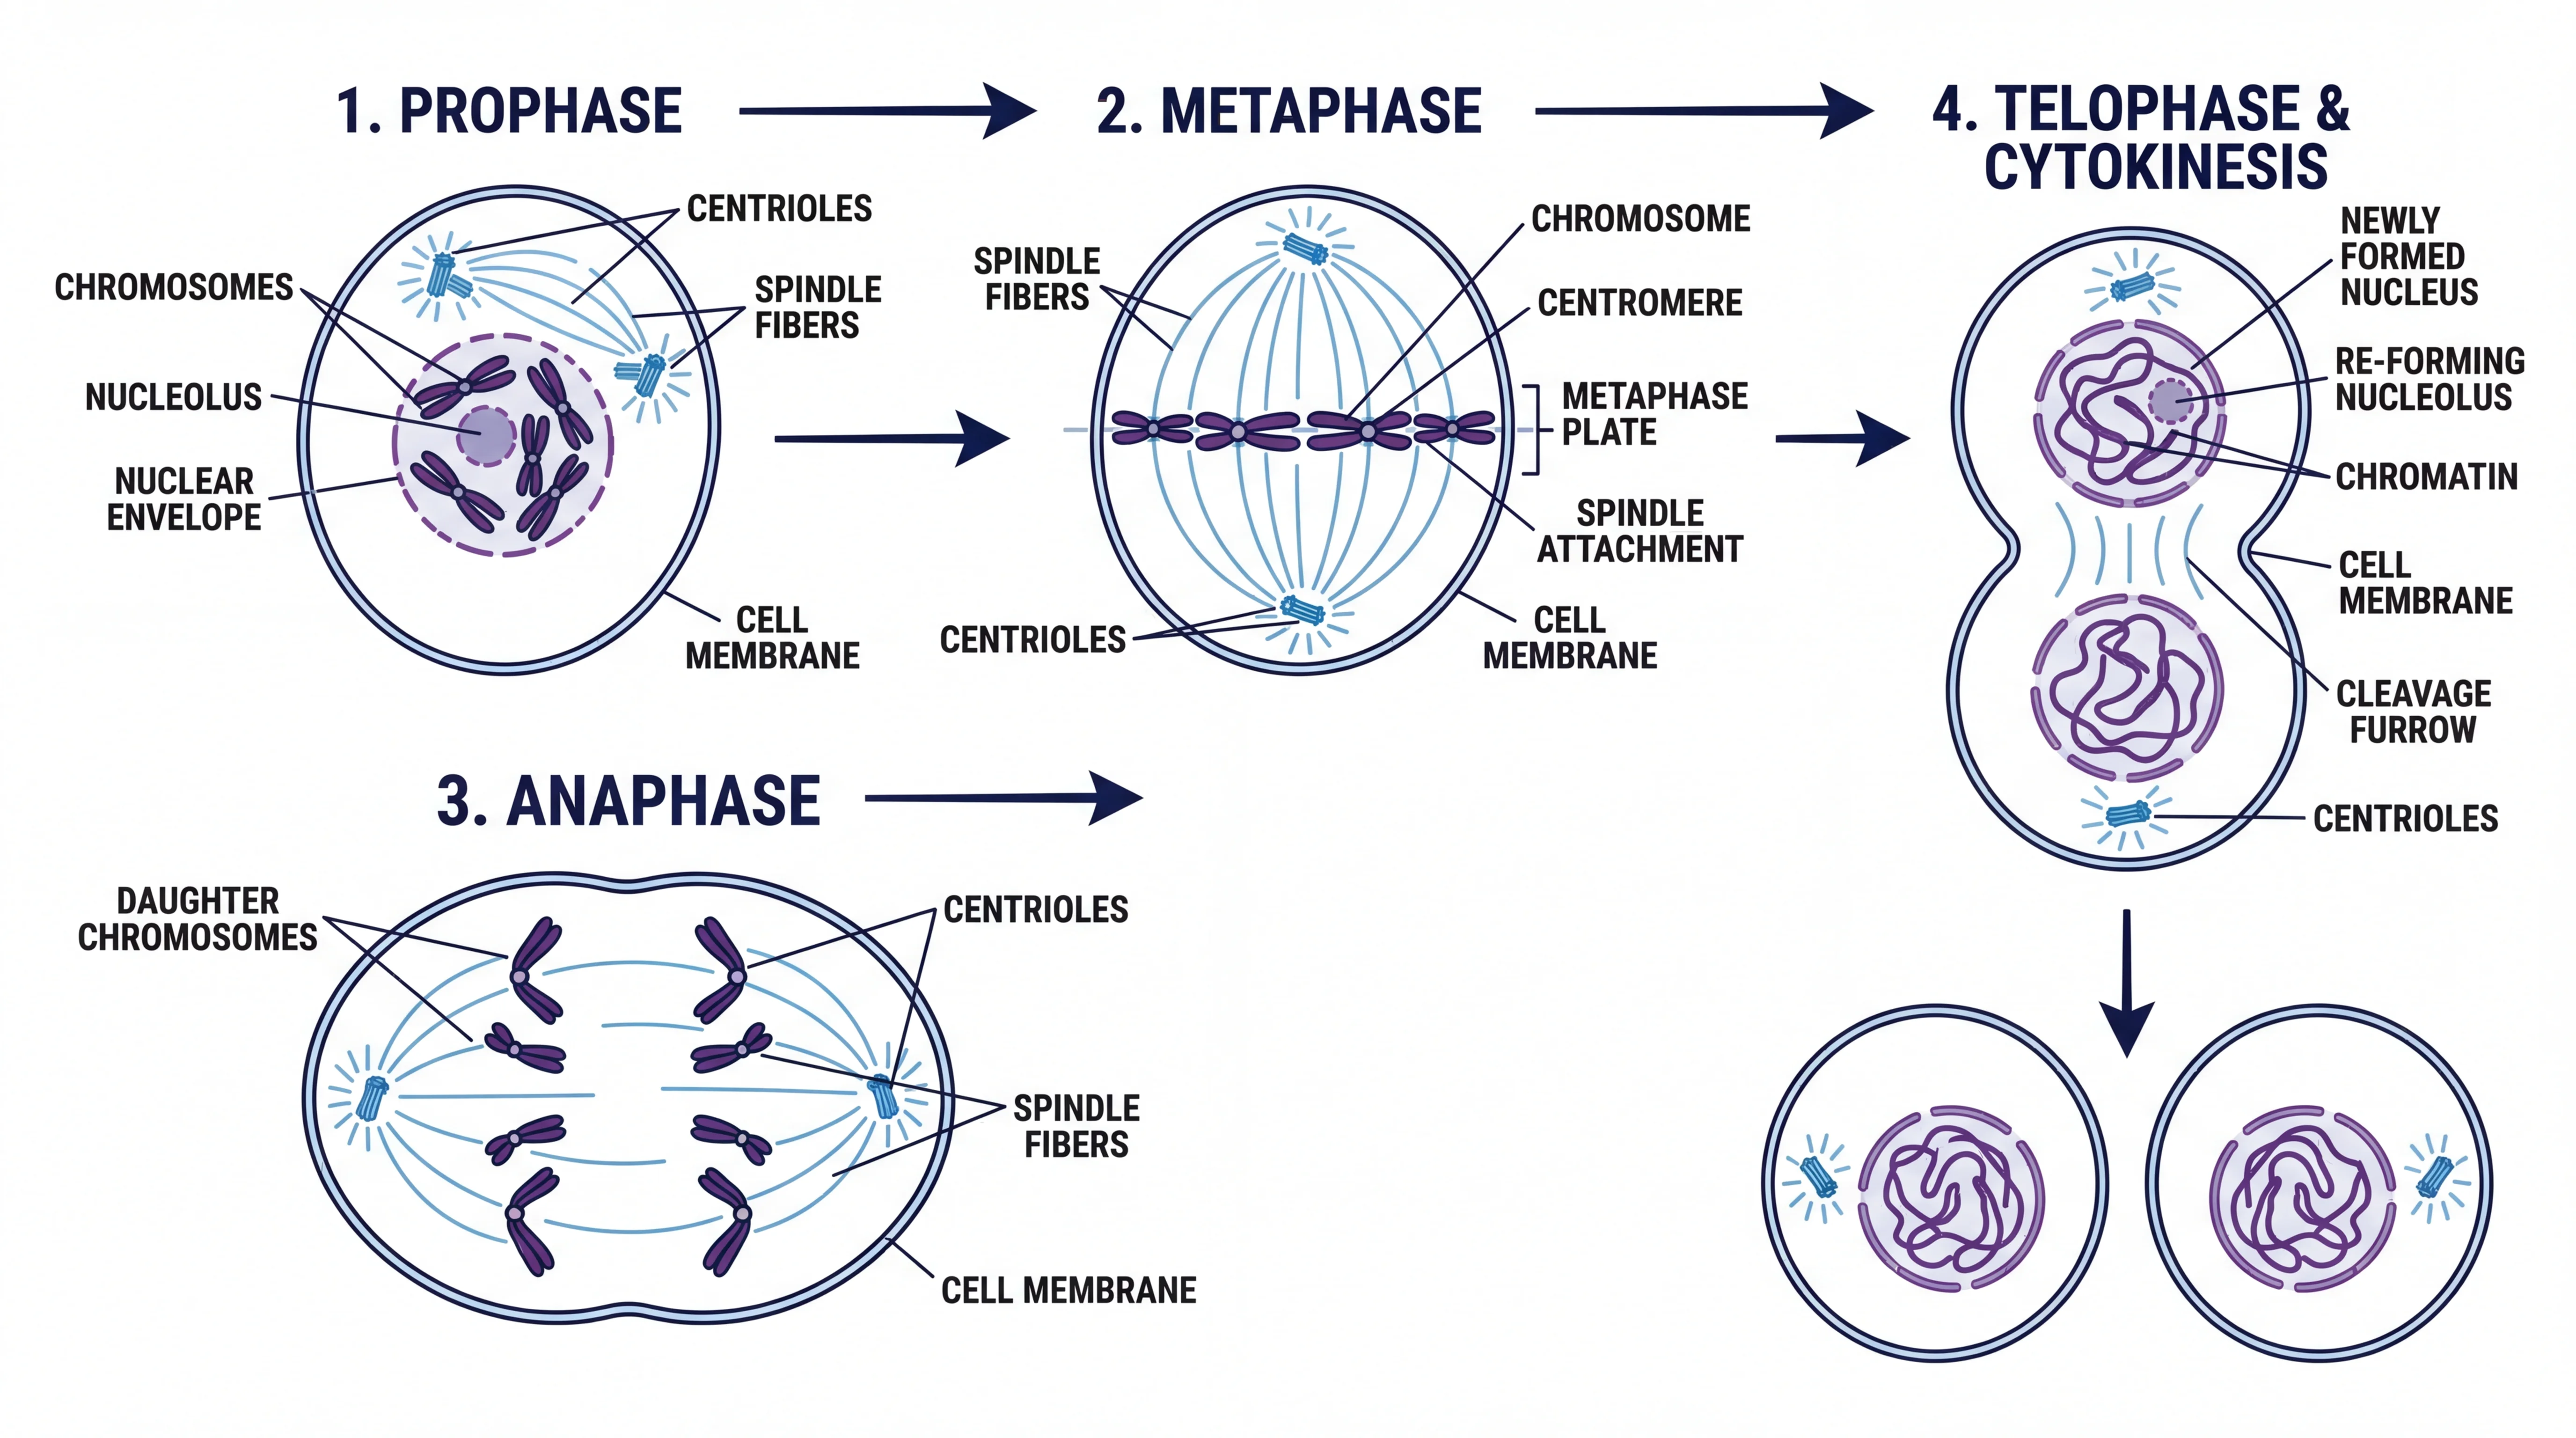
A complex biological diagram suitable for AI-assisted vectorization — manual tracing would require hours of node editing.
What Vectorization Cannot Do Well
Vectorization works best on:
- Logos and icons with flat colors and defined edges
- Line art and technical diagrams with clear contours
- Simple illustrations with limited color count
It works poorly on:
- Photographs with continuous tonal variation
- Images with complex textures, gradients, or depth-of-field effects
- Screenshots with fine text and anti-aliasing
For photographs and complex imagery, keep the raster format and ensure adequate DPI for your output size (300 DPI for print).
Vector Images for Scientific Research
Scientists and researchers use vector graphics in several specific contexts:
Journal Figures
High-impact journals consistently require vector figure submissions or raster figures at minimum 300 DPI. The journal submission guidelines for Nature state that figures should be in TIFF or EPS format at 300 DPI for halftones and 1000 DPI for line art — and EPS is a vector format that sidesteps the resolution problem entirely.
The scientific illustration guide covers the specific requirements for figures in Nature, Science, and Cell, including color space (CMYK vs. sRGB) and maximum file size constraints.
Scientific Posters
Conference posters are printed at large format (A0, 90×120cm) — at these sizes, any raster element below 300 DPI will appear pixelated. Using vector graphics for diagrams, charts, and text ensures the poster prints crisply regardless of zoom level.
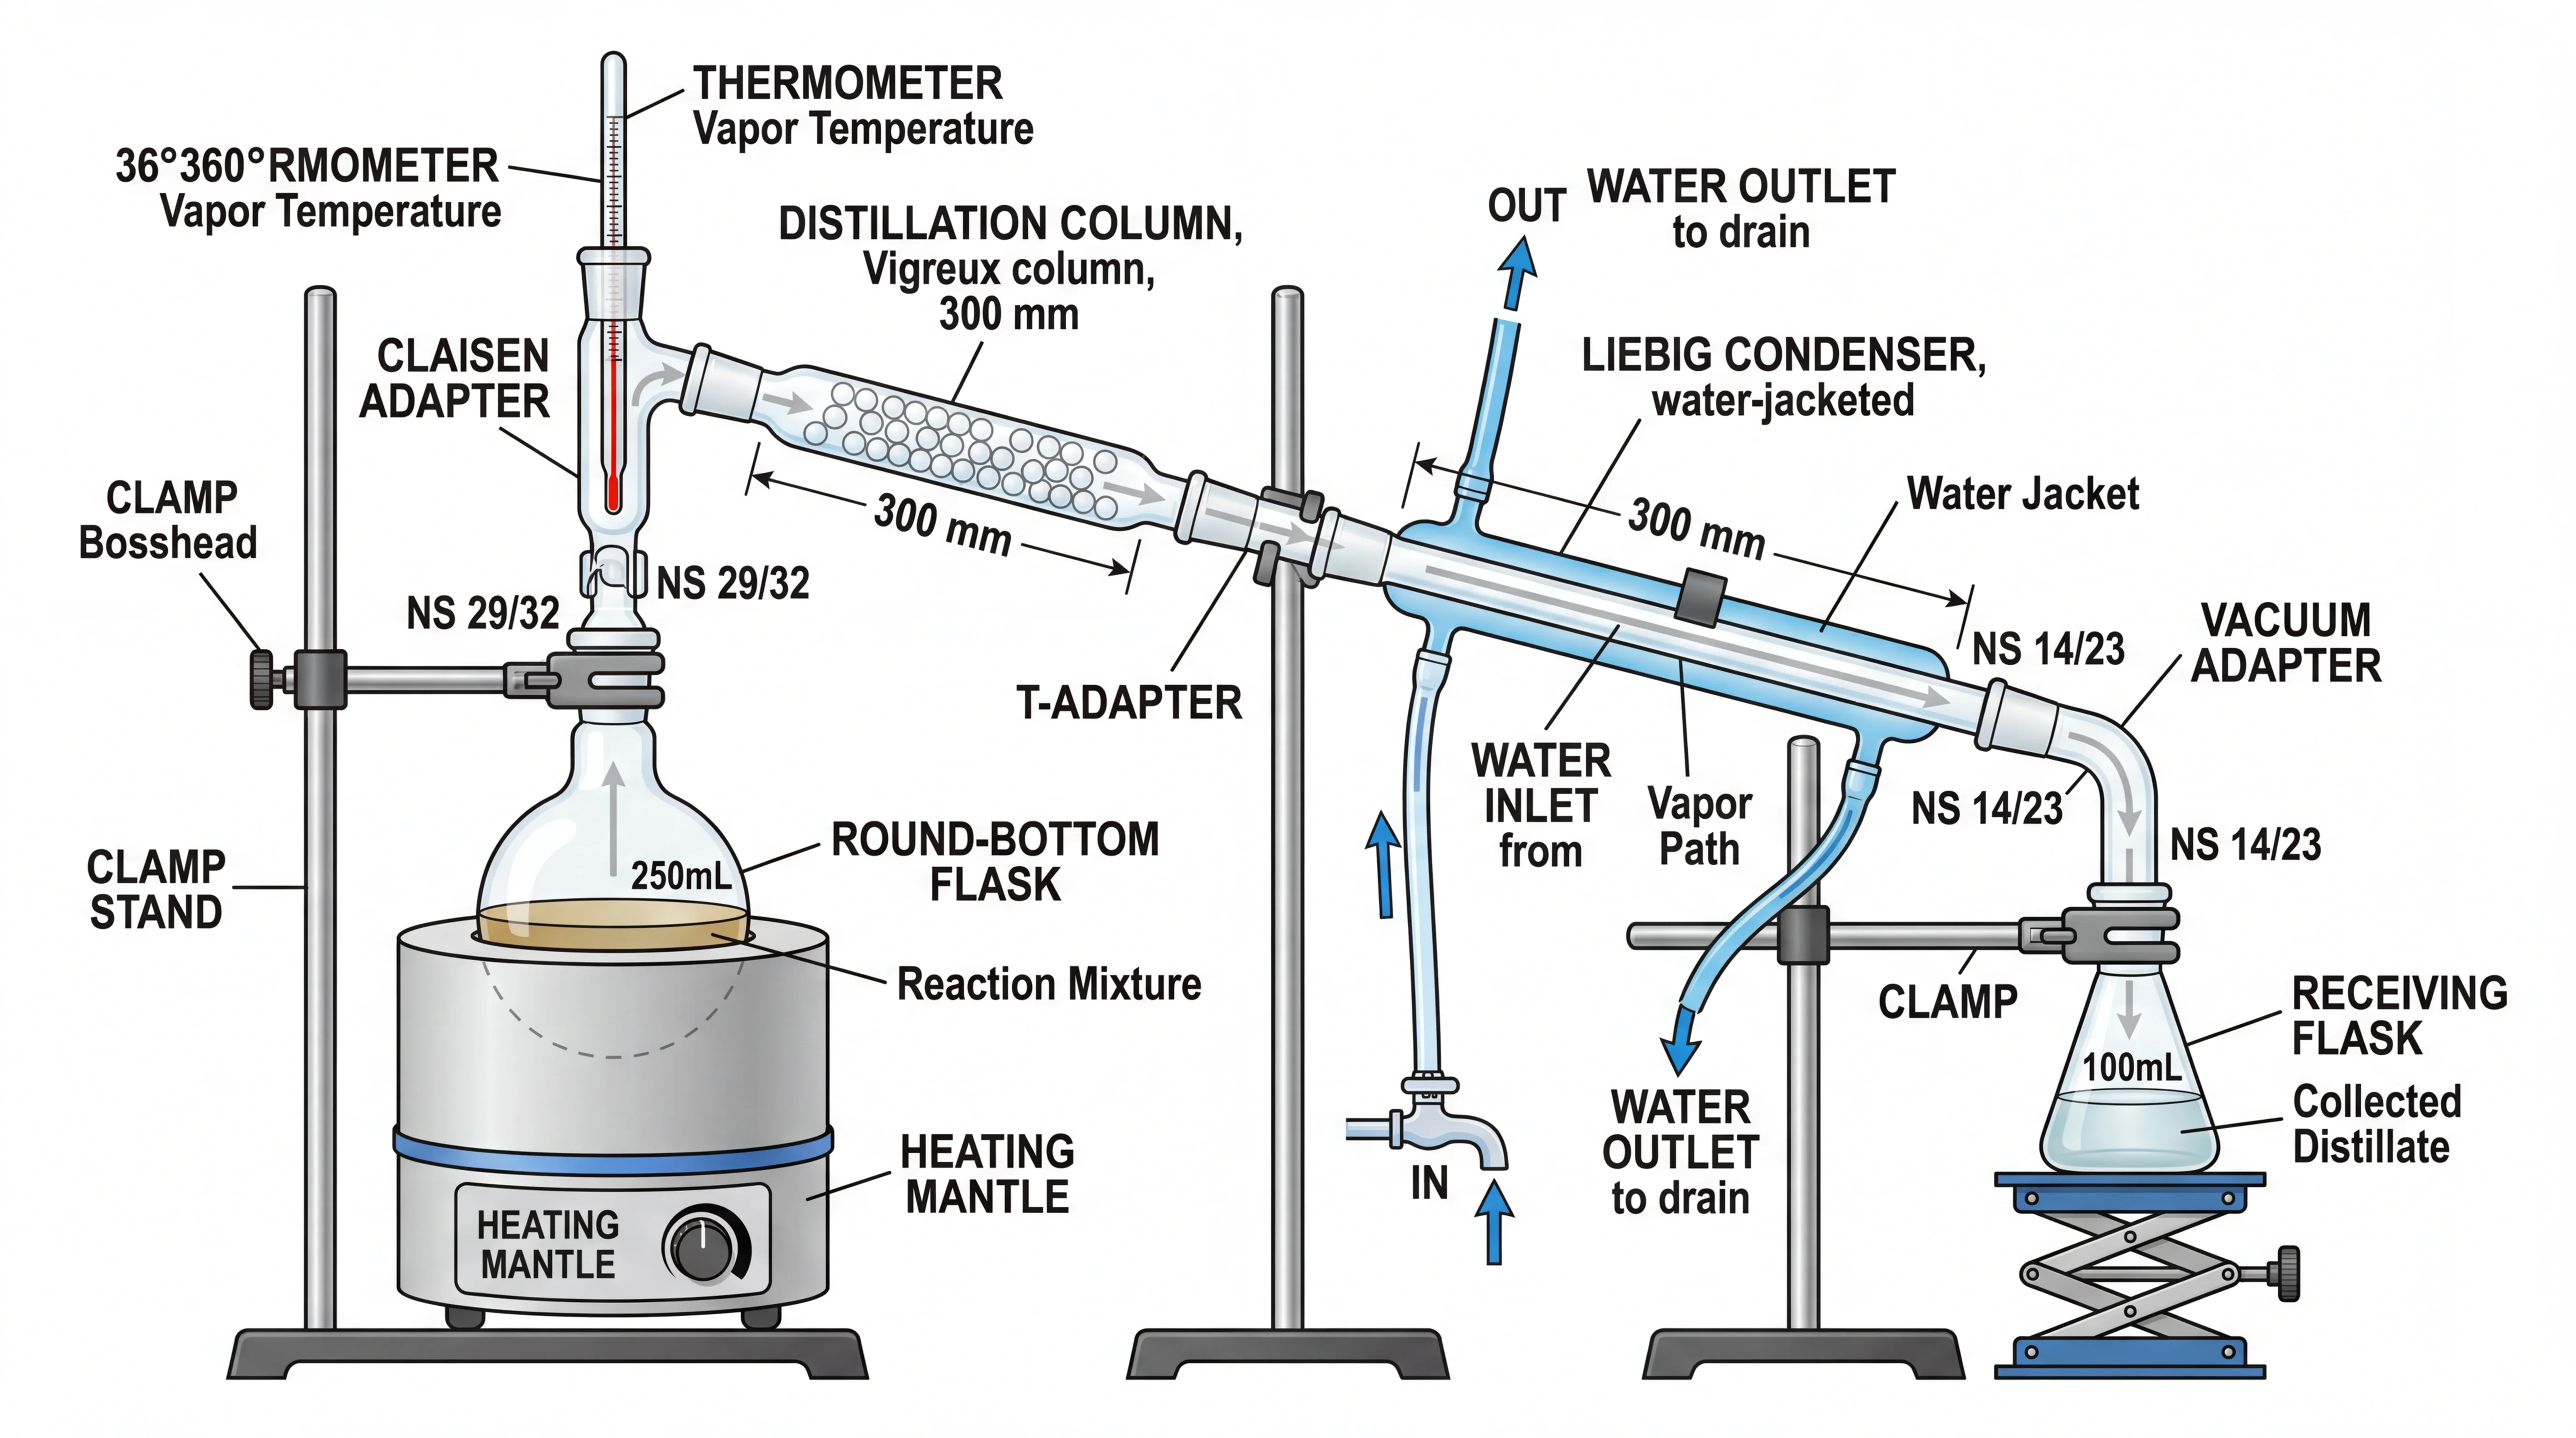
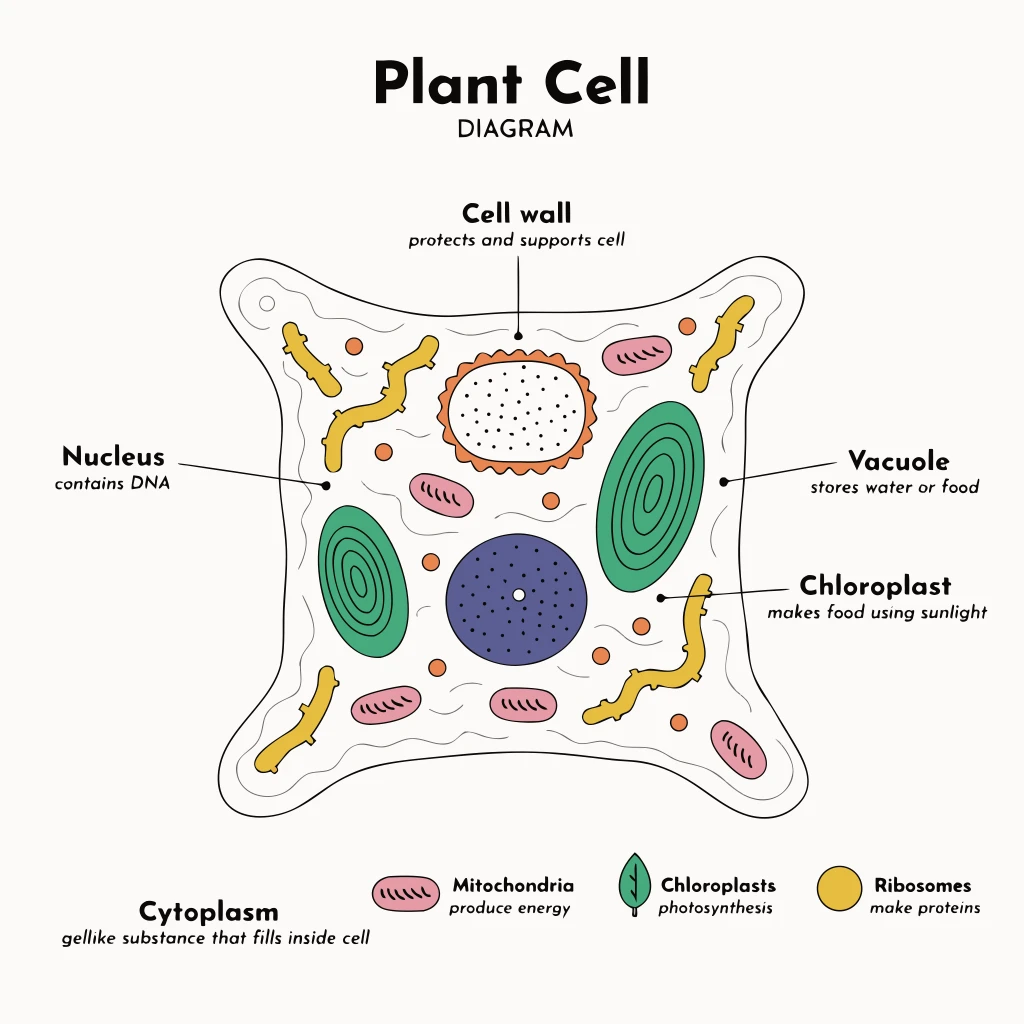
A scientific illustration of chemistry lab apparatus — when created in vector format, this diagram can be scaled from a small poster thumbnail to a full-page print without any quality loss.
Graphical Abstracts
Graphical abstracts submitted to Elsevier, Wiley, and other publishers must meet specific dimension and DPI requirements. Creating the graphical abstract in vector format from the start (rather than designing at low resolution and trying to upscale later) eliminates one of the most common submission problems.
For step-by-step guidance on creating graphical abstracts, see How to Create a Graphical Abstract for a Research Paper.
Presentation Slides
Vector diagrams embedded in PowerPoint or Keynote as SVG or EMF remain sharp when projected on any screen and when printed in handouts. Most scientists embed PNG screenshots of figures in slides — switching to vector originals noticeably improves visual quality without any increase in file size.
Best Practices for Vector Images
Minimize anchor points Each anchor point is a node in the mathematical description of the path. More anchor points means a more complex file — and more opportunities for unwanted kinks or artifacts. Use as few anchor points as possible to describe each curve while maintaining accuracy. In Inkscape, Path > Simplify (Ctrl+L) automatically reduces anchor point count while preserving shape.
Embed or outline fonts
If your vector file includes text, either embed the font or convert text to paths before sharing. A vector file that references a font not available on the recipient's system will render in a fallback font, changing the layout and appearance of your figure. Converting text to paths (Path > Object to Path in Inkscape) eliminates this dependency.
Use a consistent color palette Define your figure colors as named swatches in your design tool and apply them consistently. For scientific publication, ensure your palette is colorblind-accessible — approximately 8% of men have some form of color vision deficiency. The Okabe-Ito palette provides eight colorblind-safe colors that work for most scientific diagram needs.
Set stroke widths in points, not pixels When preparing figures for print, set line weights in points (pt) rather than pixels (px). Points are a physical unit (1pt = 0.353mm) that scales correctly in print output. A line that looks fine at 0.5px on screen may be invisible in print.
Check at final output size Always preview your vector figure at its intended print or display size before submitting. Reduce the zoom level in your design tool to match the final size and verify that all text remains legible, lines are clearly distinguishable, and small elements are not lost.
Related Reading
- Scientific Illustration: Complete Beginner's Guide — full workflow for creating publication-ready scientific figures
- How to Make Figures for Nature and Science Journals — journal-specific requirements and submission guidelines
- Okabe-Ito Palette Hex Codes — colorblind-safe color palette for figures
- Best Free Adobe Illustrator Alternatives — comparison of free vector tools for educators
- Inkscape Official Tutorials — free beginner to advanced video and text tutorials (external)
- Adobe SVG Format Guide — SVG file format explained by Adobe (external)
- SVG for Scientific Illustration — why SVG is the preferred format for research figures (external)
Frequently Asked Questions
What is the difference between vector and raster images?
A vector image stores graphics as mathematical equations describing points, lines, and curves, so it can be scaled to any size without quality loss. A raster image (JPEG, PNG, etc.) stores color values for a fixed grid of pixels, so enlarging it causes blurring and pixelation. Vector images are best for logos, diagrams, and illustrations; raster images are best for photographs and complex textures.
What is the best free software for creating vector images?
Inkscape is the leading free, open-source vector graphics editor and is capable of producing publication-quality scientific illustrations. It runs on Windows, Mac, and Linux and uses SVG as its native format. For diagram-style vector graphics (flowcharts, network diagrams), draw.io (diagrams.net) is a free browser-based option that requires no installation. Both are widely used in academic and research contexts.
What vector format should I use for journal submissions?
EPS (Encapsulated PostScript) is the most widely accepted vector format for journal submissions and is the standard requested by journals like Nature, Science, and Cell. PDF is also widely accepted, especially for figures created in LaTeX. SVG is increasingly supported for web-based journals and open-access publications. Always check the specific journal's author guidelines — requirements vary between publishers and journals.
How do I convert a PNG or JPEG image to vector (SVG)?
The process is called image tracing or vectorization. In Inkscape, import your raster image and use Path > Trace Bitmap to convert it to vector paths automatically. For better results, especially on complex images, AI-powered tracing tools like ConceptViz's Image to SVG Converter or Vector Magic provide significantly cleaner output. Vectorization works best on line art, logos, and simple illustrations — it cannot reconstruct true photographic depth or texture.
Do I need to convert text to paths in vector files?
Yes, when sharing vector files with collaborators or submitting to publishers, always convert text to outlines (paths) first. If your SVG or EPS file references a font that is not installed on the recipient's system, the text will render in a substituted font, changing the layout and appearance of your figure. In Inkscape, select all text and use Path > Object to Path. In Adobe Illustrator, use Type > Create Outlines.
What resolution should my vector image be for print?
Vector images are resolution-independent by definition — they will print at any size without quality loss. However, if your vector file includes embedded raster elements (like a photograph embedded in an Illustrator or Inkscape file), those embedded rasters must still be at least 300 DPI for the final print size. For purely vector content (shapes, paths, text), resolution is not a constraint.
Can I create vector images without drawing skills?
Yes. AI-powered tools like ConceptViz's Science Drawing Generator and Image to SVG Converter can generate or convert scientific illustrations without manual drawing. For diagram-type vector graphics (flowcharts, network diagrams, org charts), tools like draw.io require no drawing skill at all — you connect shapes with a drag-and-drop interface. For complex custom illustrations, some drawing skill helps, but most scientific diagrams can be built from geometric shapes and the Pen tool with modest practice.
Catégories
Plus d'articles

Central Dogma Diagram Guide: DNA to RNA to Protein
Learn how to read and draw a central dogma diagram, including DNA, mRNA, transcription, translation, ribosomes, codons, and common mistakes.

Heating Curve of Water Explained: The 5 Stages
Understand the heating curve of water step by step: what the axes mean, why the plateaus are flat, and how specific heat and latent heat shape each of the five stages.
: Tips, Slide Examples & Presentation Guide (2026)")
3 Minute Thesis (3MT): Tips, Slide Examples & Presentation Guide (2026)
3MT tips and winning slide examples. Learn how to design your 3 Minute Thesis slide, structure your presentation, and avoid common mistakes.