")
UML Diagram Types Explained: Class, Sequence & Use Case Guide (2026)
Learn the 14 UML diagram types with examples. Step-by-step guide to creating class diagrams, sequence diagrams, and use case diagrams for software projects.
Unified Modeling Language (UML) diagrams are the universal blueprint for software engineering. Whether you are designing a microservice architecture, documenting an API workflow, or communicating requirements to stakeholders, UML provides a standardized visual vocabulary that every developer and architect should know.
This guide covers all 14 UML diagram types, with a deep focus on the three most commonly used--class diagrams, sequence diagrams, and use case diagrams. You will learn what each diagram type does, when to use it, and how to create one step by step.
UML Diagram Generator
Create professional UML diagrams from text descriptions instantly. Class diagrams, sequence diagrams, use case diagrams, and more.
Try it free →What Is UML?
Unified Modeling Language (UML) is a standardized modeling language maintained by the Object Management Group (OMG). First published in 1997 and currently at version 2.5.1, UML provides 14 diagram types organized into two categories:
- Structural diagrams (7 types) -- show the static architecture of a system
- Behavioral diagrams (7 types) -- show the dynamic behavior and interactions within a system
UML is not a programming language. It is a visual specification language used to plan, document, and communicate software designs across teams, organizations, and time zones.
Why UML Still Matters in 2026
Despite the rise of agile methodologies and informal whiteboard sketches, UML remains critical for:
| Use Case | Why UML Helps |
|---|---|
| Enterprise architecture | Provides a common language across large teams |
| API documentation | Sequence diagrams clarify request/response flows |
| Database design | Class diagrams map directly to ORM schemas |
| Onboarding | New developers understand systems faster with visual models |
| Compliance | Regulated industries (healthcare, finance) require formal documentation |
| Code generation | Tools can generate code from UML models and vice versa |
The 14 UML Diagram Types at a Glance
Before diving deep into the most important types, here is a complete overview of all 14 UML diagrams.
Structural Diagrams (7 Types)
Structural diagrams represent the static elements of a system--the "things" that exist and how they relate to each other.
| Diagram Type | Purpose | When to Use |
|---|---|---|
| Class Diagram | Shows classes, attributes, methods, and relationships | Database design, OOP modeling, API planning |
| Object Diagram | Snapshot of class instances at a specific point in time | Debugging, verifying class diagram correctness |
| Component Diagram | Shows how software components are wired together | Microservice architecture, library dependencies |
| Deployment Diagram | Maps software artifacts to hardware nodes | DevOps planning, infrastructure documentation |
| Package Diagram | Groups related classes into packages | Large codebase organization, module boundaries |
| Composite Structure Diagram | Shows internal structure of a class or component | Complex class internals, design patterns |
| Profile Diagram | Extends UML with domain-specific stereotypes | Custom modeling for specific industries |
Behavioral Diagrams (7 Types)
Behavioral diagrams represent the dynamic aspects--what happens when the system runs.
| Diagram Type | Purpose | When to Use |
|---|---|---|
| Use Case Diagram | Shows system functionality from the user's perspective | Requirements gathering, stakeholder communication |
| Activity Diagram | Models workflows and business processes | Process mapping, algorithm design |
| State Machine Diagram | Shows object lifecycle and state transitions | Order processing, authentication flows |
| Sequence Diagram | Shows object interactions over time | API flows, authentication sequences |
| Communication Diagram | Shows object interactions emphasizing structure | Similar to sequence diagrams but focused on relationships |
| Interaction Overview Diagram | Combines activity and sequence diagrams | Complex interaction flows with branching |
| Timing Diagram | Shows state changes against a time axis | Real-time systems, hardware interfaces |
Class Diagrams: The Foundation of OOP Design
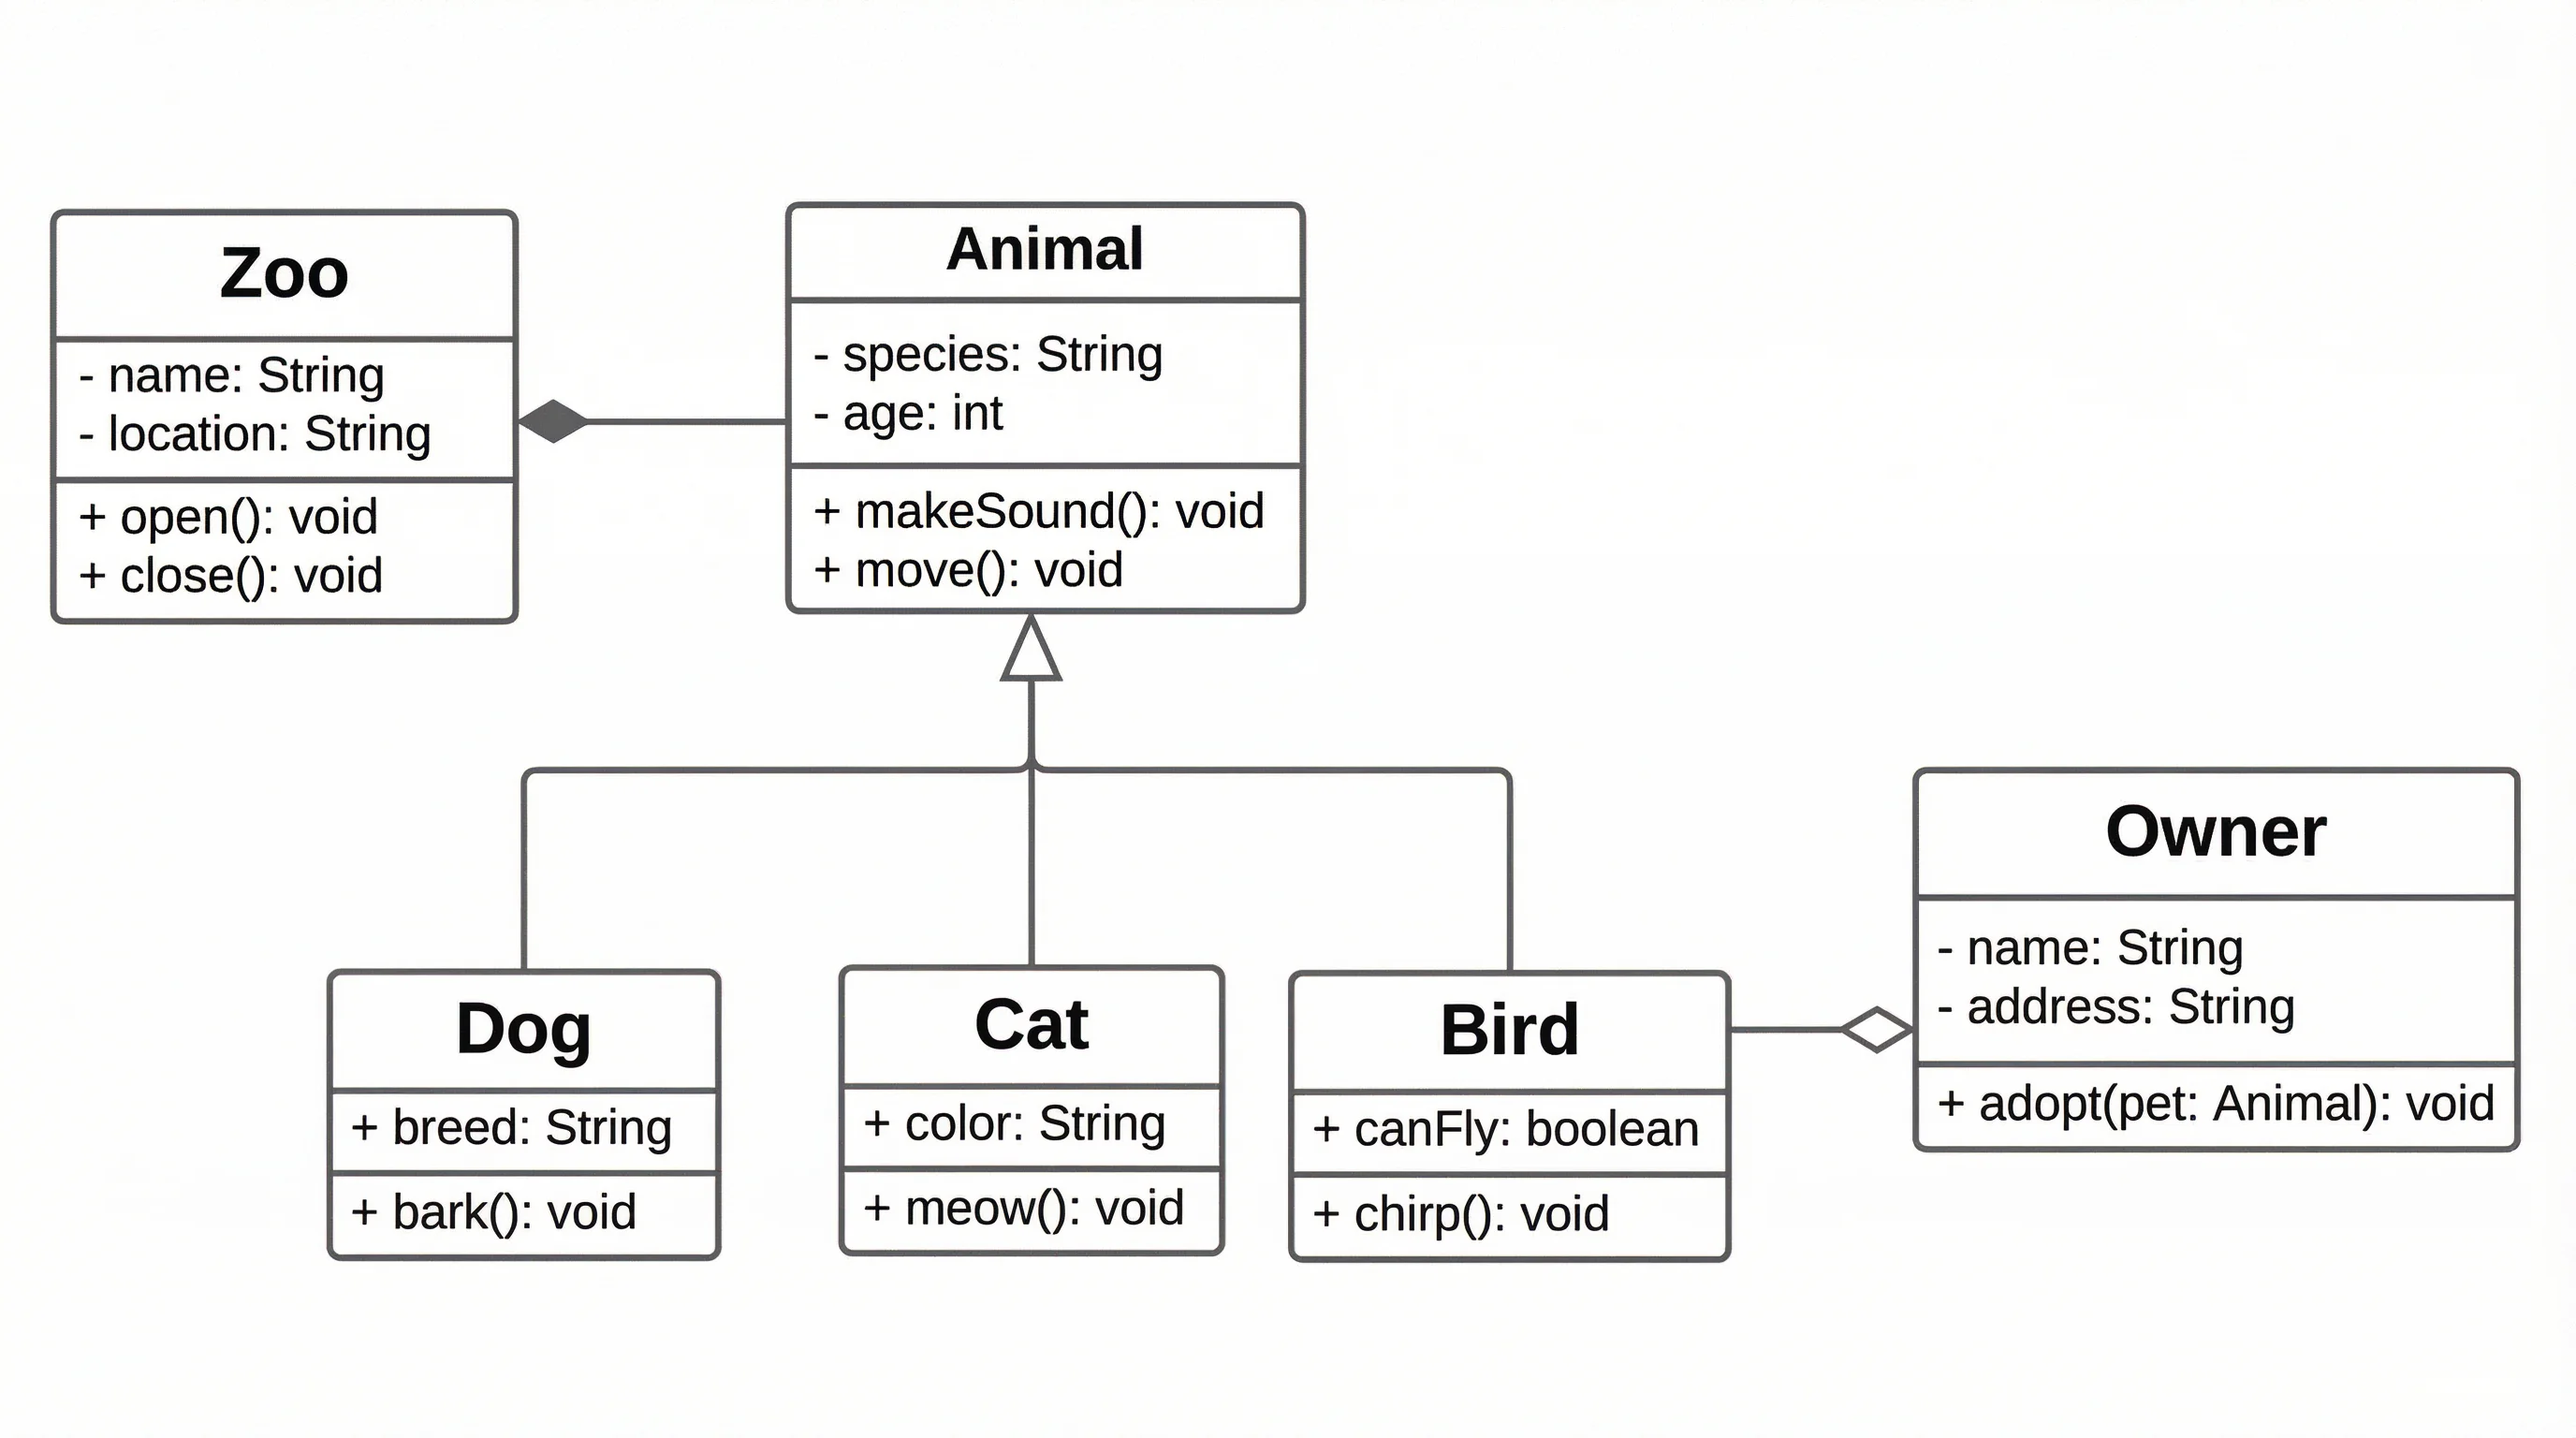
Class diagrams are the most widely used UML diagram type. They define the static structure of a system by showing classes, their attributes and methods, and the relationships between them.
A class diagram models the structure of an object-oriented system with classes, attributes, methods, and relationships
Anatomy of a Class
A class in UML is represented by a rectangle divided into three sections:
+---------------------------+
|       ClassName           |  <-- Name compartment
+---------------------------+
| - attribute1: Type        |  <-- Attributes
| - attribute2: Type        |
| # protectedAttr: Type     |
+---------------------------+
| + method1(): ReturnType   |  <-- Methods
| + method2(param): void    |
| - privateMethod(): Type   |
+---------------------------+
Visibility modifiers:
| Symbol | Meaning |
|---|---|
+ | Public |
- | Private |
# | Protected |
~ | Package |
Class Relationships
The power of class diagrams lies in the relationships between classes:
Association -- A general "uses" relationship drawn as a solid line. For example, a Student is associated with a Course.
Aggregation -- A "has-a" relationship where the part can exist independently. Drawn with an open diamond. A Department has Professors, but professors exist without the department.
Composition -- A strong "contains" relationship where the part cannot exist without the whole. Drawn with a filled diamond. A House contains Rooms, and rooms do not exist without the house.
Inheritance (Generalization) -- An "is-a" relationship drawn with an open triangle arrow. A Dog is an Animal.
Dependency -- A weaker relationship where one class uses another temporarily. Drawn with a dashed arrow. A ReportGenerator depends on a Database.
Realization -- A class implements an interface. Drawn with a dashed line and open triangle arrow.
Step-by-Step: Creating a Class Diagram
- Identify the domain objects -- List the main entities in your system (User, Order, Product, Payment)
- Define attributes -- For each class, list the data it holds with types
- Define methods -- Add the key operations each class performs
- Establish relationships -- Draw associations, inheritance, and composition links
- Add multiplicity -- Specify cardinality (1, 0..1, 1.., 0..)
- Refine and validate -- Check that the diagram maps to your database schema or code structure
When to Use Class Diagrams
- Designing a new database schema
- Planning object-oriented code architecture
- Documenting existing codebases for onboarding
- Communicating domain models with stakeholders
- Generating code from models (or models from code)
Sequence Diagrams: Modeling Interactions Over Time
Sequence diagrams show how objects interact by exchanging messages in a specific order. They are the go-to diagram for documenting API calls, authentication flows, and any process where timing matters.
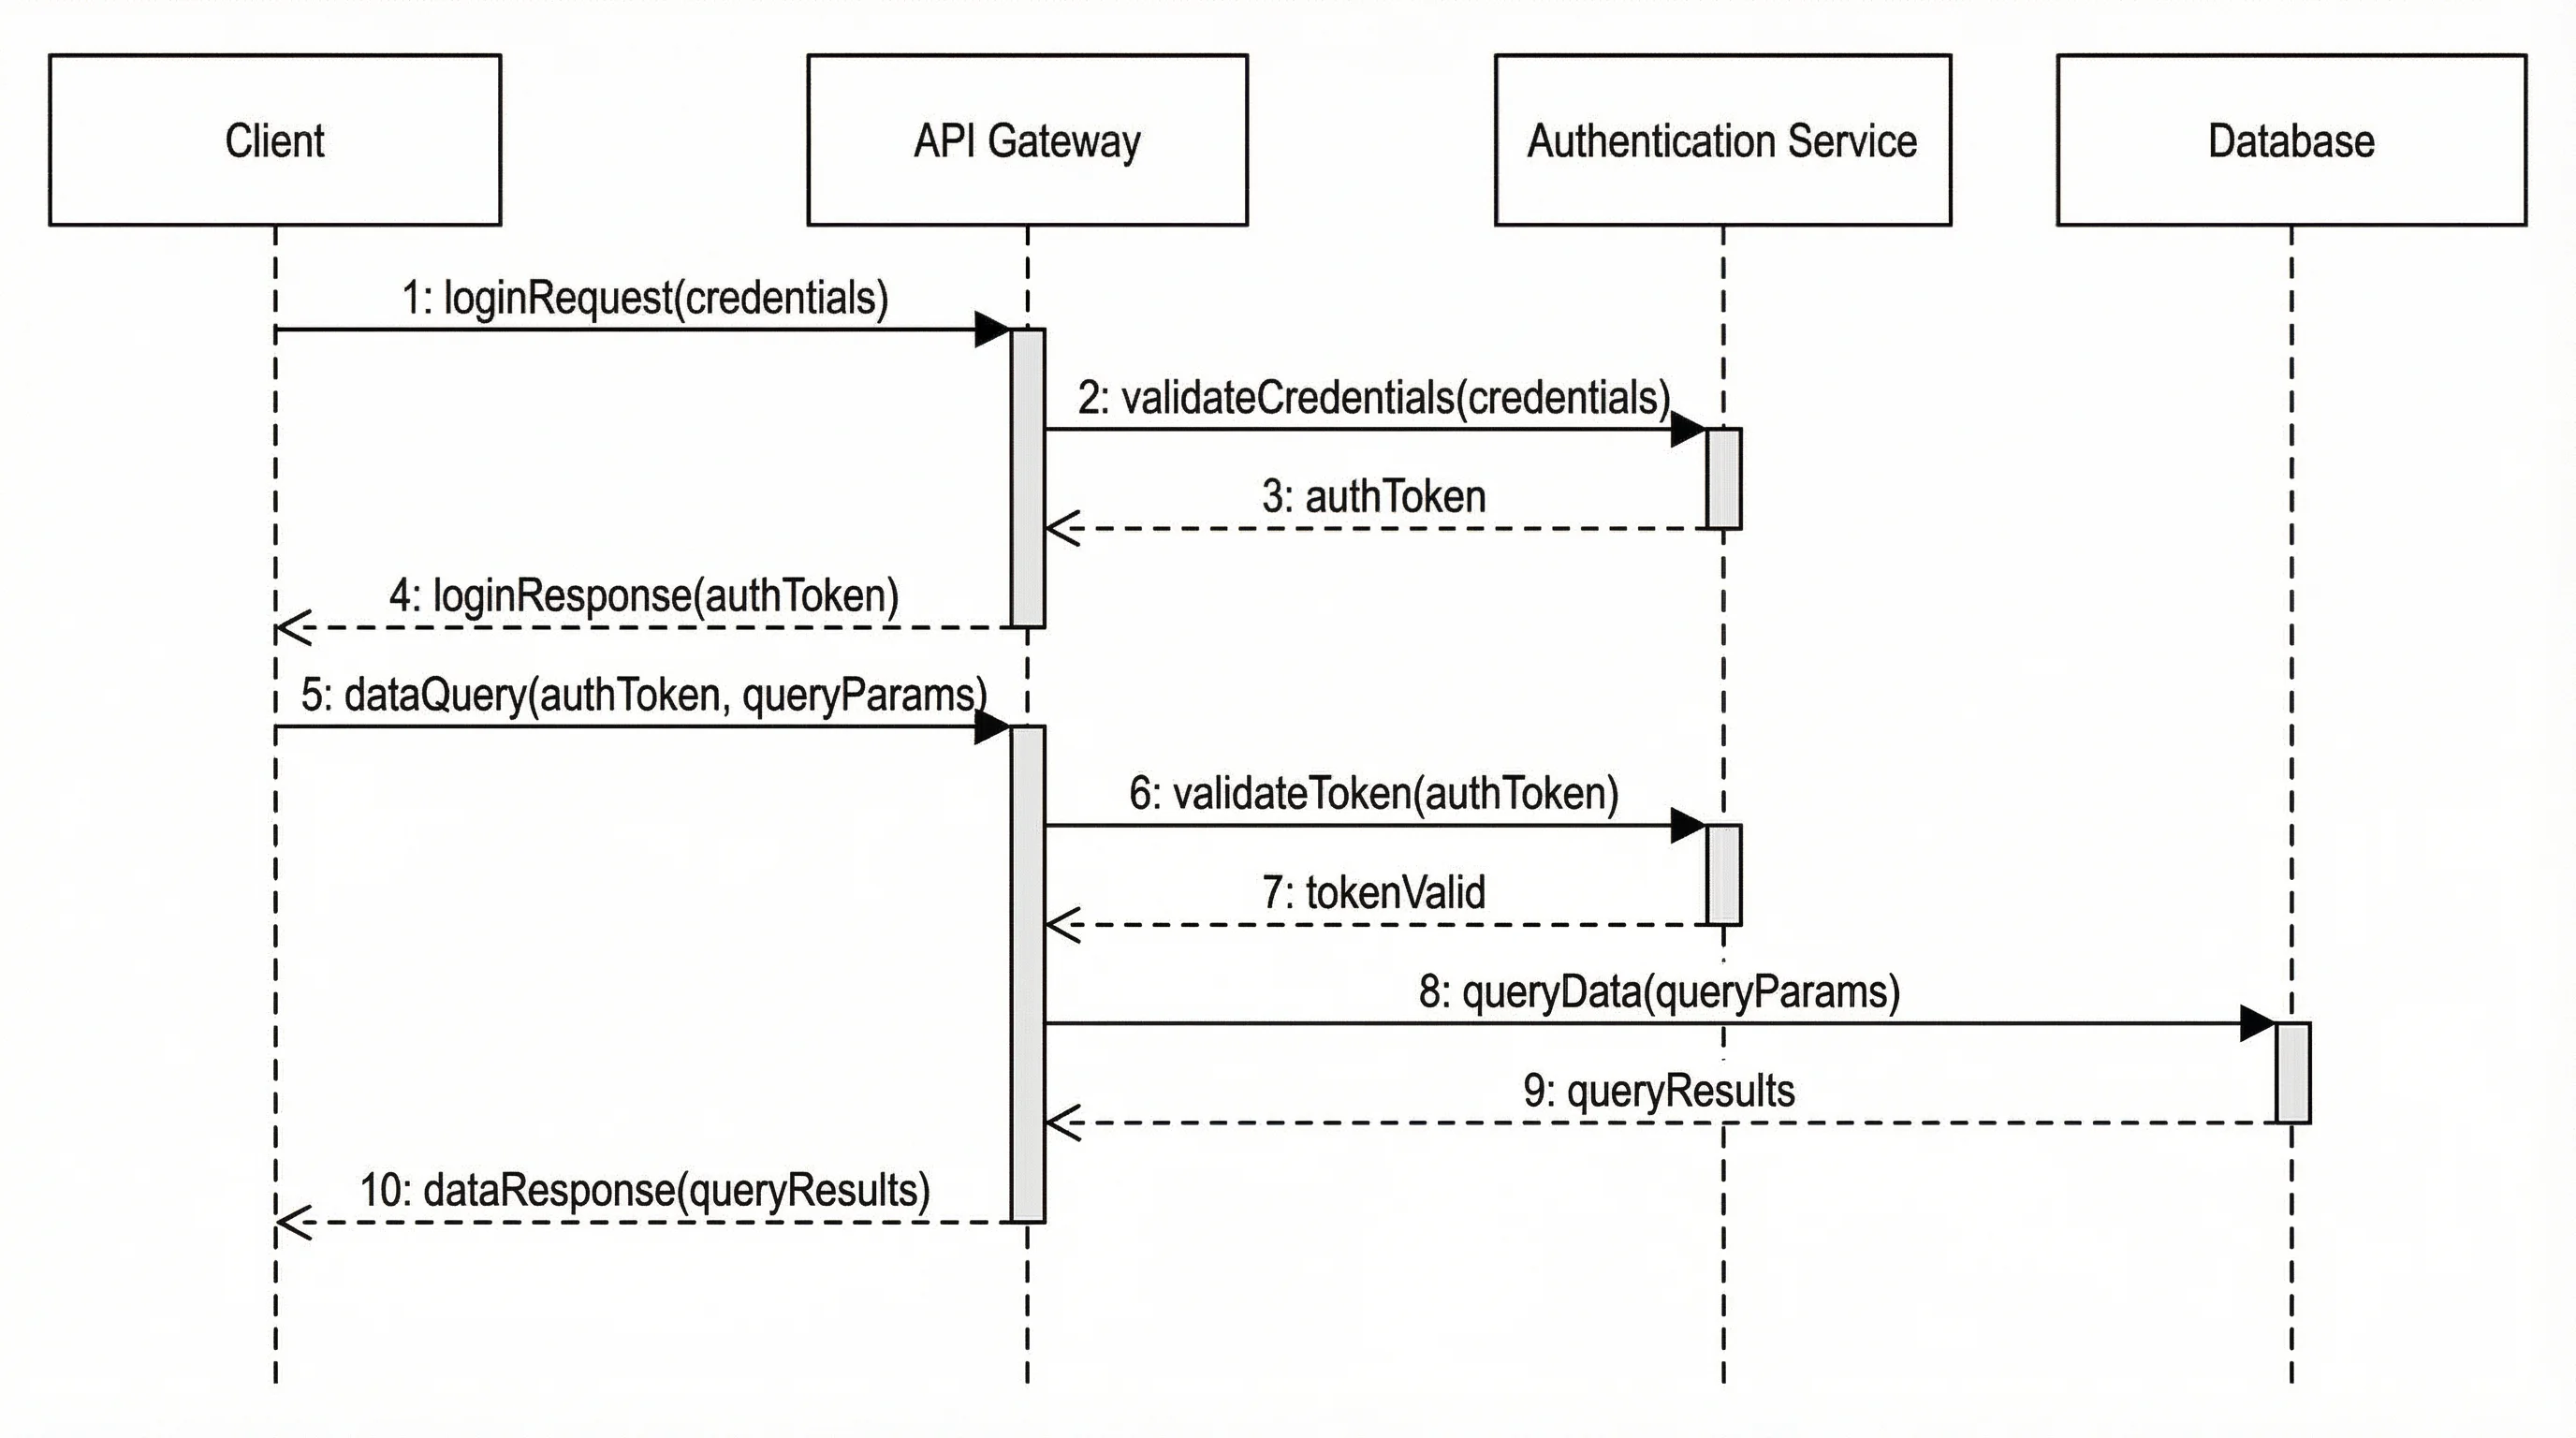
A sequence diagram visualizes the message flow between objects along a time axis
Key Elements
| Element | Symbol | Description |
|---|---|---|
| Lifeline | Dashed vertical line with a rectangle header | Represents an object or actor participating in the interaction |
| Activation bar | Thin rectangle on the lifeline | Shows when an object is actively processing |
| Synchronous message | Solid arrow with filled head | Sender waits for a response |
| Asynchronous message | Solid arrow with open head | Sender continues without waiting |
| Return message | Dashed arrow | The response from a synchronous call |
| Self-message | Arrow looping back to the same lifeline | An object calls one of its own methods |
Advanced Sequence Diagram Features
Combined fragments allow you to add logic to sequence diagrams:
- alt -- If/else branching (only one path executes)
- opt -- Optional block (executes if condition is true)
- loop -- Repeated execution
- par -- Parallel execution
- break -- Exit the enclosing interaction
- ref -- Reference to another sequence diagram
Step-by-Step: Creating a Sequence Diagram
- Identify the scenario -- Choose a specific use case or user story
- List the participants -- Determine which objects, actors, or systems are involved
- Map the message flow -- Write out the sequence of calls and responses
- Add activation bars -- Show when each participant is active
- Include fragments -- Add loops, conditions, or parallel blocks as needed
- Annotate -- Add notes for business rules or constraints
Example: User Authentication Flow
A typical authentication sequence diagram includes:
- User sends login credentials to the Client Application
- Client Application forwards the request to the Authentication Server
- Authentication Server validates credentials against the Database
- Database returns user data (or error)
- Authentication Server generates a JWT token
- Token is returned to the Client Application
- Client Application stores the token and redirects the user
When to Use Sequence Diagrams
- Documenting REST API request/response flows
- Designing authentication and authorization sequences
- Planning microservice communication patterns
- Debugging complex multi-system interactions
- Creating technical documentation for development teams
Use Case Diagrams: Capturing Requirements
Use case diagrams provide a high-level view of what a system does from the user's perspective. They are primarily used during requirements analysis to identify the functionality a system must support.
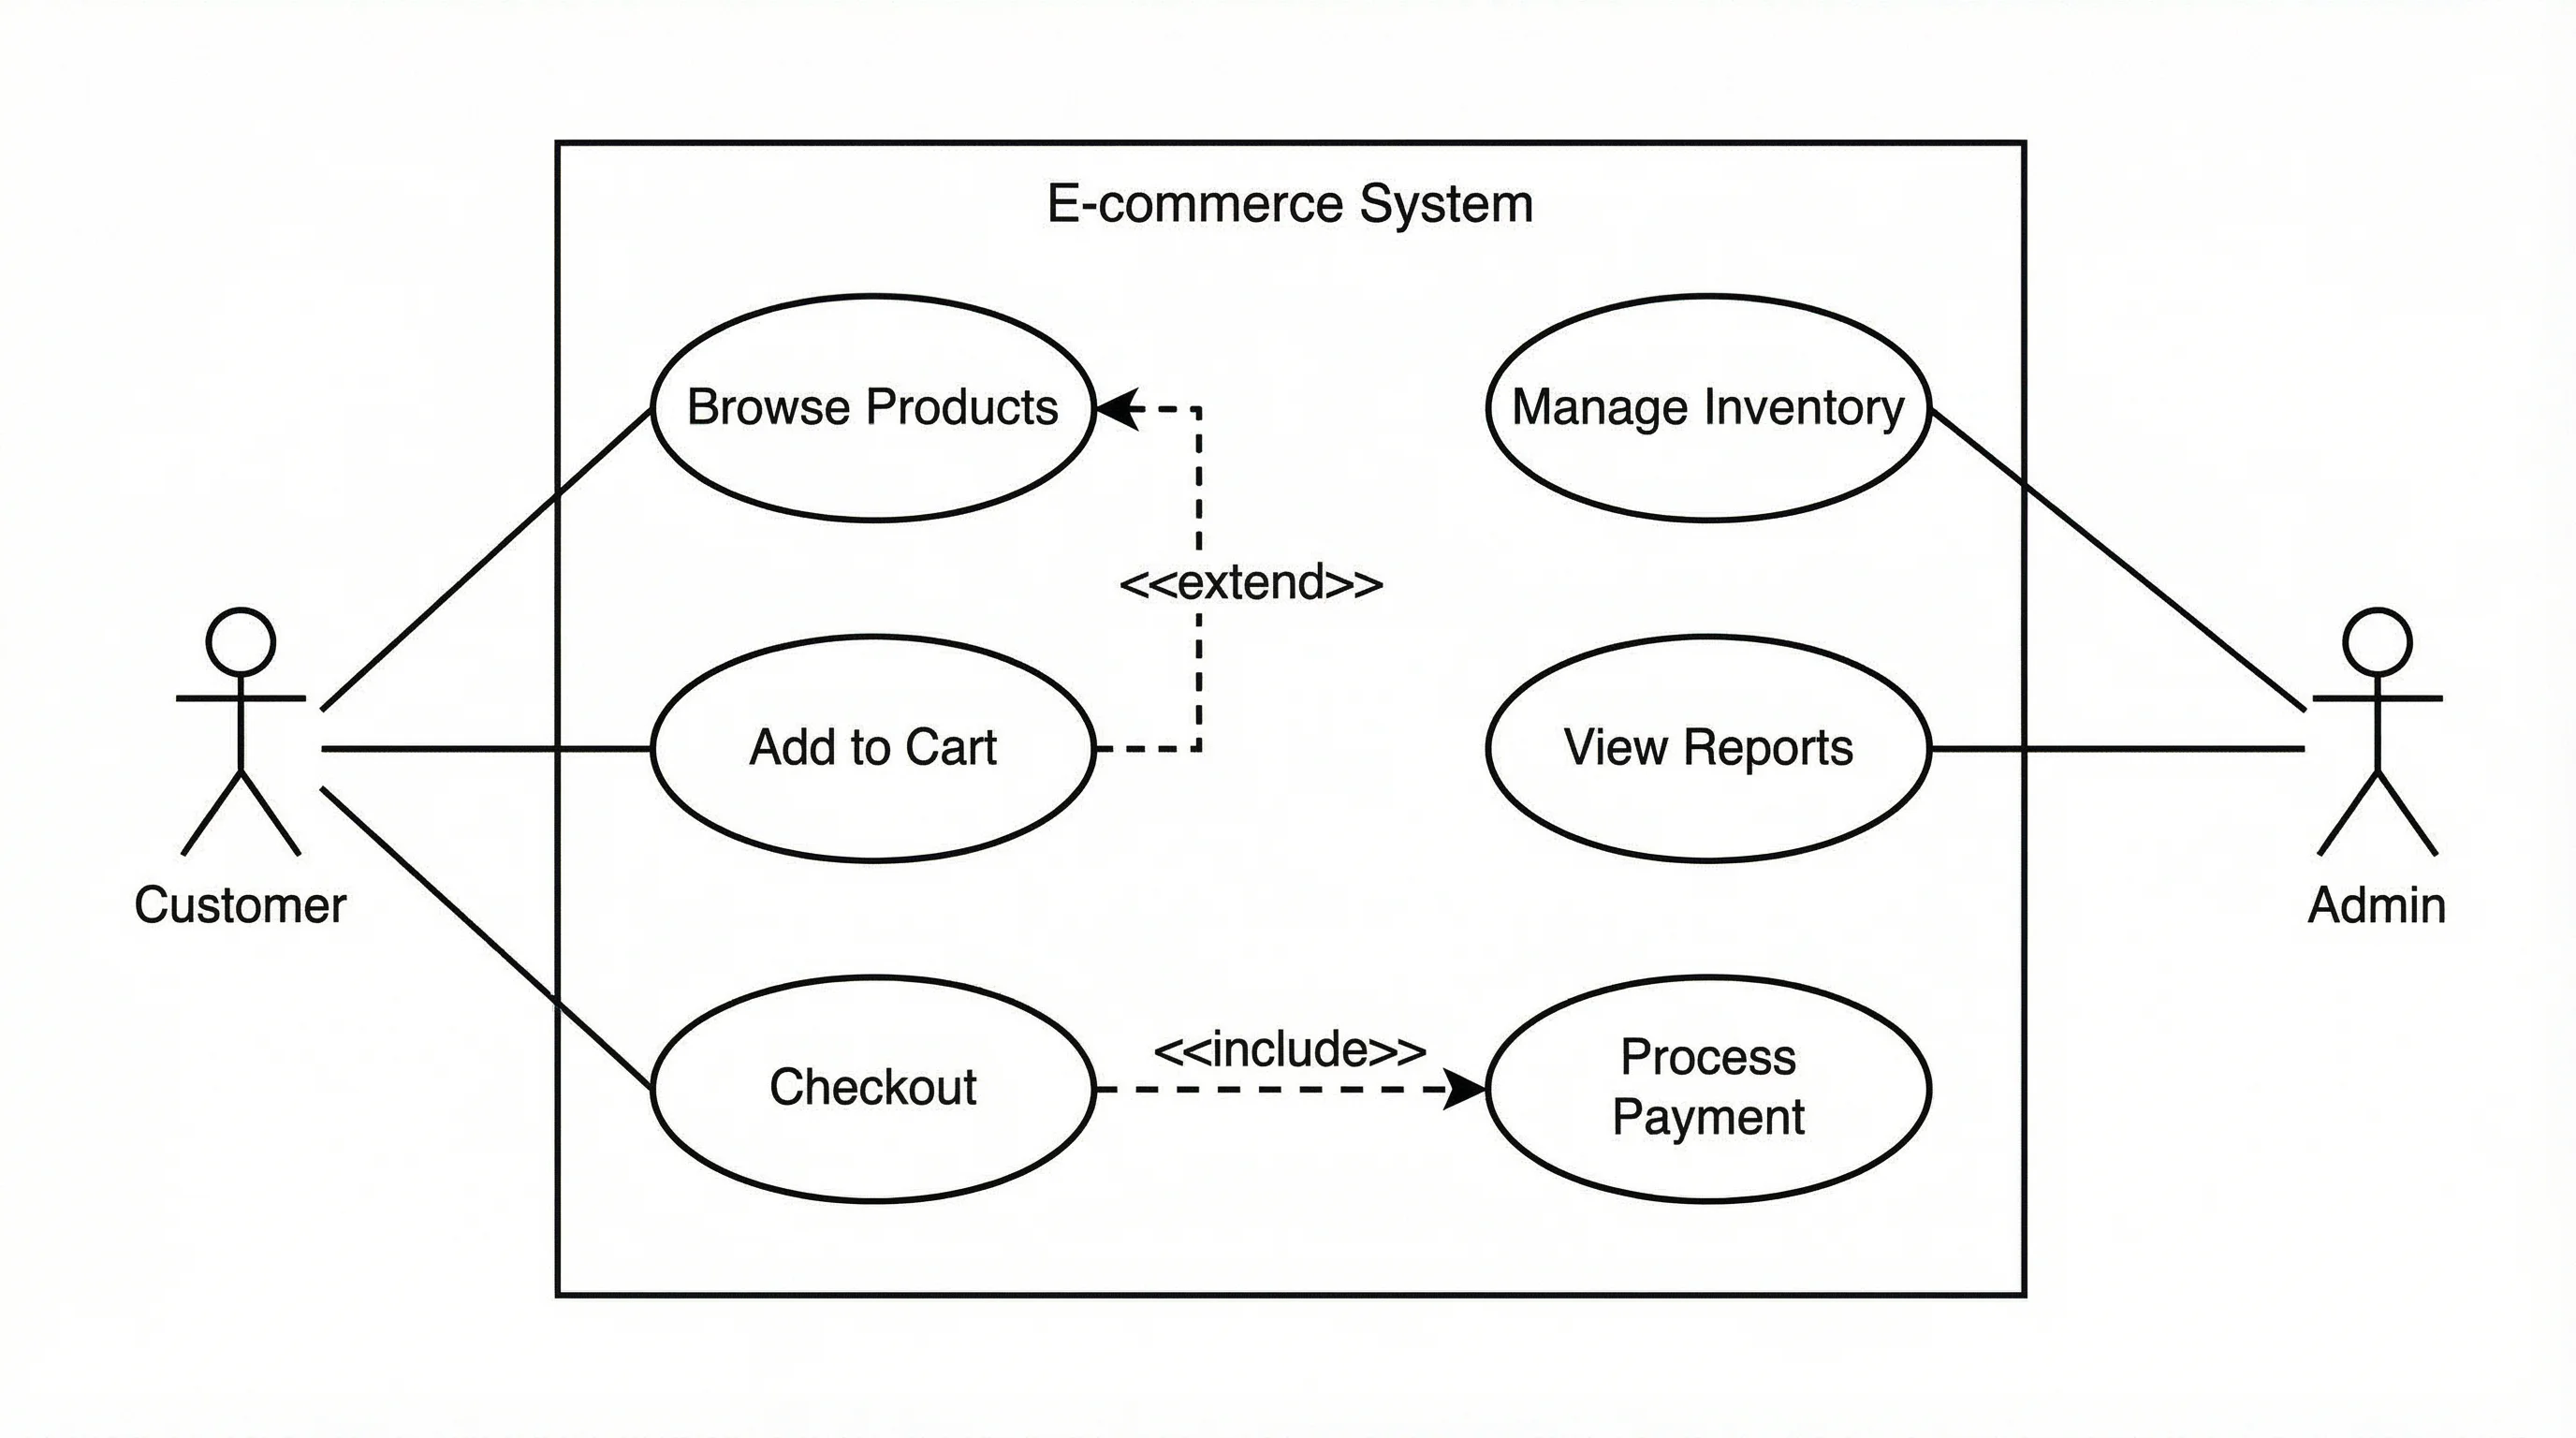
A use case diagram shows actors, system boundaries, and the functions users can perform
Key Elements
| Element | Symbol | Description |
|---|---|---|
| Actor | Stick figure | A person, organization, or external system that interacts with the system |
| Use case | Oval | A specific function or service the system provides |
| System boundary | Rectangle | Defines what is inside and outside the system |
| Association | Solid line | Connects an actor to a use case they can perform |
Use Case Relationships
Include -- A use case that is always executed as part of another use case. Drawn with a dashed arrow labeled <<include>>. For example, "Place Order" always includes "Validate Payment."
Extend -- A use case that optionally extends another use case. Drawn with a dashed arrow labeled <<extend>>. "Apply Discount Code" extends "Checkout."
Generalization -- An actor or use case that inherits behavior from a parent. "Premium Customer" generalizes "Customer."
Step-by-Step: Creating a Use Case Diagram
- Identify actors -- Who uses the system? (End users, admins, external systems, APIs)
- List use cases -- What can each actor do? (Register, Login, Browse, Purchase, Report)
- Draw the system boundary -- Place use cases inside a rectangle representing your system
- Connect actors to use cases -- Draw association lines
- Add relationships -- Use include, extend, and generalization where applicable
- Validate with stakeholders -- Ensure all requirements are captured
When to Use Use Case Diagrams
- Early-stage requirements gathering
- Communicating with non-technical stakeholders
- Defining project scope and system boundaries
- Identifying actors and their permissions
- Planning test scenarios based on user stories
Activity Diagrams: Modeling Workflows
Activity diagrams are UML's answer to flowcharts. They model the workflow from a start point to a finish point, showing the sequence of activities, decision points, and parallel processes.
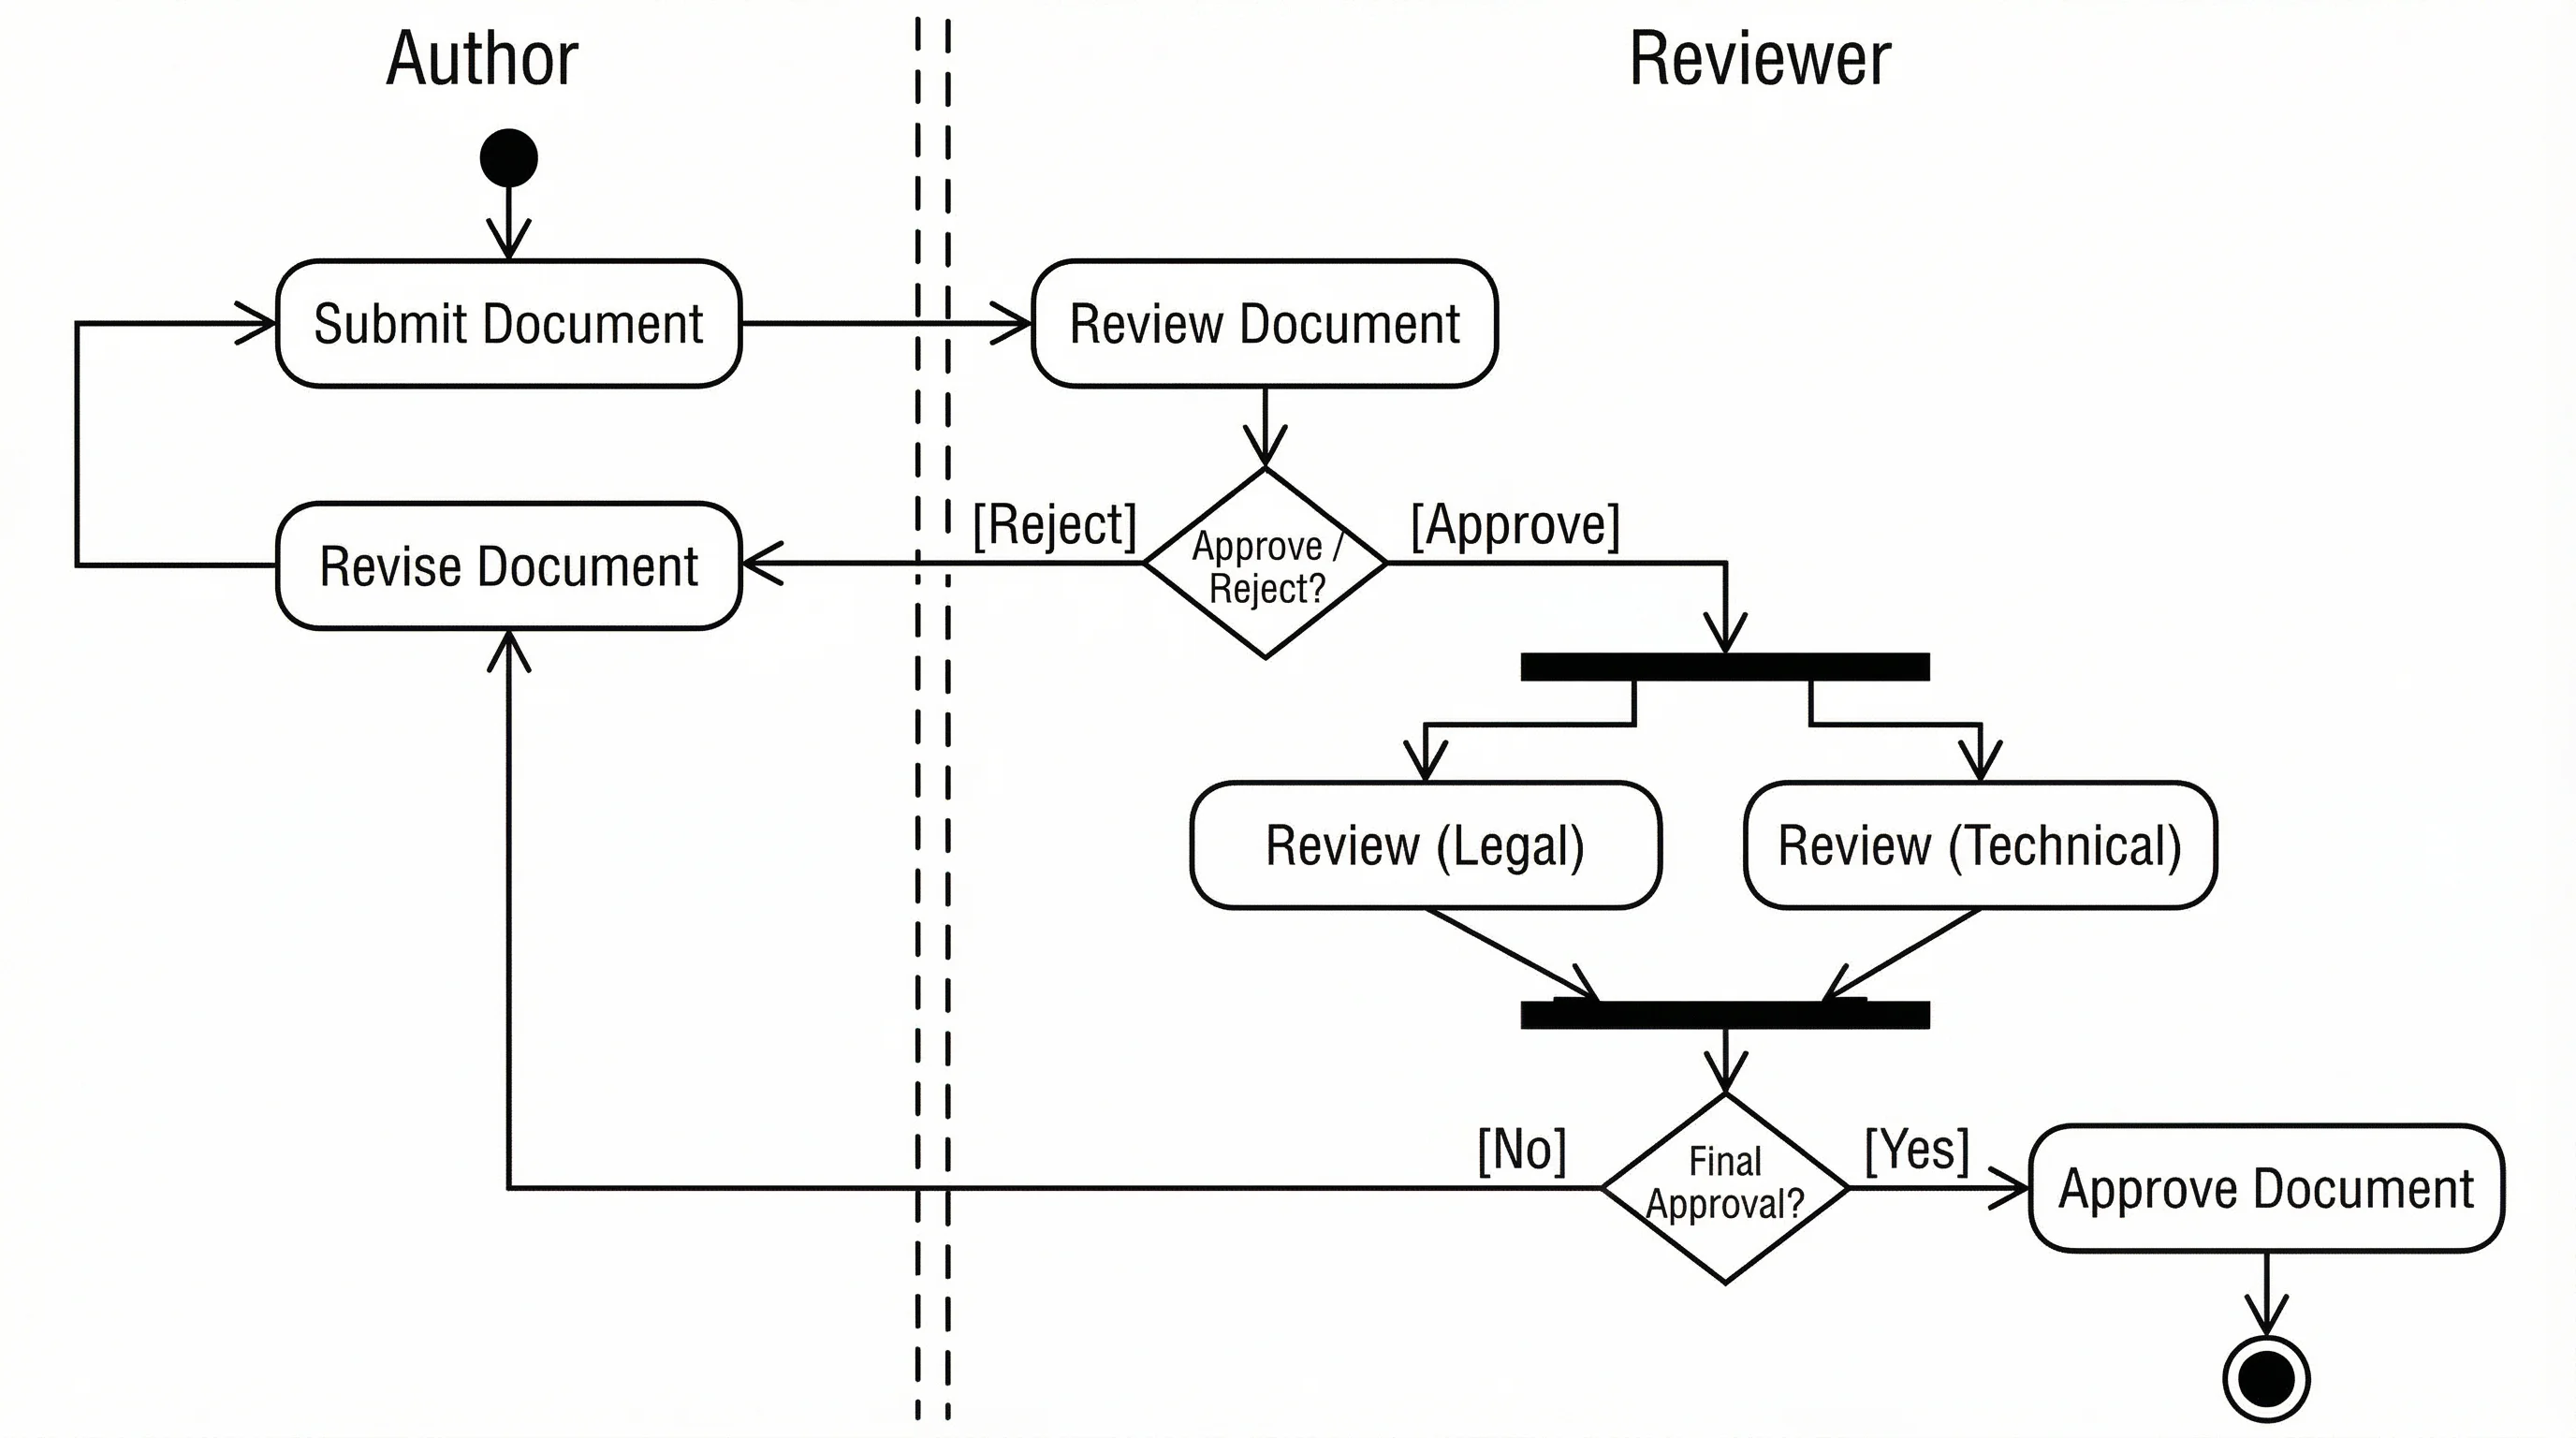
An activity diagram models the step-by-step workflow of a business process or algorithm
Key Elements
| Element | Symbol | Description |
|---|---|---|
| Initial node | Filled circle | Starting point of the workflow |
| Activity | Rounded rectangle | A single step in the process |
| Decision node | Diamond | A branching point with conditions |
| Fork/Join | Thick horizontal bar | Split into or synchronize parallel flows |
| Final node | Filled circle inside a circle | End of the workflow |
| Swim lane | Vertical or horizontal partition | Groups activities by responsible actor |
When to Use Activity Diagrams
- Business process modeling
- Algorithm design and documentation
- Workflow automation planning
- Parallel process visualization
- Use case detail expansion
State Machine Diagrams: Tracking Object Lifecycles
State machine diagrams show the different states an object can be in and the events that cause transitions between states. They are essential for modeling objects with complex lifecycles.
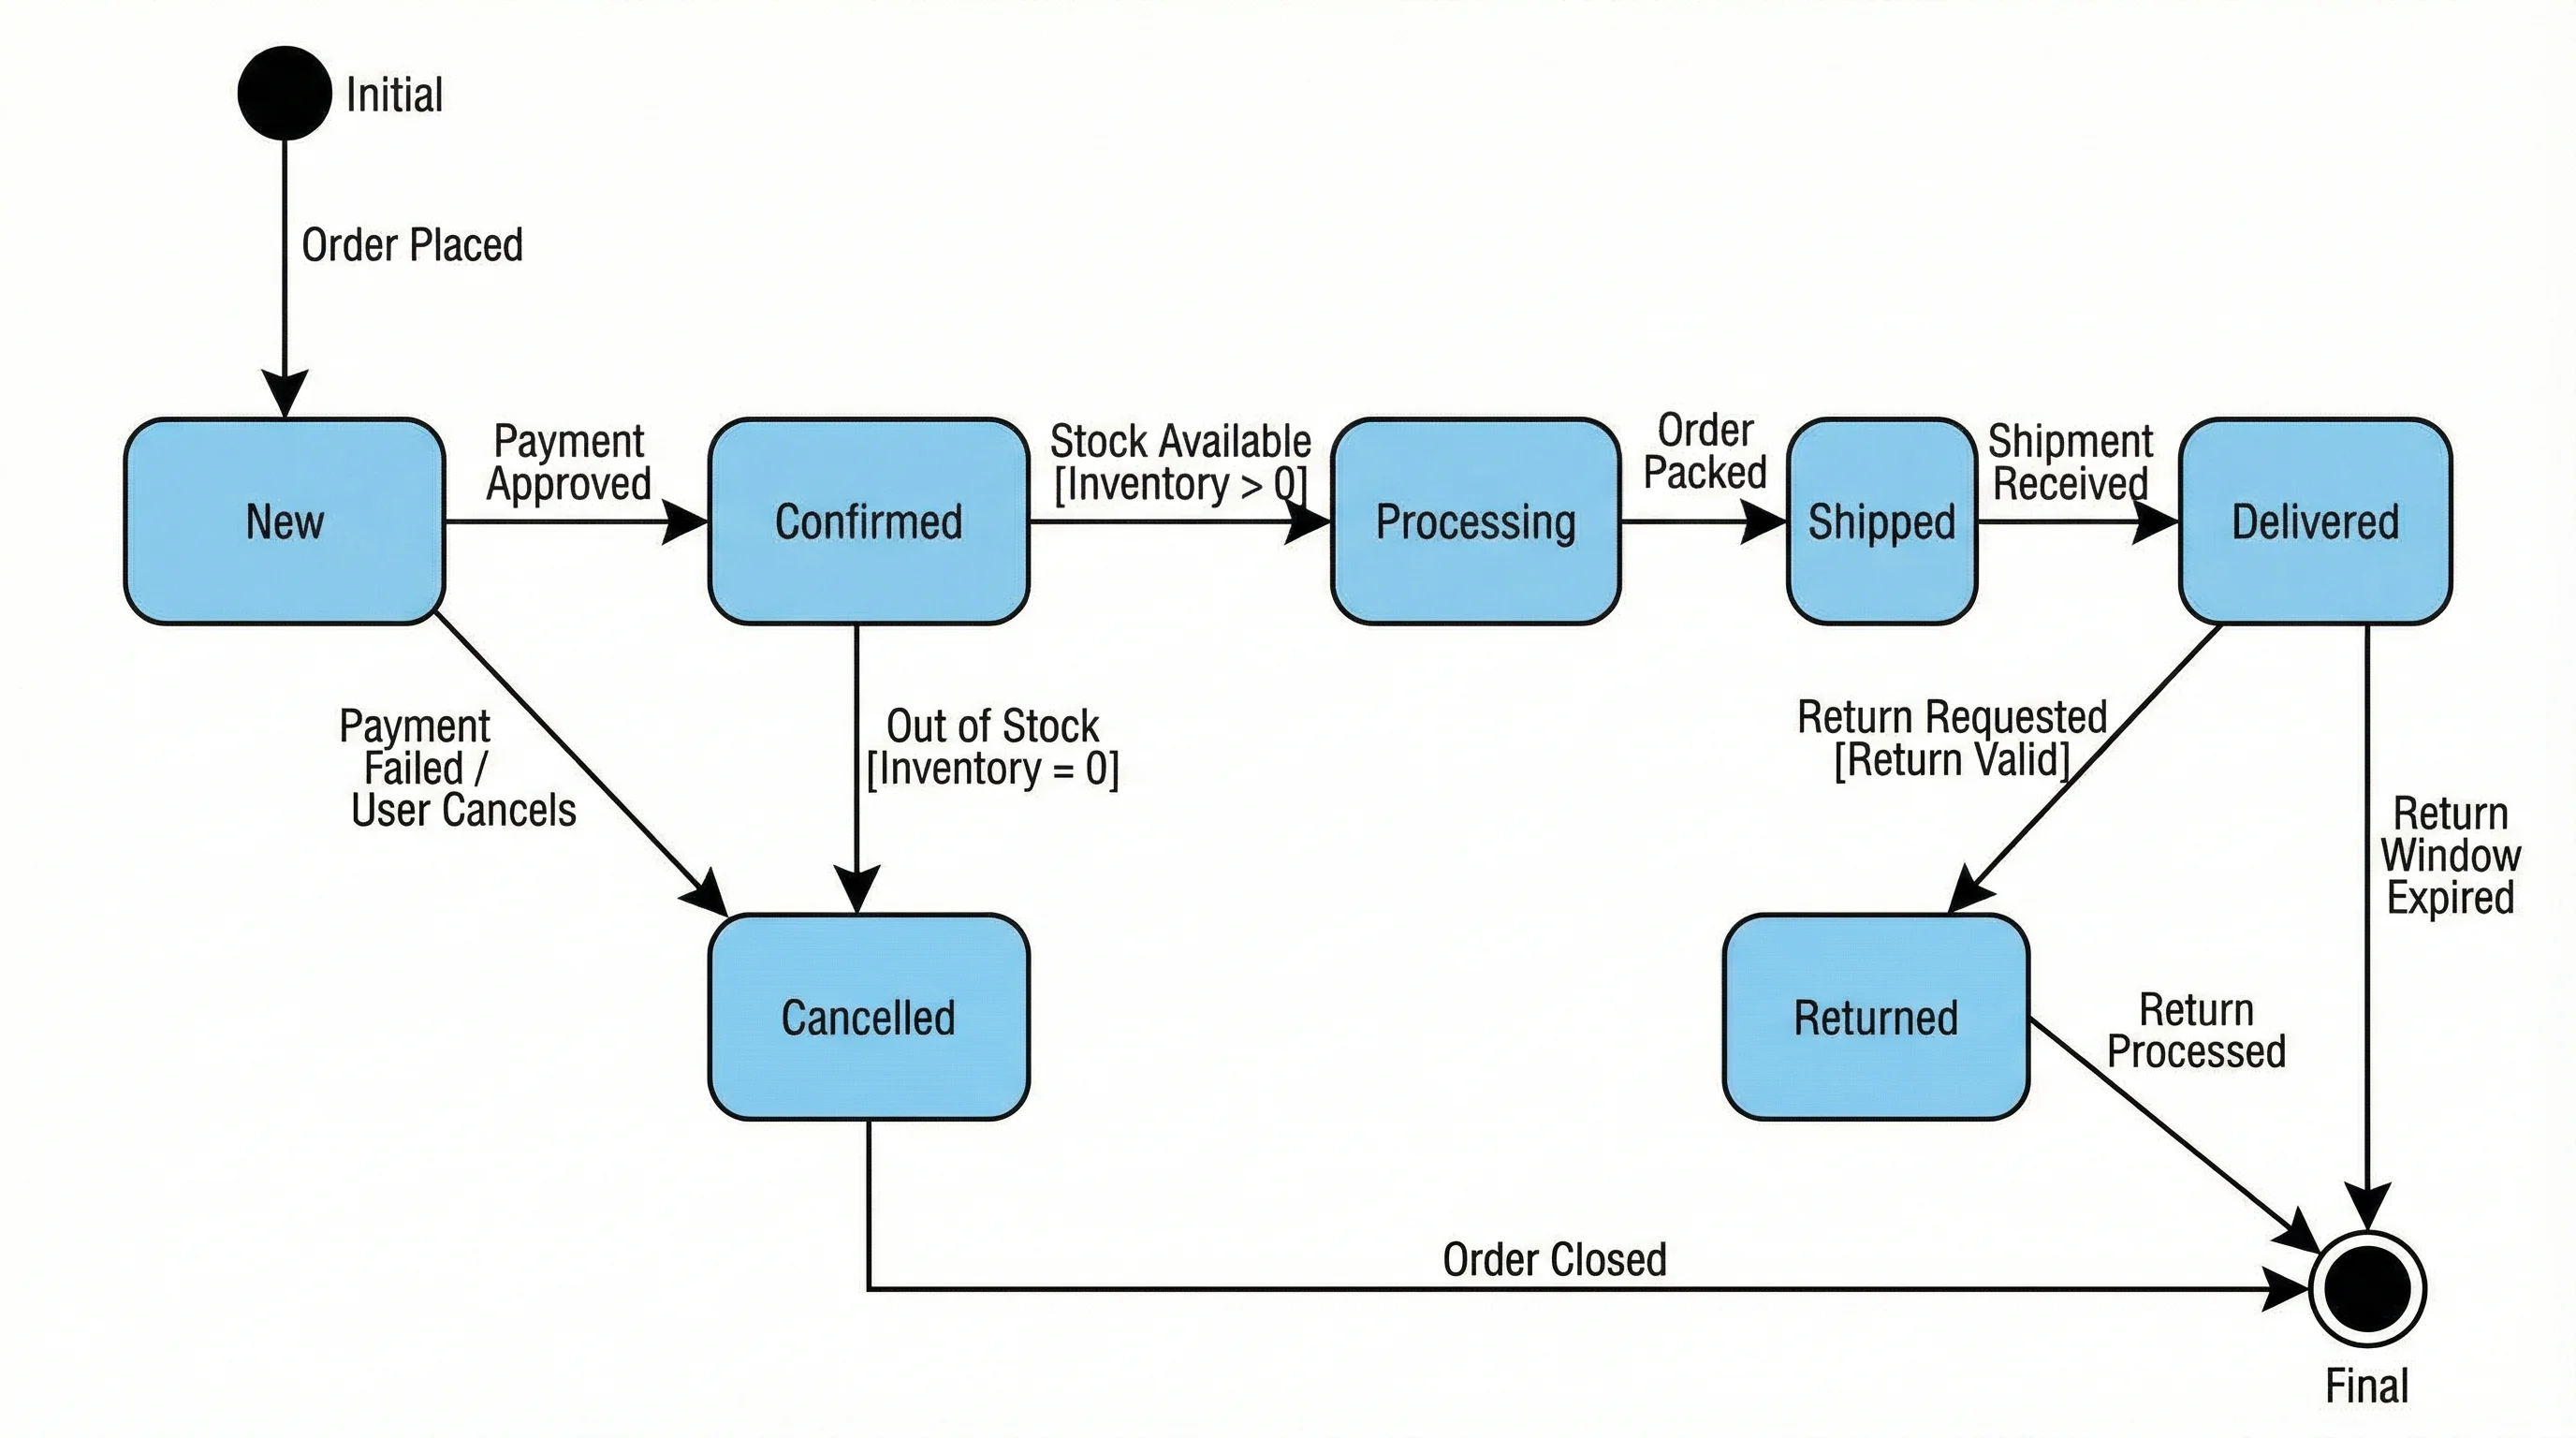
A state machine diagram tracks how an object transitions between states in response to events
Key Elements
| Element | Symbol | Description |
|---|---|---|
| State | Rounded rectangle | A condition or situation of an object |
| Transition | Arrow with label | Movement from one state to another |
| Initial state | Filled circle | The starting state |
| Final state | Filled circle in a circle | The terminal state |
| Guard condition | [condition] in brackets | A boolean condition that must be true for the transition |
| Action | / action after the event name | An action performed during the transition |
Common Use Cases for State Machine Diagrams
- Order processing (Pending, Confirmed, Shipped, Delivered, Cancelled)
- User authentication (Logged Out, Authenticating, Logged In, Locked)
- Document workflows (Draft, In Review, Approved, Published, Archived)
- Network connection states (Disconnected, Connecting, Connected, Error)
Component Diagrams: Designing System Architecture
Component diagrams show how software components are organized and their dependencies. They are particularly valuable for microservice architectures and modular systems.
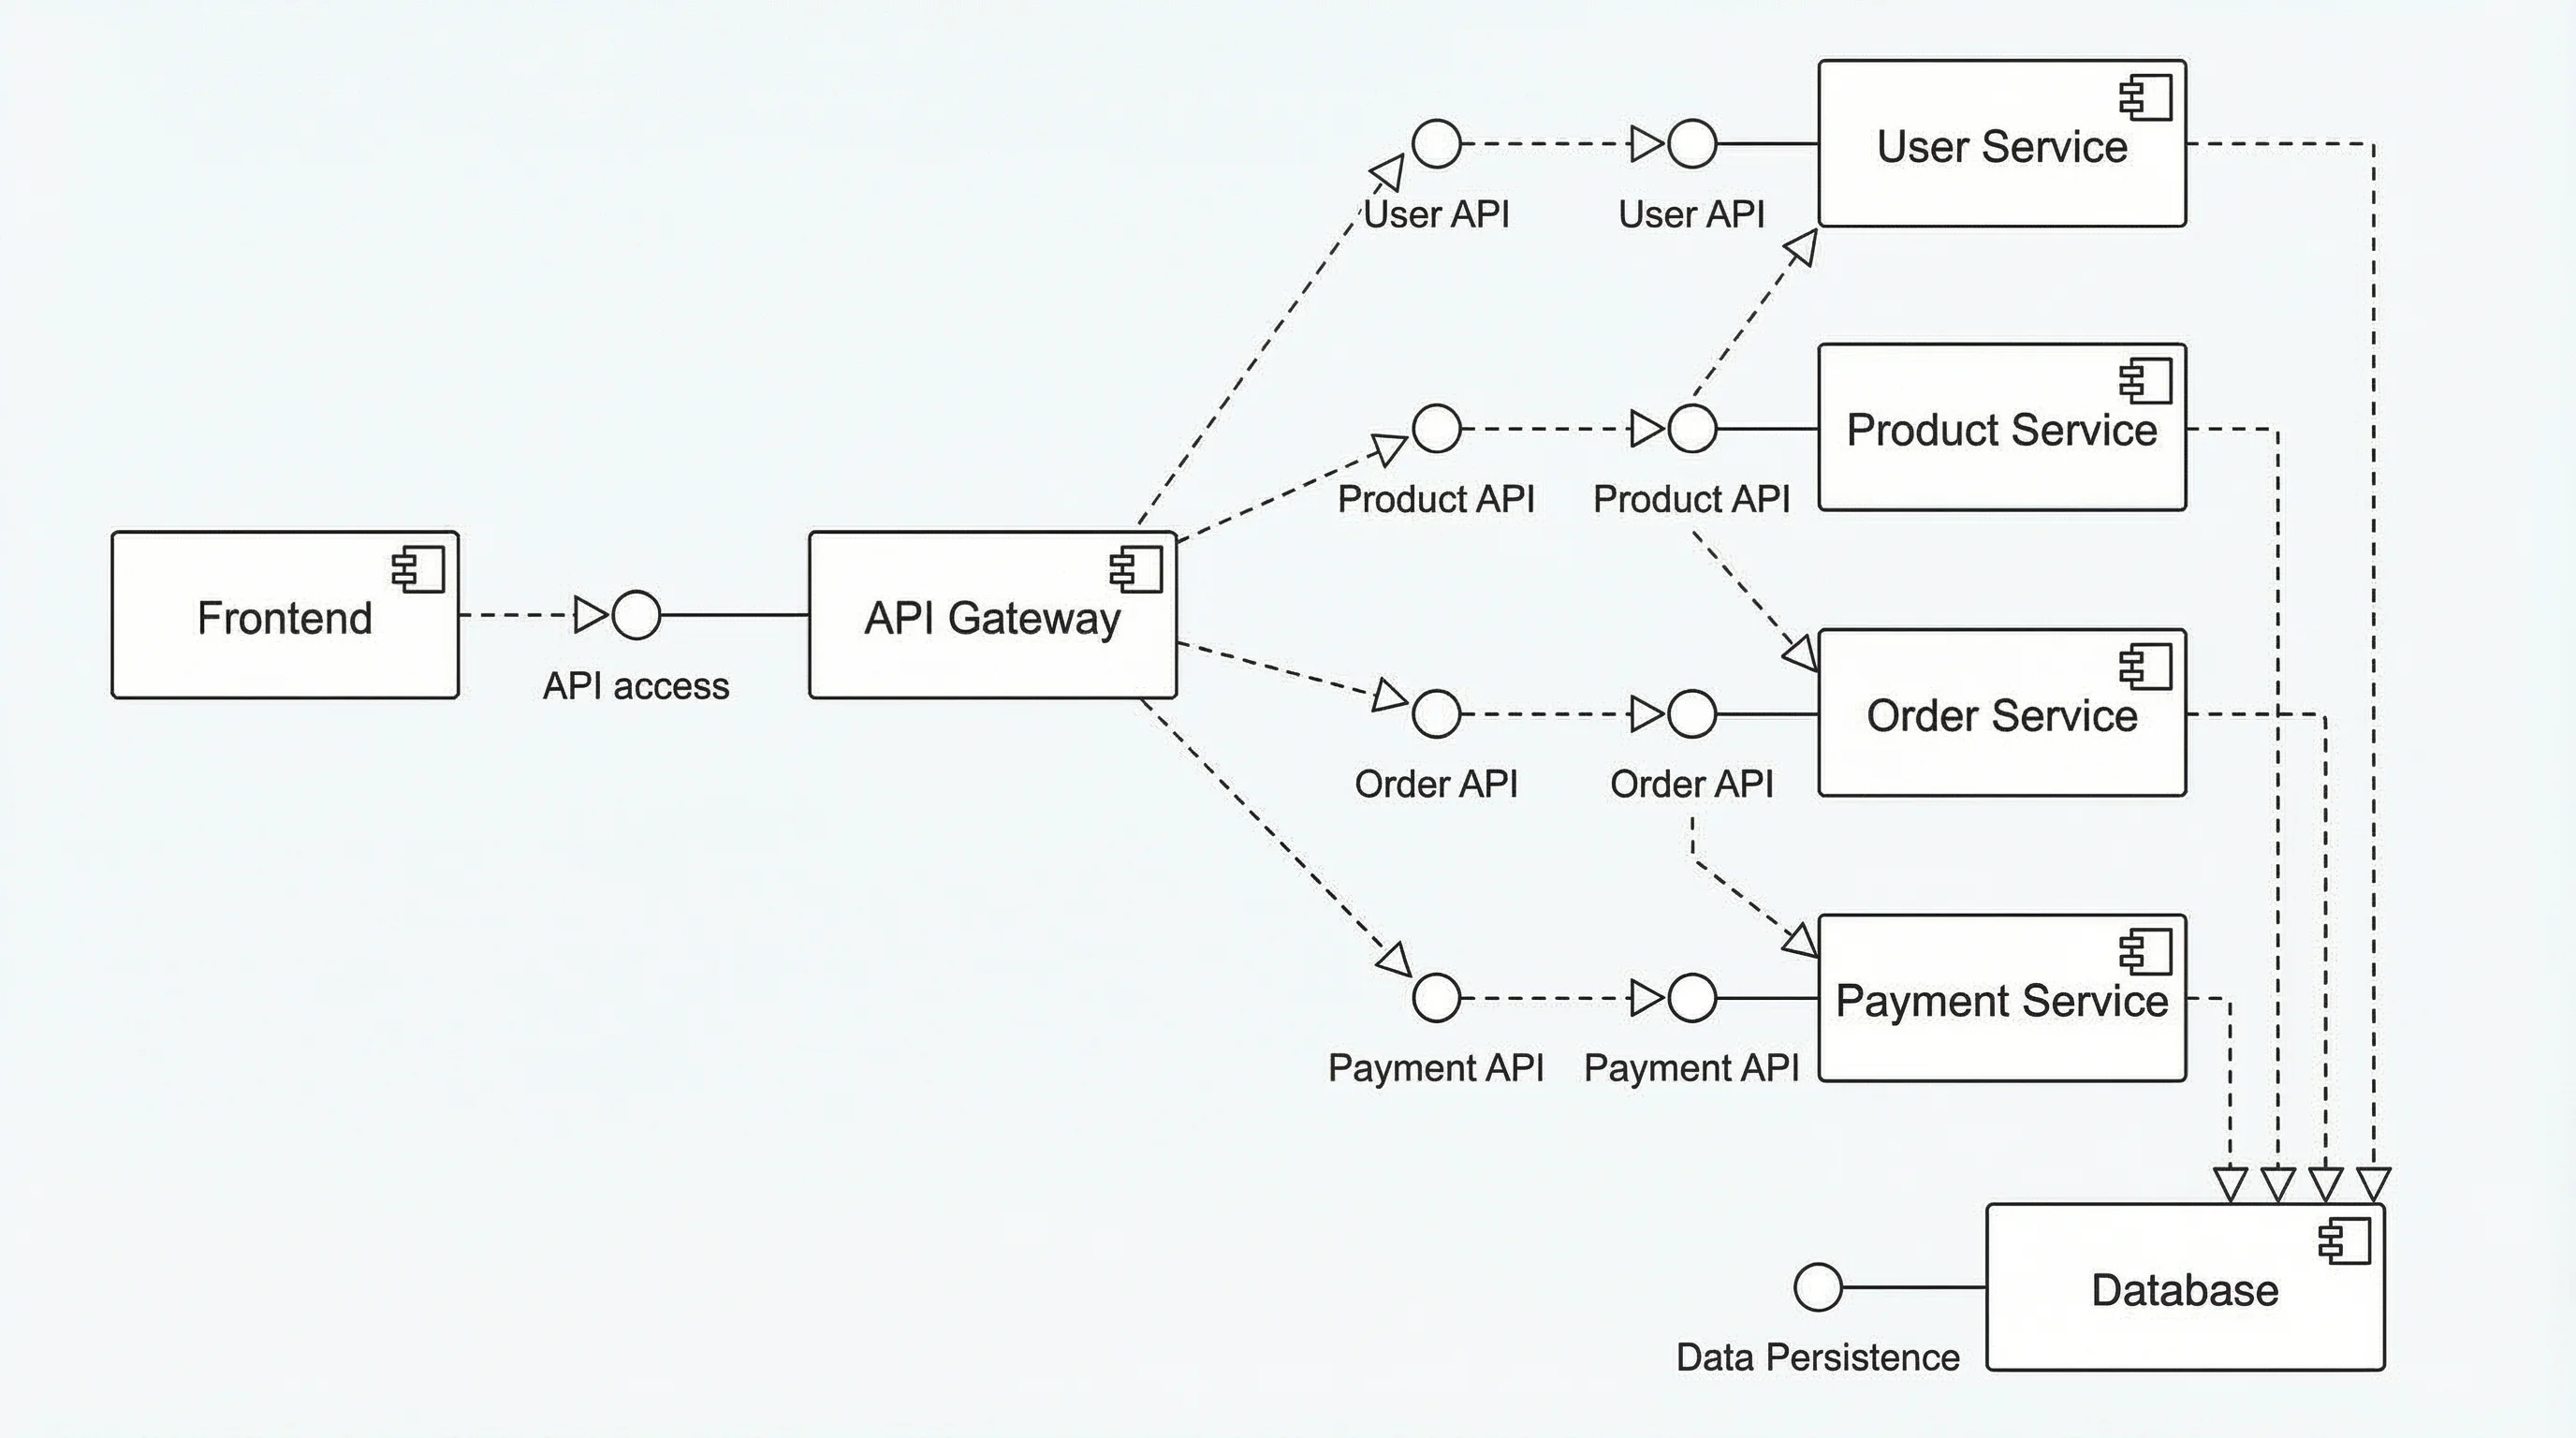
A component diagram visualizes the high-level architecture of a software system and its module dependencies
When to Use Component Diagrams
- Microservice architecture design
- Library and package dependency mapping
- System decomposition for large projects
- Third-party integration planning
- Deployment artifact organization
Best Free UML Diagram Tools Compared
Choosing the right tool can significantly impact your productivity. Here is a comparison of the best free UML diagramming tools available in 2026.
| Tool | Best For | UML Support | Collaboration | Price |
|---|---|---|---|---|
| ConceptViz | AI-powered text-to-UML | All 14 types via text | Export & share | Free tier available |
| draw.io (diagrams.net) | General-purpose diagramming | Full UML library | Real-time collaboration | Free |
| PlantUML | Code-based UML generation | All 14 types | Version control friendly | Free & open source |
| Lucidchart | Team collaboration | Full UML library | Real-time editing | Free tier (3 diagrams) |
| Mermaid.js | Developer-friendly markdown | Class, sequence, state, others | GitHub/GitLab rendering | Free & open source |
| Visual Paradigm Online | Comprehensive modeling | All 14 types | Team workspace | Free tier available |
| StarUML | Desktop UML modeling | All 14 types with extensions | Export only | Free evaluation |
Choosing the Right Tool
- For quick sketches: Use ConceptViz or Mermaid.js -- describe your diagram in text and get instant results
- For team projects: Lucidchart or draw.io offer real-time collaboration
- For developers: PlantUML or Mermaid.js integrate with version control
- For comprehensive modeling: Visual Paradigm or StarUML support the full UML specification
- For documentation: Mermaid.js embeds directly in Markdown files and renders on GitHub
Text to Diagram Generator
Convert text descriptions to professional diagrams instantly with AI.
UML Best Practices for Software Projects
Follow these guidelines to create UML diagrams that actually add value to your project:
1. Diagram with a Purpose
Every diagram should answer a specific question. Do not create diagrams just for the sake of documentation. Ask: "Who is the audience, and what decision does this diagram support?"
2. Keep It Simple
A diagram with 50 classes is not useful. Focus on the key elements relevant to the discussion. Use packages to group related classes and create separate detail diagrams for subsystems.
3. Use Consistent Notation
Mix notation styles confuse readers. Stick to standard UML symbols and document any custom stereotypes or conventions your team uses.
4. Maintain Your Diagrams
Outdated diagrams are worse than no diagrams. Treat UML artifacts as living documents. Tools like PlantUML that store diagrams as code make maintenance easier because they can be version-controlled alongside source code.
5. Start with Behavioral Diagrams
When beginning a new project, start with use case diagrams and activity diagrams to capture requirements. Move to class diagrams and sequence diagrams during design. Use deployment diagrams when planning infrastructure.
6. Connect Diagrams to Code
Modern tools can generate UML from code (reverse engineering) and code from UML (forward engineering). This bidirectional capability keeps diagrams and implementation in sync.
UML in Agile and Modern Development
Some teams view UML as a heavyweight, waterfall-era practice. However, UML remains highly relevant in agile workflows when applied pragmatically:
- User stories to use cases: Use case diagrams can map directly to user stories in your backlog
- Sprint design sessions: Quick sequence diagrams on whiteboards clarify API contracts before coding begins
- Architecture decision records: Class and component diagrams document key design decisions
- Continuous documentation: Tools like Mermaid.js let you embed diagrams in README files, keeping docs close to code
The key is to use UML as a communication tool, not a bureaucratic requirement. Create diagrams when they clarify understanding, and update or discard them when they no longer serve that purpose.
Frequently Asked Questions
What are the 14 types of UML diagrams?
UML includes 7 structural diagrams (class, object, component, deployment, package, composite structure, profile) and 7 behavioral diagrams (use case, activity, state machine, sequence, communication, interaction overview, timing). Class diagrams, sequence diagrams, and use case diagrams are the most commonly used in practice.
What is the difference between a class diagram and an object diagram?
A class diagram shows the abstract structure of classes, their attributes, methods, and relationships. An object diagram shows specific instances (objects) of those classes at a particular point in time with actual data values. Think of a class diagram as the blueprint and an object diagram as a snapshot of a running system.
When should I use a sequence diagram vs an activity diagram?
Use a sequence diagram when you need to show the message exchange between specific objects over time, such as an API call flow or authentication sequence. Use an activity diagram when you need to show the overall workflow or process flow, including decision points and parallel activities, without focusing on specific objects.
Can I create UML diagrams for free?
Yes. Several free tools support UML diagram creation, including draw.io (diagrams.net), PlantUML, Mermaid.js, and ConceptViz. Draw.io offers a full drag-and-drop editor, PlantUML and Mermaid.js generate diagrams from text descriptions, and ConceptViz uses AI to create UML diagrams from natural language prompts.
Is UML still relevant in 2026 with agile development?
Yes. While agile teams may not produce comprehensive UML models upfront, UML diagrams remain valuable for clarifying complex interactions (sequence diagrams), documenting architecture decisions (component diagrams), onboarding new team members (class diagrams), and communicating requirements to stakeholders (use case diagrams). The key is using UML pragmatically, not as mandatory ceremony.
What is the best UML diagram for documenting REST APIs?
Sequence diagrams are the best UML diagram type for REST APIs. They show the exact request/response flow between client, server, database, and any middleware or external services, including the order of operations, synchronous vs asynchronous calls, and error handling paths.
How do I convert a UML class diagram to code?
Many UML tools support forward engineering, which generates code from class diagrams. Each class becomes a code class or interface, attributes become fields/properties, methods become function signatures, and relationships become references, collections, or inheritance. Tools like StarUML, Visual Paradigm, and Enterprise Architect support this feature. You can also manually translate the diagram following your language's conventions.
What is the difference between aggregation and composition in UML?
Both represent 'has-a' relationships, but they differ in lifecycle dependency. Aggregation (open diamond) means the part can exist independently of the whole--for example, a University has Professors, but professors exist without the university. Composition (filled diamond) means the part cannot exist without the whole--for example, a House has Rooms, and rooms do not exist independently of the house.
Conclusion
UML diagrams remain the industry standard for visualizing software architecture, documenting system behavior, and communicating technical designs across teams. Of the 14 diagram types, class diagrams, sequence diagrams, and use case diagrams cover the vast majority of day-to-day modeling needs.
Key takeaways:
- Start with use case diagrams to capture requirements and define system scope
- Use class diagrams to design your data model and object-oriented architecture
- Create sequence diagrams to document API flows and complex interactions
- Add activity and state machine diagrams for workflows and object lifecycles
- Choose the right tool -- text-based tools like PlantUML for developers, visual editors like draw.io for teams
- Keep diagrams purposeful -- every diagram should answer a specific question for a specific audience
Whether you are designing a new microservice, documenting a legacy system, or planning your next sprint, UML gives you the visual vocabulary to communicate complex ideas clearly.
Additional Resources
- How to Make Scientific Diagrams for Research Papers
- ER Diagram Guide: How to Design Entity-Relationship Diagrams
- How to Convert Mermaid Diagrams to Images
- Mapping Diagram Complete Guide
Ready to create your UML diagram? Try ConceptViz's UML Diagram Generator to transform text descriptions into professional UML diagrams instantly.
Categories
More Posts
")
How to Draw a Volcano: Step-by-Step (Easy Labeled Diagram)
Learn how to draw a volcano step by step — an easy labeled cross-section for science class. Simple shapes for the cone, magma chamber, conduit, vent, and erupting ash cloud, plus a free instant generator.

How to Draw a Neural Network Architecture Diagram: A Complete Guide
Learn how to draw neural network architecture diagrams for CNNs, RNNs, Transformers, and more. Step-by-step guide with tools, examples, and best practices for researchers and engineers.
")
How to Diagram a Sentence: Complete Guide with Examples & Free Generator (2026)
Master sentence diagramming with our step-by-step Reed-Kellogg guide. See 15+ examples from simple to complex — or use our free AI sentence diagram generator.