
Molecular Orbital Diagrams Explained: Bonding & Bond Order
Learn how to read and draw a molecular orbital diagram: bonding vs antibonding orbitals, filling electrons, and calculating bond order, with H2, N2, and O2 examples.
A molecular orbital (MO) diagram shows what happens to electrons when atoms bond. Instead of staying on one atom, the atomic orbitals combine into molecular orbitals that belong to the whole molecule — and the diagram lets you predict bond strength, stability, and even magnetism.
This guide explains how to read and build an MO diagram: what bonding and antibonding orbitals are, how to fill in electrons, and how to calculate bond order, with worked examples for H₂, N₂, and O₂.
Quick Answer: What Is a Molecular Orbital Diagram?
A molecular orbital diagram is an energy-level chart for a molecule. The atomic orbitals of each atom are drawn on the left and right, and the molecular orbitals they form are drawn in the center, ordered by energy. Electrons are then filled into the molecular orbitals from lowest energy upward.
Each pair of atomic orbitals that combine produces two molecular orbitals: a lower-energy bonding orbital and a higher-energy antibonding orbital.
Bonding vs Antibonding Orbitals
When two atomic orbitals overlap, their wave functions can combine in two ways:
- Bonding orbital (in-phase, constructive): electron density builds up between the two nuclei, holding them together. It is lower in energy than the original atomic orbitals, so filling it stabilizes the molecule. Labeled σ or π.
- Antibonding orbital (out-of-phase, destructive): a node forms between the nuclei and electron density is pushed away, weakening the bond. It is higher in energy, so filling it destabilizes the molecule. Labeled σ* or π* (with an asterisk).
The key idea: bonding orbitals lower the energy and hold the molecule together; antibonding orbitals raise it and pull it apart.
How to Read and Build an MO Diagram
- Draw the atomic orbitals of each atom on the left and right at their relative energies.
- Combine them into molecular orbitals in the center — each combination gives one bonding and one antibonding MO.
- Order the MOs by energy from bottom (most stable) to top.
- Count the valence electrons from both atoms.
- Fill the MOs from lowest energy up, following the Aufbau principle, Pauli exclusion, and Hund's rule (one electron in each orbital of equal energy before pairing).
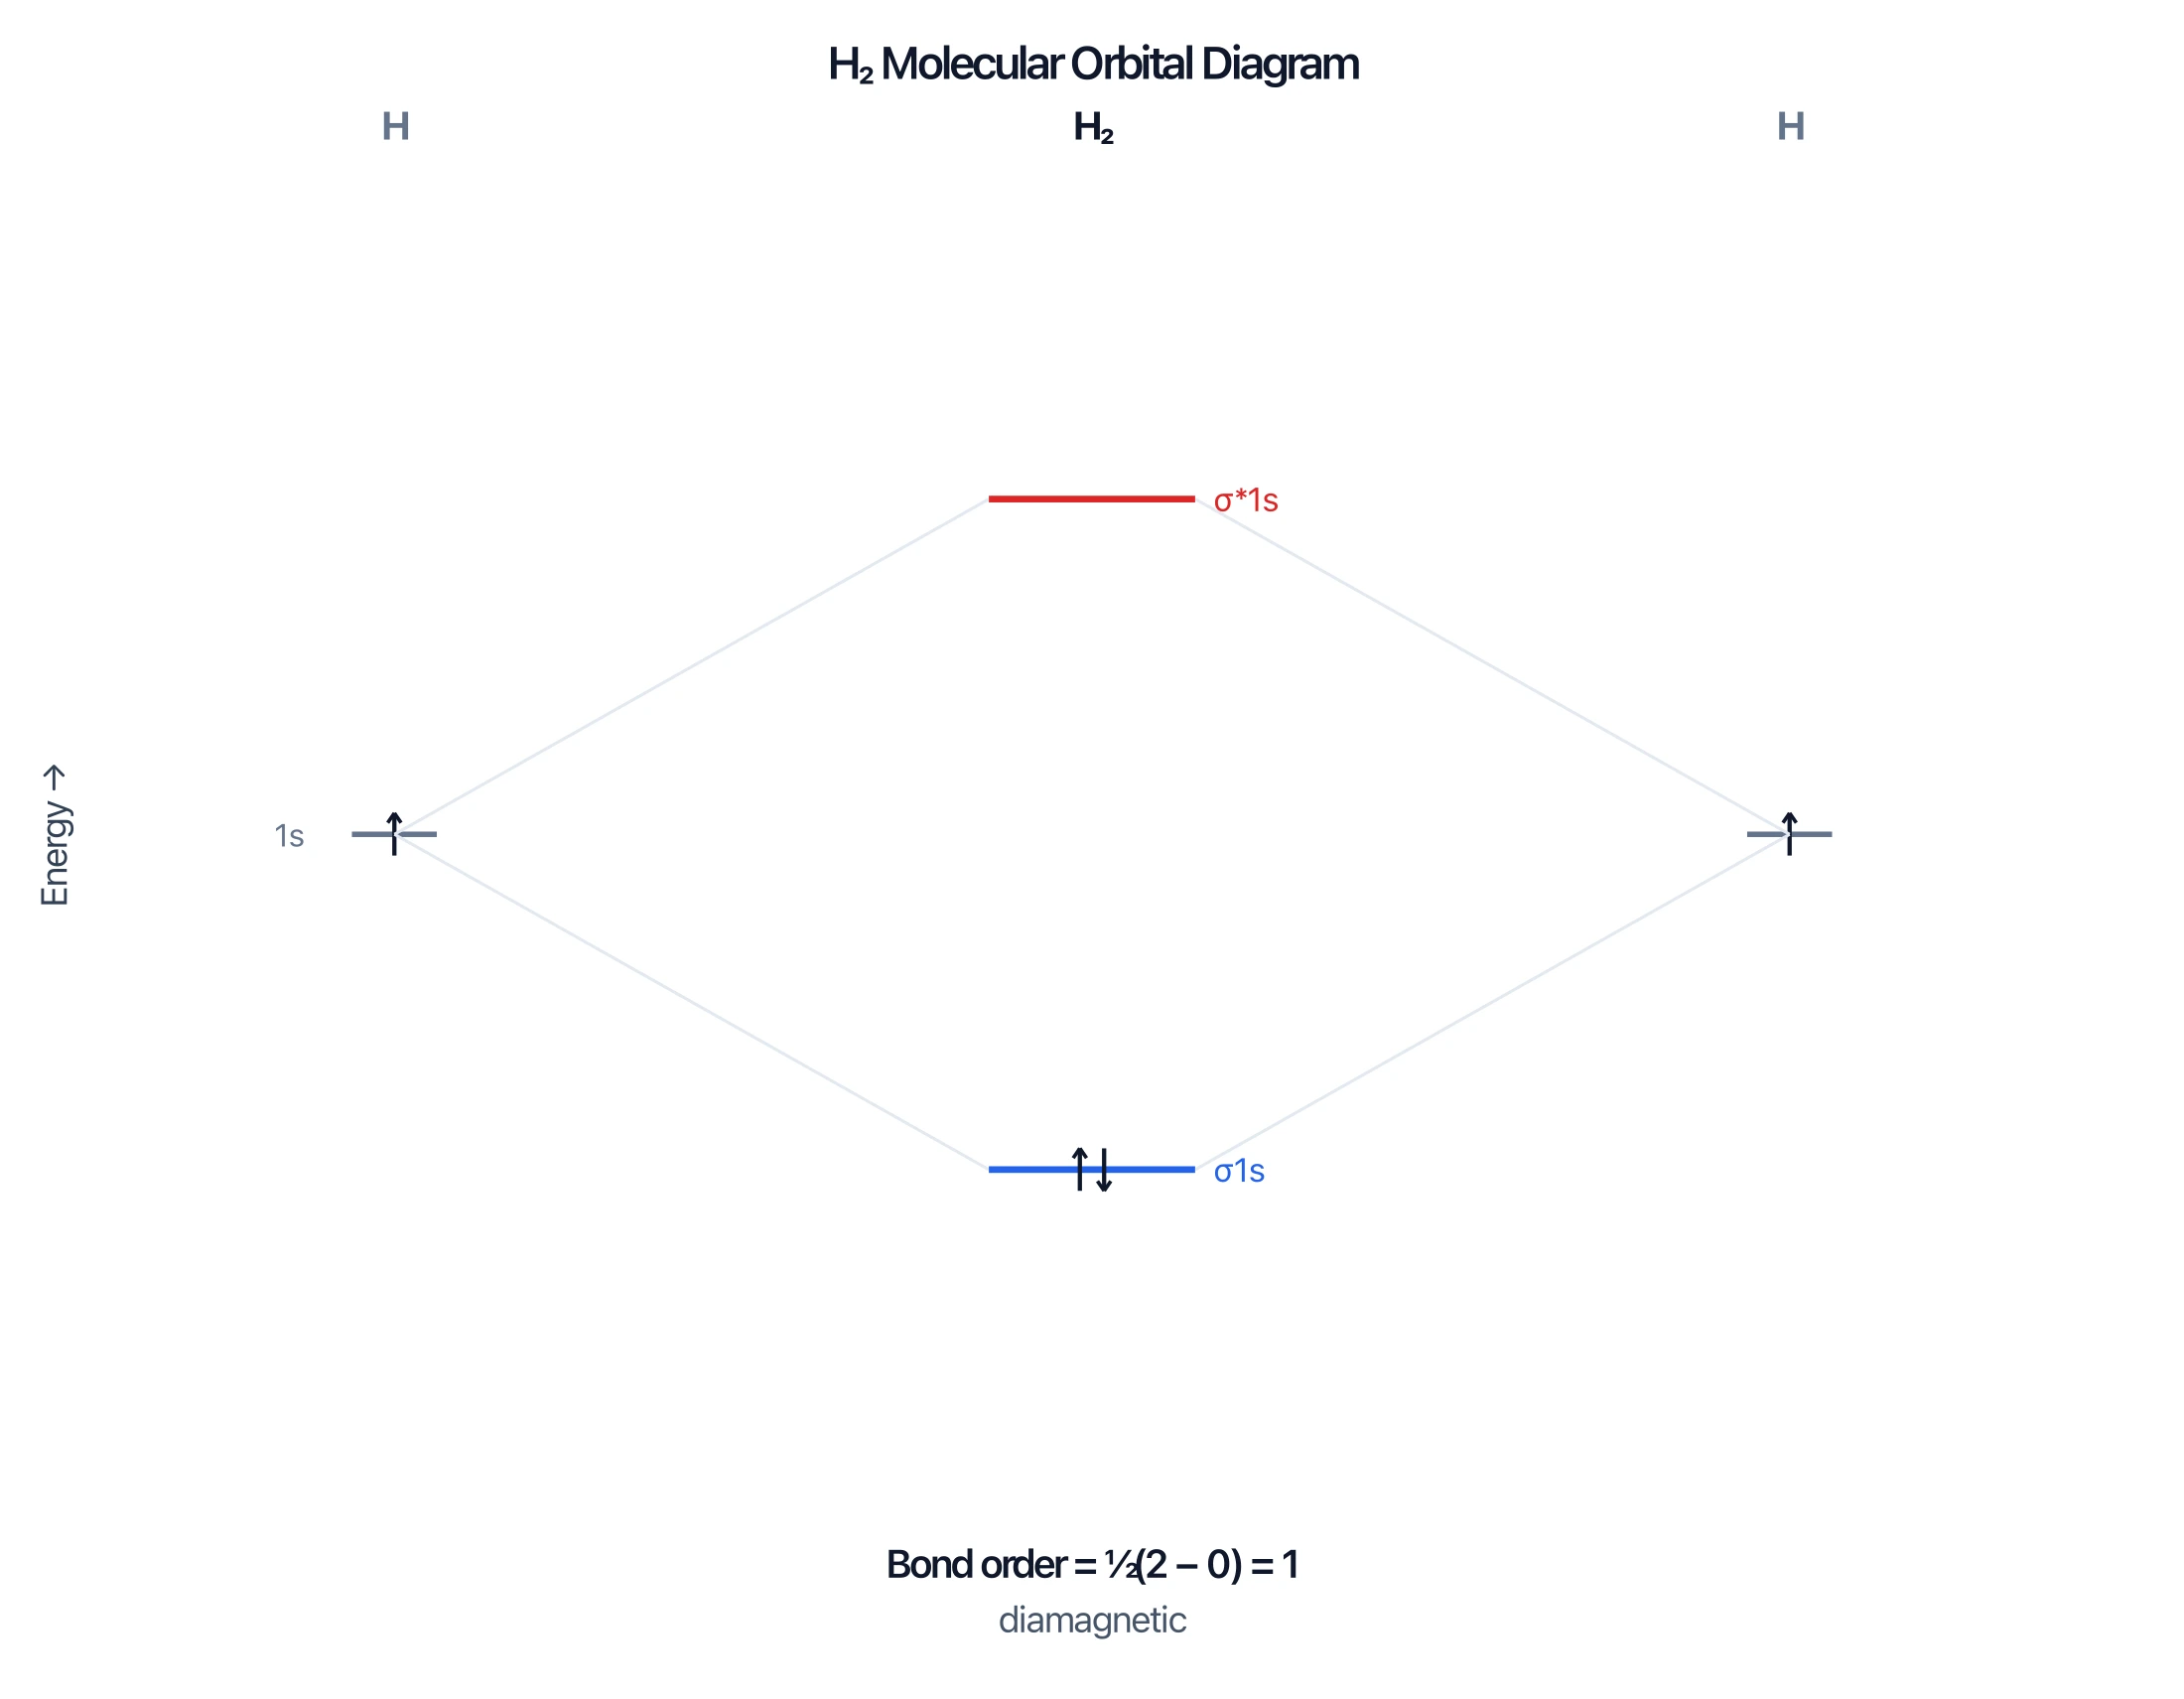
In H₂, the two 1s orbitals form a σ bonding orbital and a σ* antibonding orbital. Both electrons go into the bonding σ, giving a stable single bond.
Molecular Orbital Diagram Generator
Build MO diagrams for diatomic molecules with electrons filled in, plus bond order and magnetism, and download them free as SVG or PNG.
Make an MO diagram ->Calculating Bond Order
Bond order tells you how many bonds hold the molecule together and how stable it is:
Bond order = ½ × (bonding electrons − antibonding electrons)
A higher bond order means a stronger, shorter bond. A bond order of zero means the molecule will not form (for example, He₂). For H₂, bond order = ½ × (2 − 0) = 1, a single bond.
Worked Example: O₂ and Paramagnetism
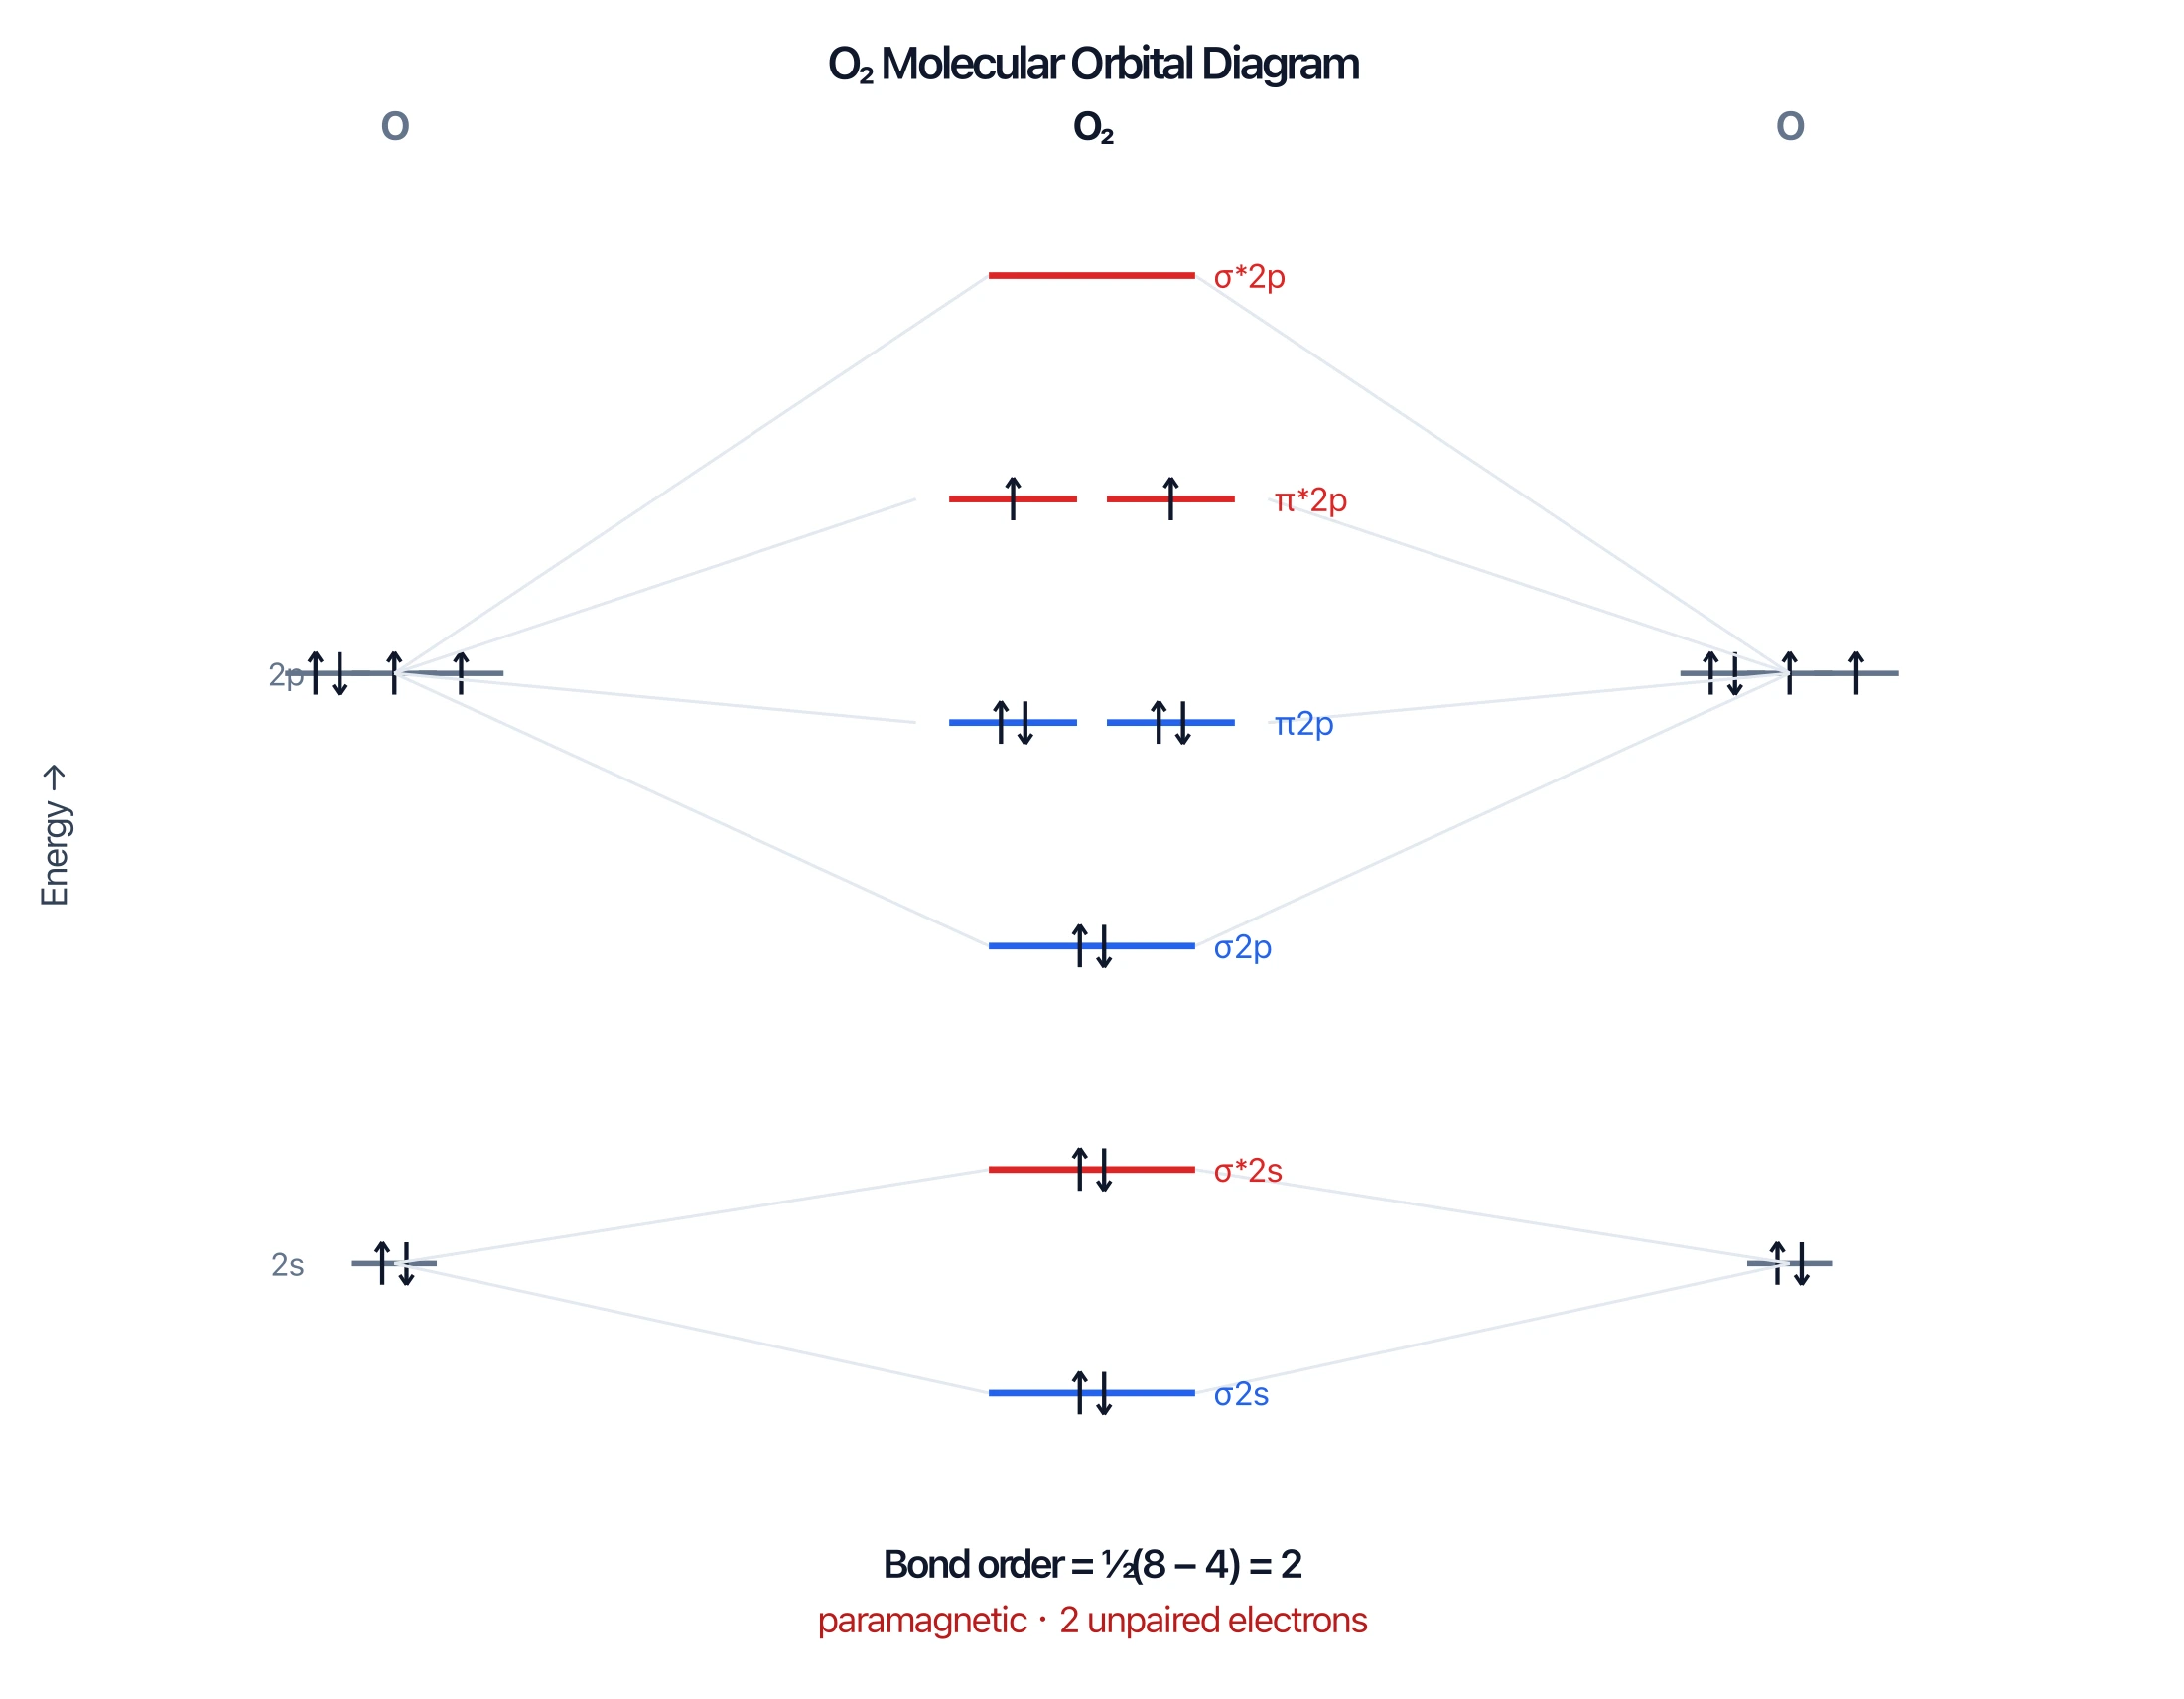
Oxygen is the classic reason MO theory beats simple Lewis structures. Filling the MO diagram for O₂ places the last two electrons singly into the two degenerate π*2p antibonding orbitals (Hund's rule), leaving two unpaired electrons. That makes O₂ paramagnetic — it is attracted to a magnet — which a Lewis structure cannot explain.
For O₂, bond order = ½ × (8 − 4) = 2, a double bond, with two unpaired electrons.
Worked Example: N₂
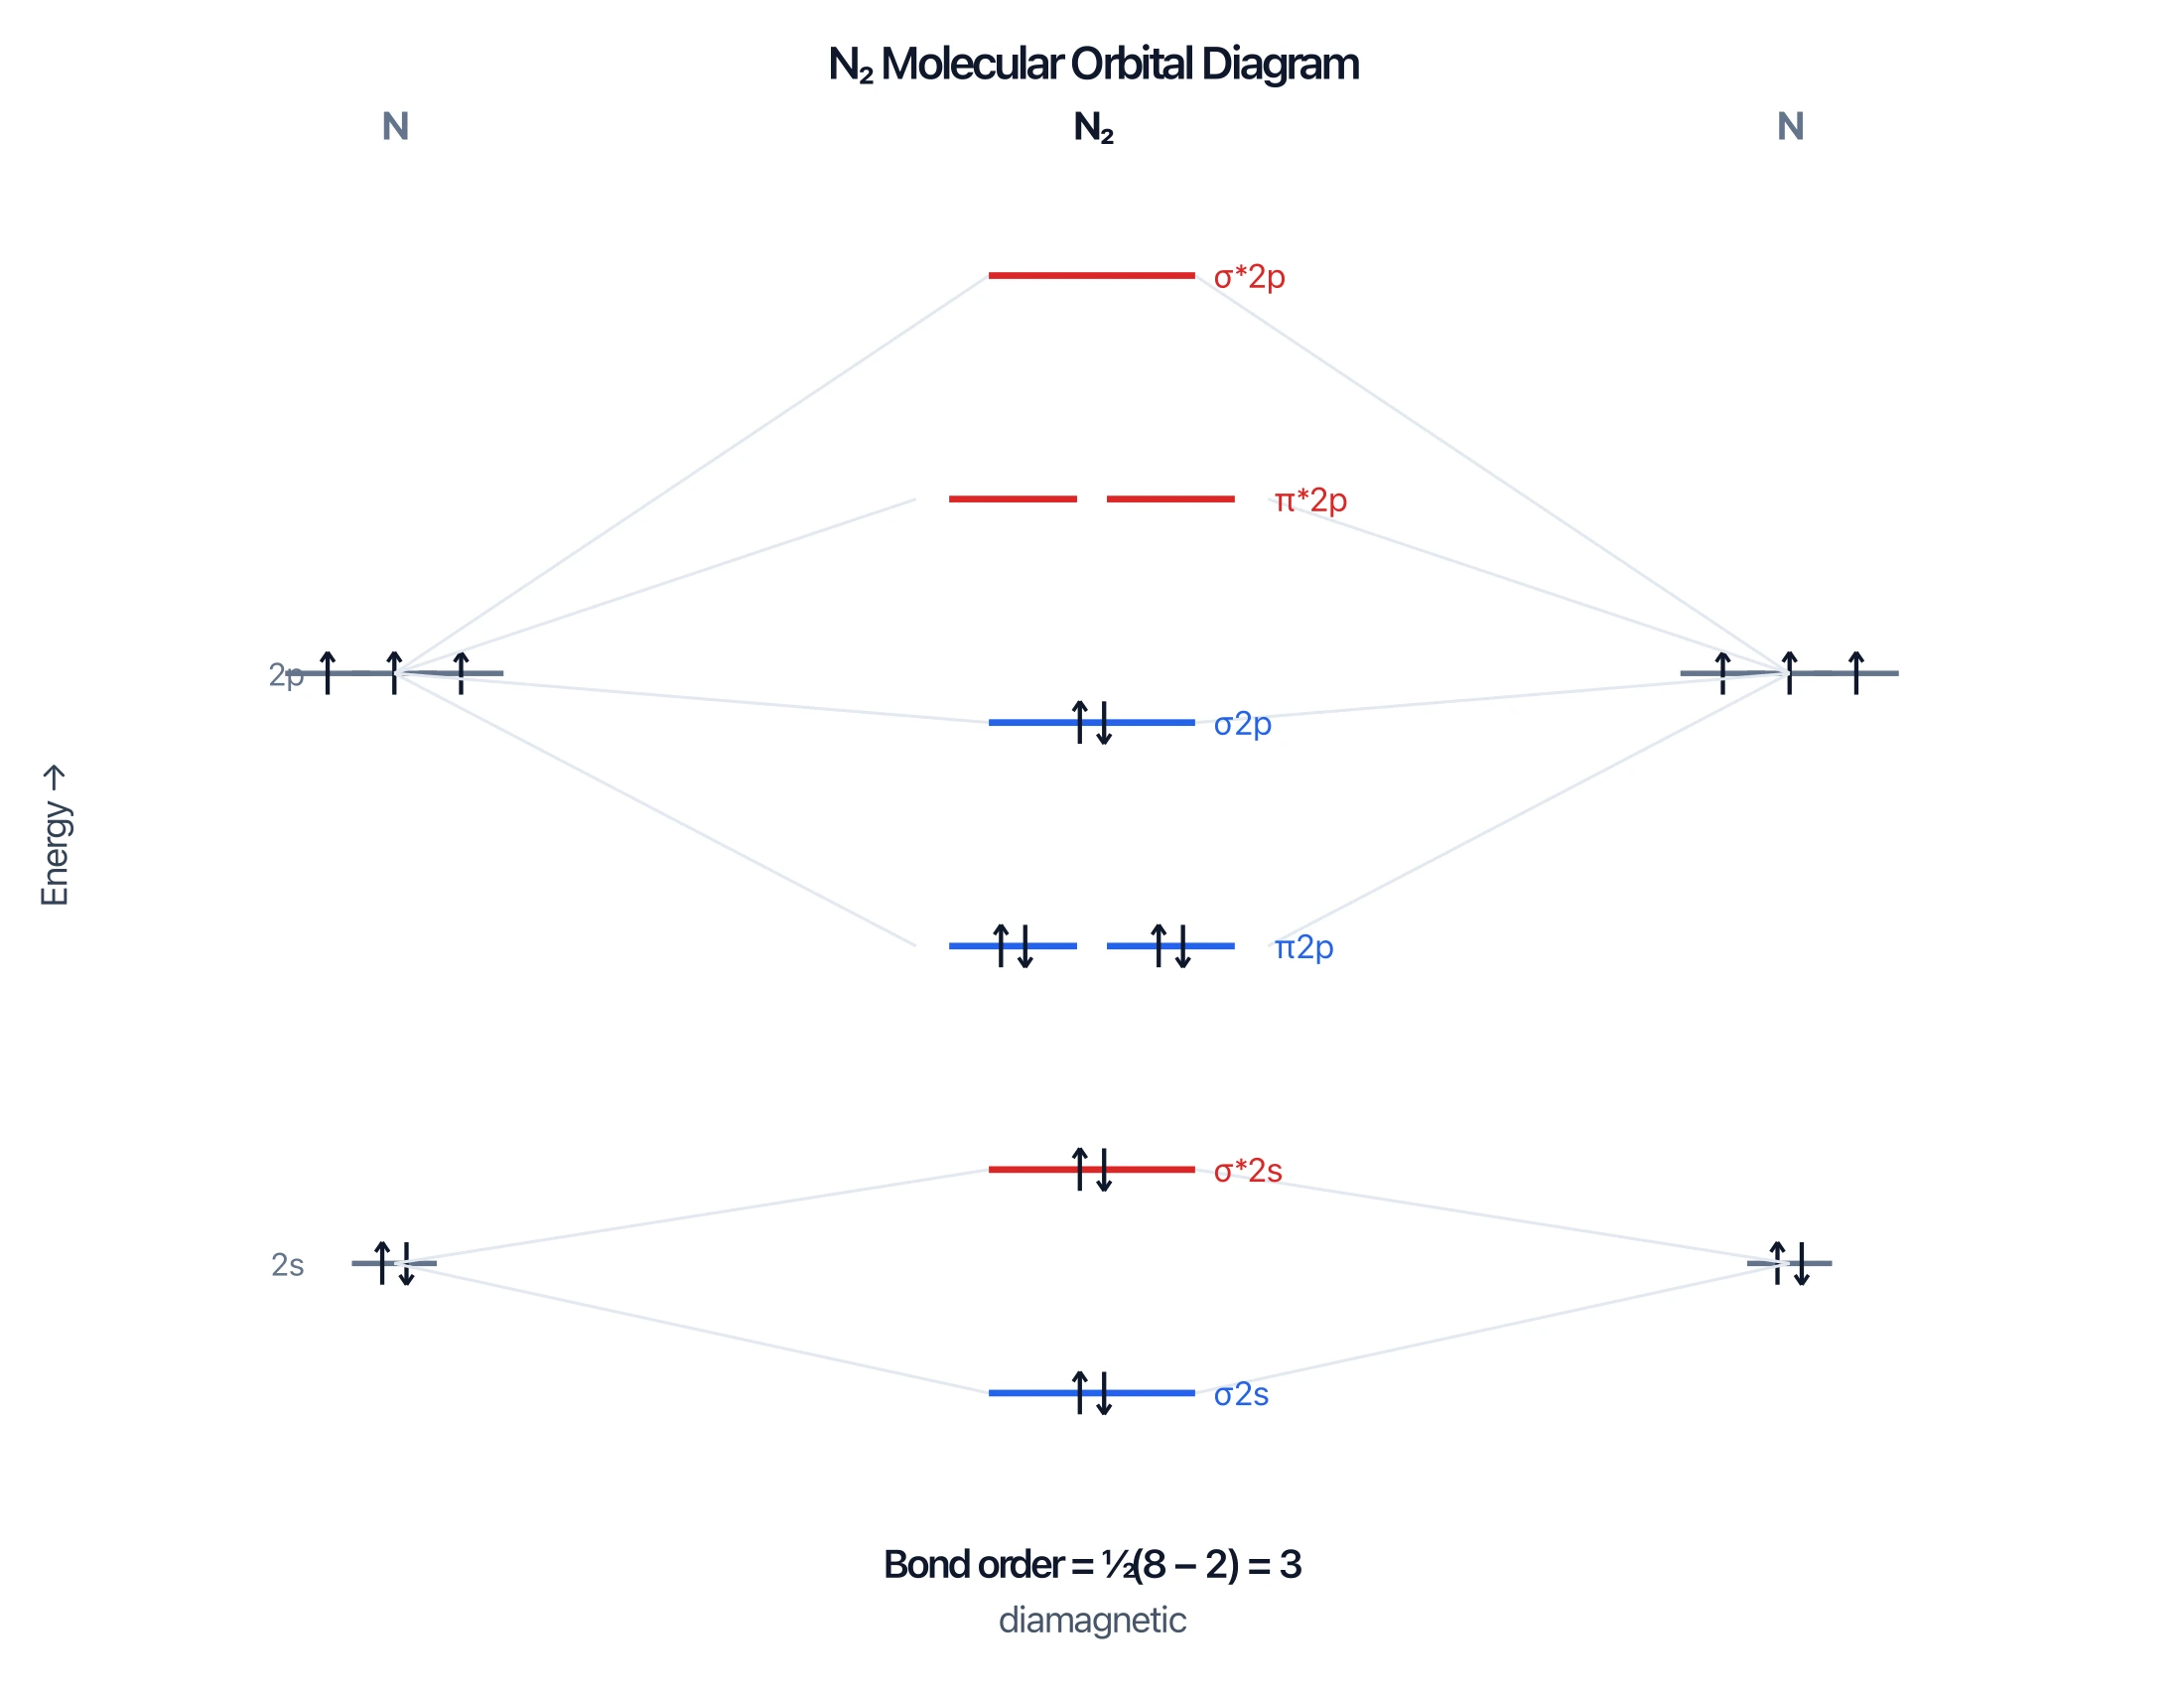
Nitrogen fills its bonding orbitals completely and leaves the antibonding 2p orbitals empty, giving bond order = ½ × (8 − 2) = 3 — a very strong triple bond, which is why N₂ is so unreactive. All electrons are paired, so N₂ is diamagnetic.
A Note on Orbital Ordering (s-p Mixing)
For the second-row diatomics up to N₂ (B₂, C₂, N₂), s–p mixing pushes the σ2p above the π2p orbitals. For O₂ and F₂, the σ2p drops below the π2p. Using the wrong order changes where the last electrons go, so always check which side of the "crossover" your molecule is on.
Common Mistakes
- Forgetting antibonding electrons in bond order. You subtract them — leaving them out inflates the bond order.
- Using the wrong MO ordering. B₂–N₂ and O₂–F₂ have different σ/π orderings because of s–p mixing.
- Ignoring Hund's rule. Degenerate π orbitals each get one electron before any pairs up — this is what makes O₂ paramagnetic.
- Mixing up σ and π. Head-on overlap gives σ; sideways overlap gives π.
FAQ
What does a molecular orbital diagram show?
It shows how atomic orbitals combine into molecular orbitals, the relative energies of those orbitals, and how a molecule's electrons fill them. From it you can read bond order, stability, and magnetism.
What is the difference between bonding and antibonding orbitals?
Bonding orbitals form from in-phase overlap, concentrate electron density between the nuclei, and lower the energy (stabilizing). Antibonding orbitals (marked with *) form from out-of-phase overlap, have a node between the nuclei, and raise the energy (destabilizing).
How do you calculate bond order from an MO diagram?
Bond order = ½ × (number of bonding electrons − number of antibonding electrons). A higher value means a stronger, shorter bond; zero means no stable molecule.
Why is O₂ paramagnetic?
Because its MO diagram places two electrons singly in the degenerate π*2p antibonding orbitals, giving two unpaired electrons. Unpaired electrons make O₂ attracted to a magnetic field — something a Lewis structure cannot show.
Why does the orbital order change between N₂ and O₂?
Because of s–p mixing. For B₂, C₂, and N₂ the σ2p sits above the π2p; for O₂ and F₂ the σ2p sits below the π2p.
Further Reading
分类
更多文章
")
Research Data Visualization: Best Practices & Tools for Scientists (2026 Guide)
Master scientific data visualization with proven best practices. Learn to choose the right charts, use color effectively, and discover free tools for creating publication-ready figures.

How to Make a Schematic Diagram: Step-by-Step Guide for Scientists and Students
Learn how to make a schematic diagram for science, lab experiments, and research. Step-by-step guide covering rules, symbols, software tools, and examples for biology, chemistry, and physics.

What Is a Particulate Diagram? Particle Models Explained
A particulate diagram shows matter as individual particles. Learn how particle diagrams represent solids, liquids, gases, elements, compounds, and mixtures, with examples.