
Heating Curve of Water Explained: The 5 Stages
Understand the heating curve of water step by step: what the axes mean, why the plateaus are flat, and how specific heat and latent heat shape each of the five stages.
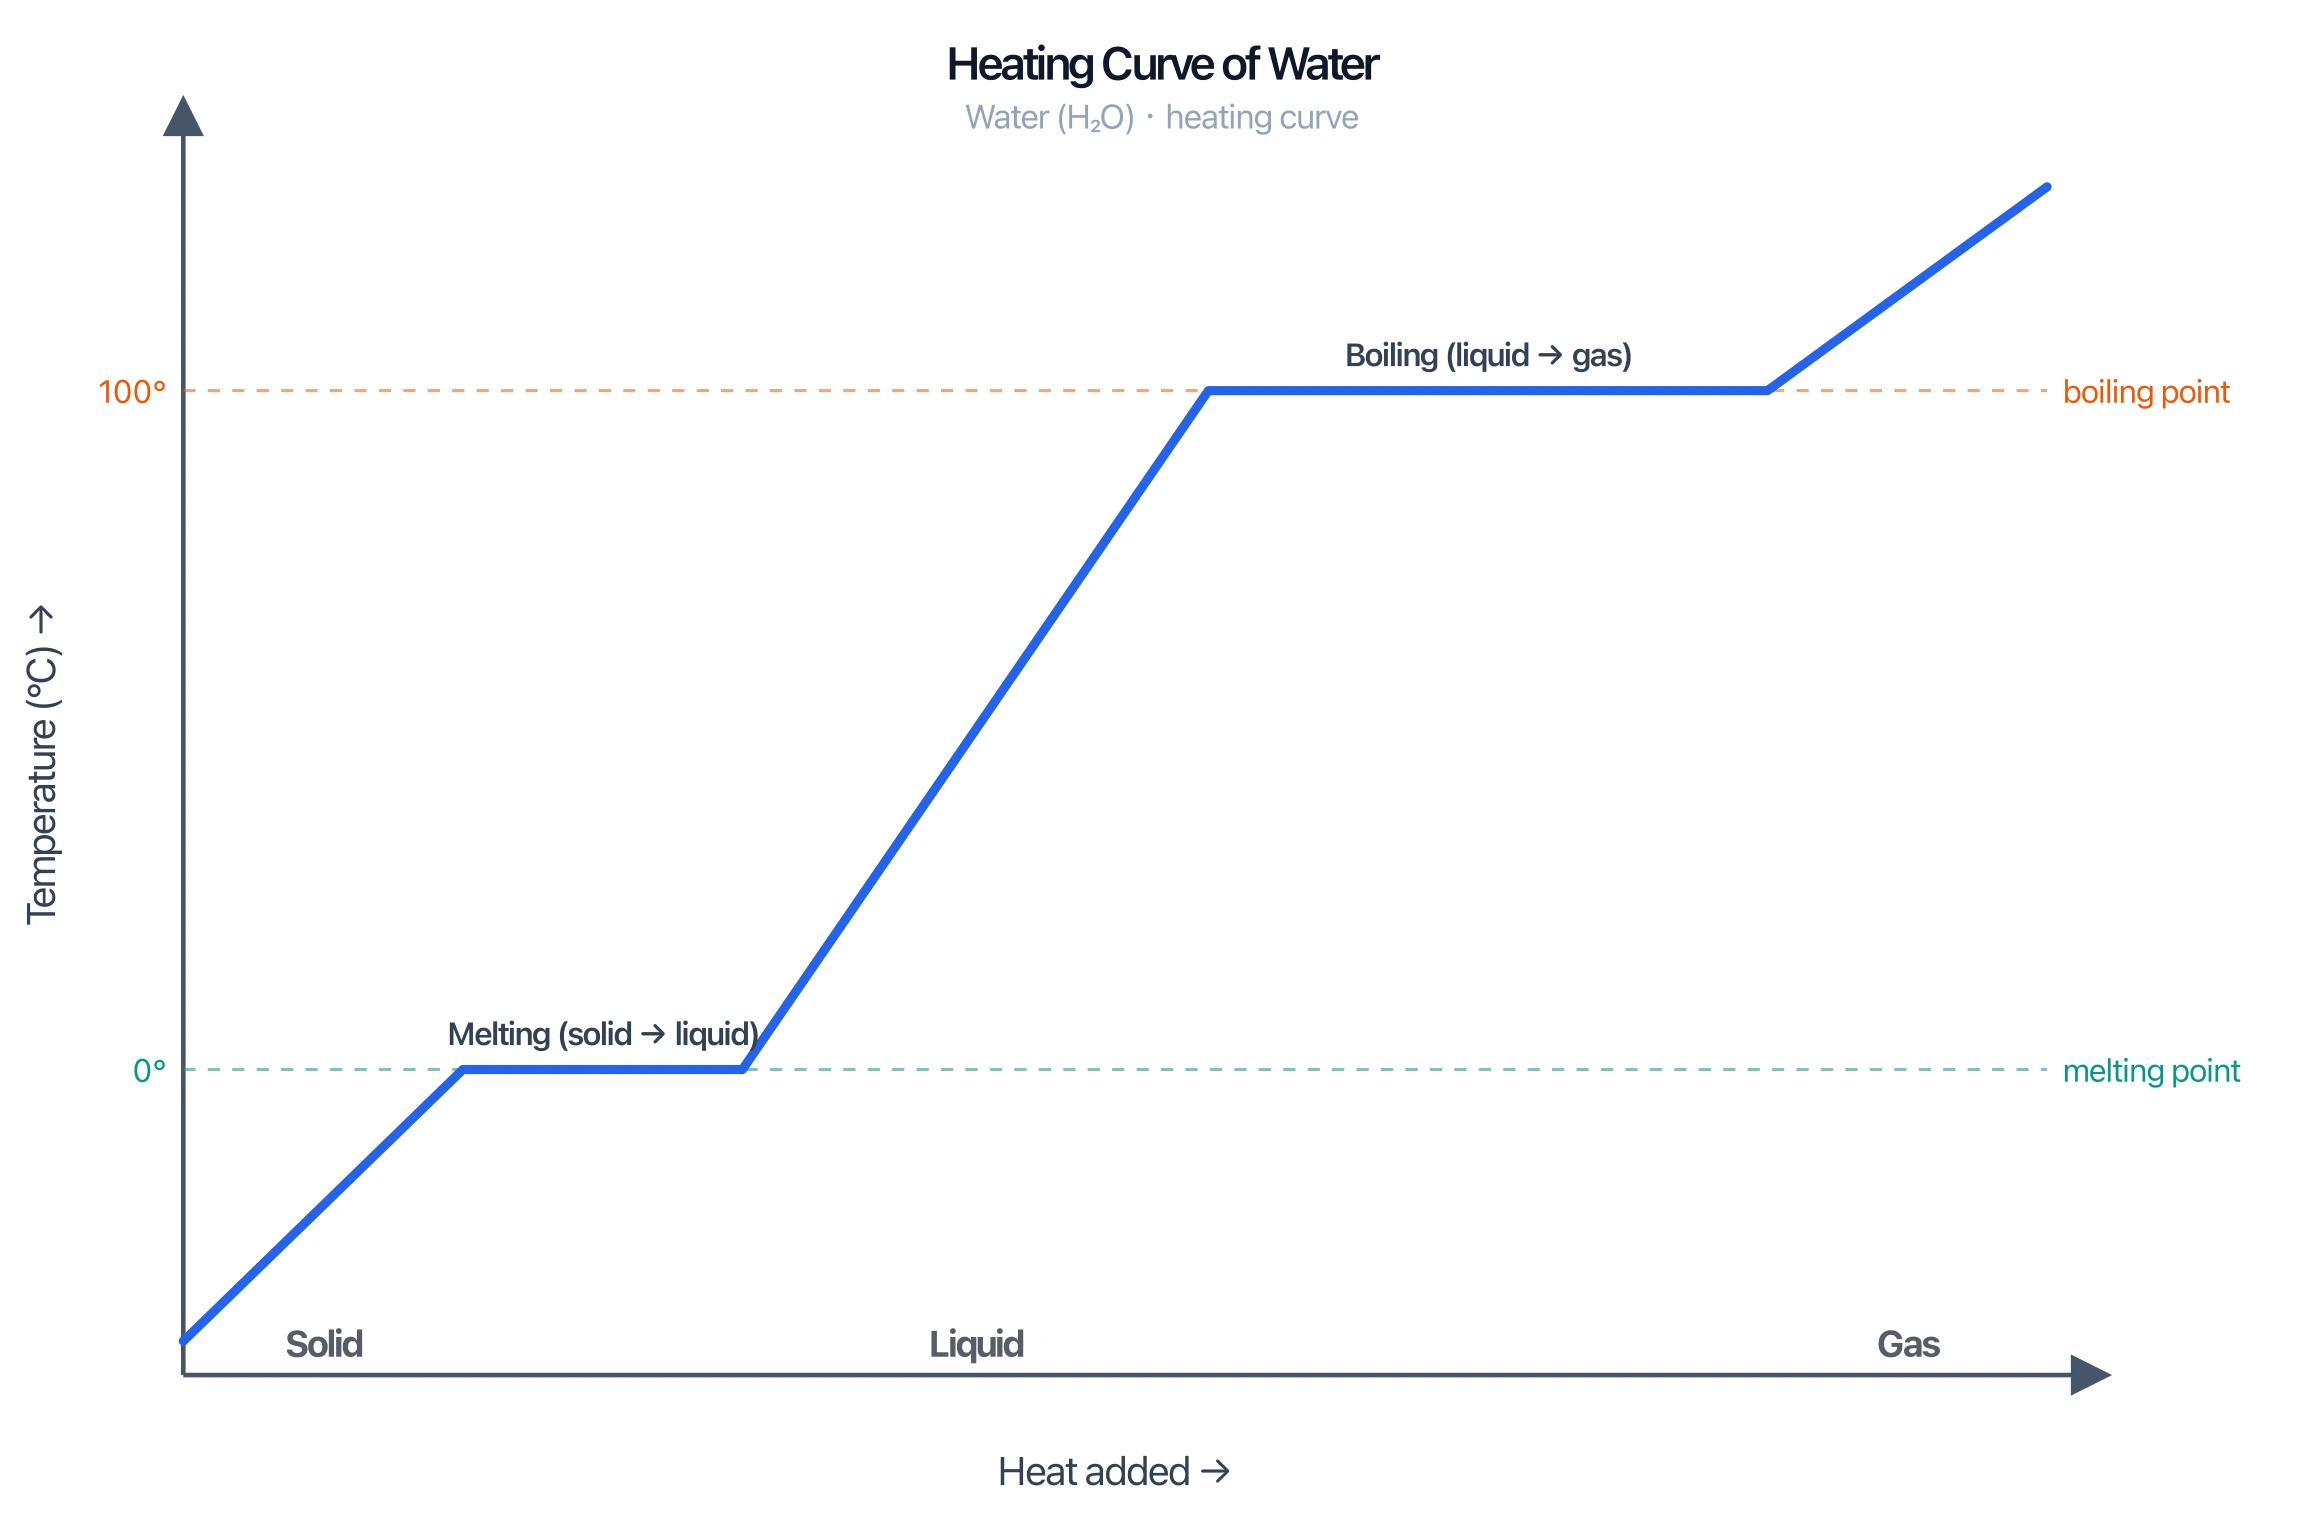
A heating curve shows what happens to the temperature of a substance as heat is added at a constant rate. For water it is one of the most useful diagrams in chemistry, because it makes two ideas visible at once: temperature rising as a substance warms, and temperature holding steady while it changes state.
This guide explains the heating curve of water stage by stage — what the axes mean, why the curve has flat plateaus, and how specific heat and latent heat control the shape.
Quick Answer: What Does a Heating Curve Show?
A heating curve plots temperature (y-axis) against heat added (x-axis). As heat goes in, the temperature rises during a single phase (sloped lines) but stays constant during a phase change (flat plateaus), because the energy is used to break intermolecular forces instead of raising temperature.
For water at standard pressure the two plateaus sit at 0 °C (melting/freezing) and 100 °C (boiling/condensing).
The Heating Curve of Water Diagram
The diagram below shows the full curve for water heated from ice to steam. The sloped sections are where a single phase warms up; the flat sections are where a phase change happens.
Heating Curve Generator
Build labeled heating and cooling curves and phase-change diagrams for any substance, then download them free as SVG or PNG.
Make a heating curve ->The 5 Stages of Water's Heating Curve
Stage 1 — Heating the solid (ice)
Starting below 0 °C, added heat raises the temperature of the ice. The line slopes upward; its steepness depends on the specific heat capacity of ice (about 2.09 J/g·°C).
Stage 2 — Melting (the first plateau, 0 °C)
At 0 °C the temperature stops rising even though heat is still being added. The energy goes into breaking the rigid structure of the ice so it can become liquid. This flat section corresponds to the heat (enthalpy) of fusion. The temperature stays at 0 °C until all the ice has melted.
Stage 3 — Heating the liquid (water)
Once everything is liquid, the temperature climbs again. The slope here is gentler than for ice because the specific heat of liquid water is higher (4.18 J/g·°C) — it takes more energy to raise its temperature by each degree.
Stage 4 — Boiling (the second plateau, 100 °C)
At 100 °C the temperature again holds steady while the water turns to steam. This longer plateau corresponds to the heat of vaporization, which is much larger than the heat of fusion — separating molecules into a gas takes far more energy than loosening them into a liquid.
Stage 5 — Heating the gas (steam)
After all the water has vaporized, the temperature of the steam rises. The slope reflects the specific heat of steam (about 2.01 J/g·°C).

Why Are the Plateaus Flat?
During a phase change, added energy does not increase the kinetic energy of the molecules (which is what temperature measures). Instead it increases their potential energy by overcoming the intermolecular forces holding them together.
So while ice is melting or water is boiling, the heat is doing the work of separating molecules, not speeding them up — and the thermometer reads a constant temperature until the change is complete. This energy is called latent heat ("hidden" heat) because it produces no temperature change.
Specific Heat vs Latent Heat
The two parts of the curve are governed by two different quantities:
- Sloped sections (warming a phase) use the equation
q = m·c·ΔT, wherecis the specific heat capacity. A larger specific heat means a gentler slope. - Flat sections (changing phase) use
q = m·ΔH, whereΔHis the heat of fusion (melting) or heat of vaporization (boiling). A largerΔHmeans a longer plateau.
This is why water's boiling plateau is longer than its melting plateau: the heat of vaporization of water is much greater than its heat of fusion.
Heating Curve vs Cooling Curve
A cooling curve is the mirror image of a heating curve. Instead of adding heat you remove it, so the temperature falls, with plateaus at the same temperatures — this time for condensing (gas → liquid) and freezing (liquid → solid). The plateaus appear because energy is released during these phase changes.
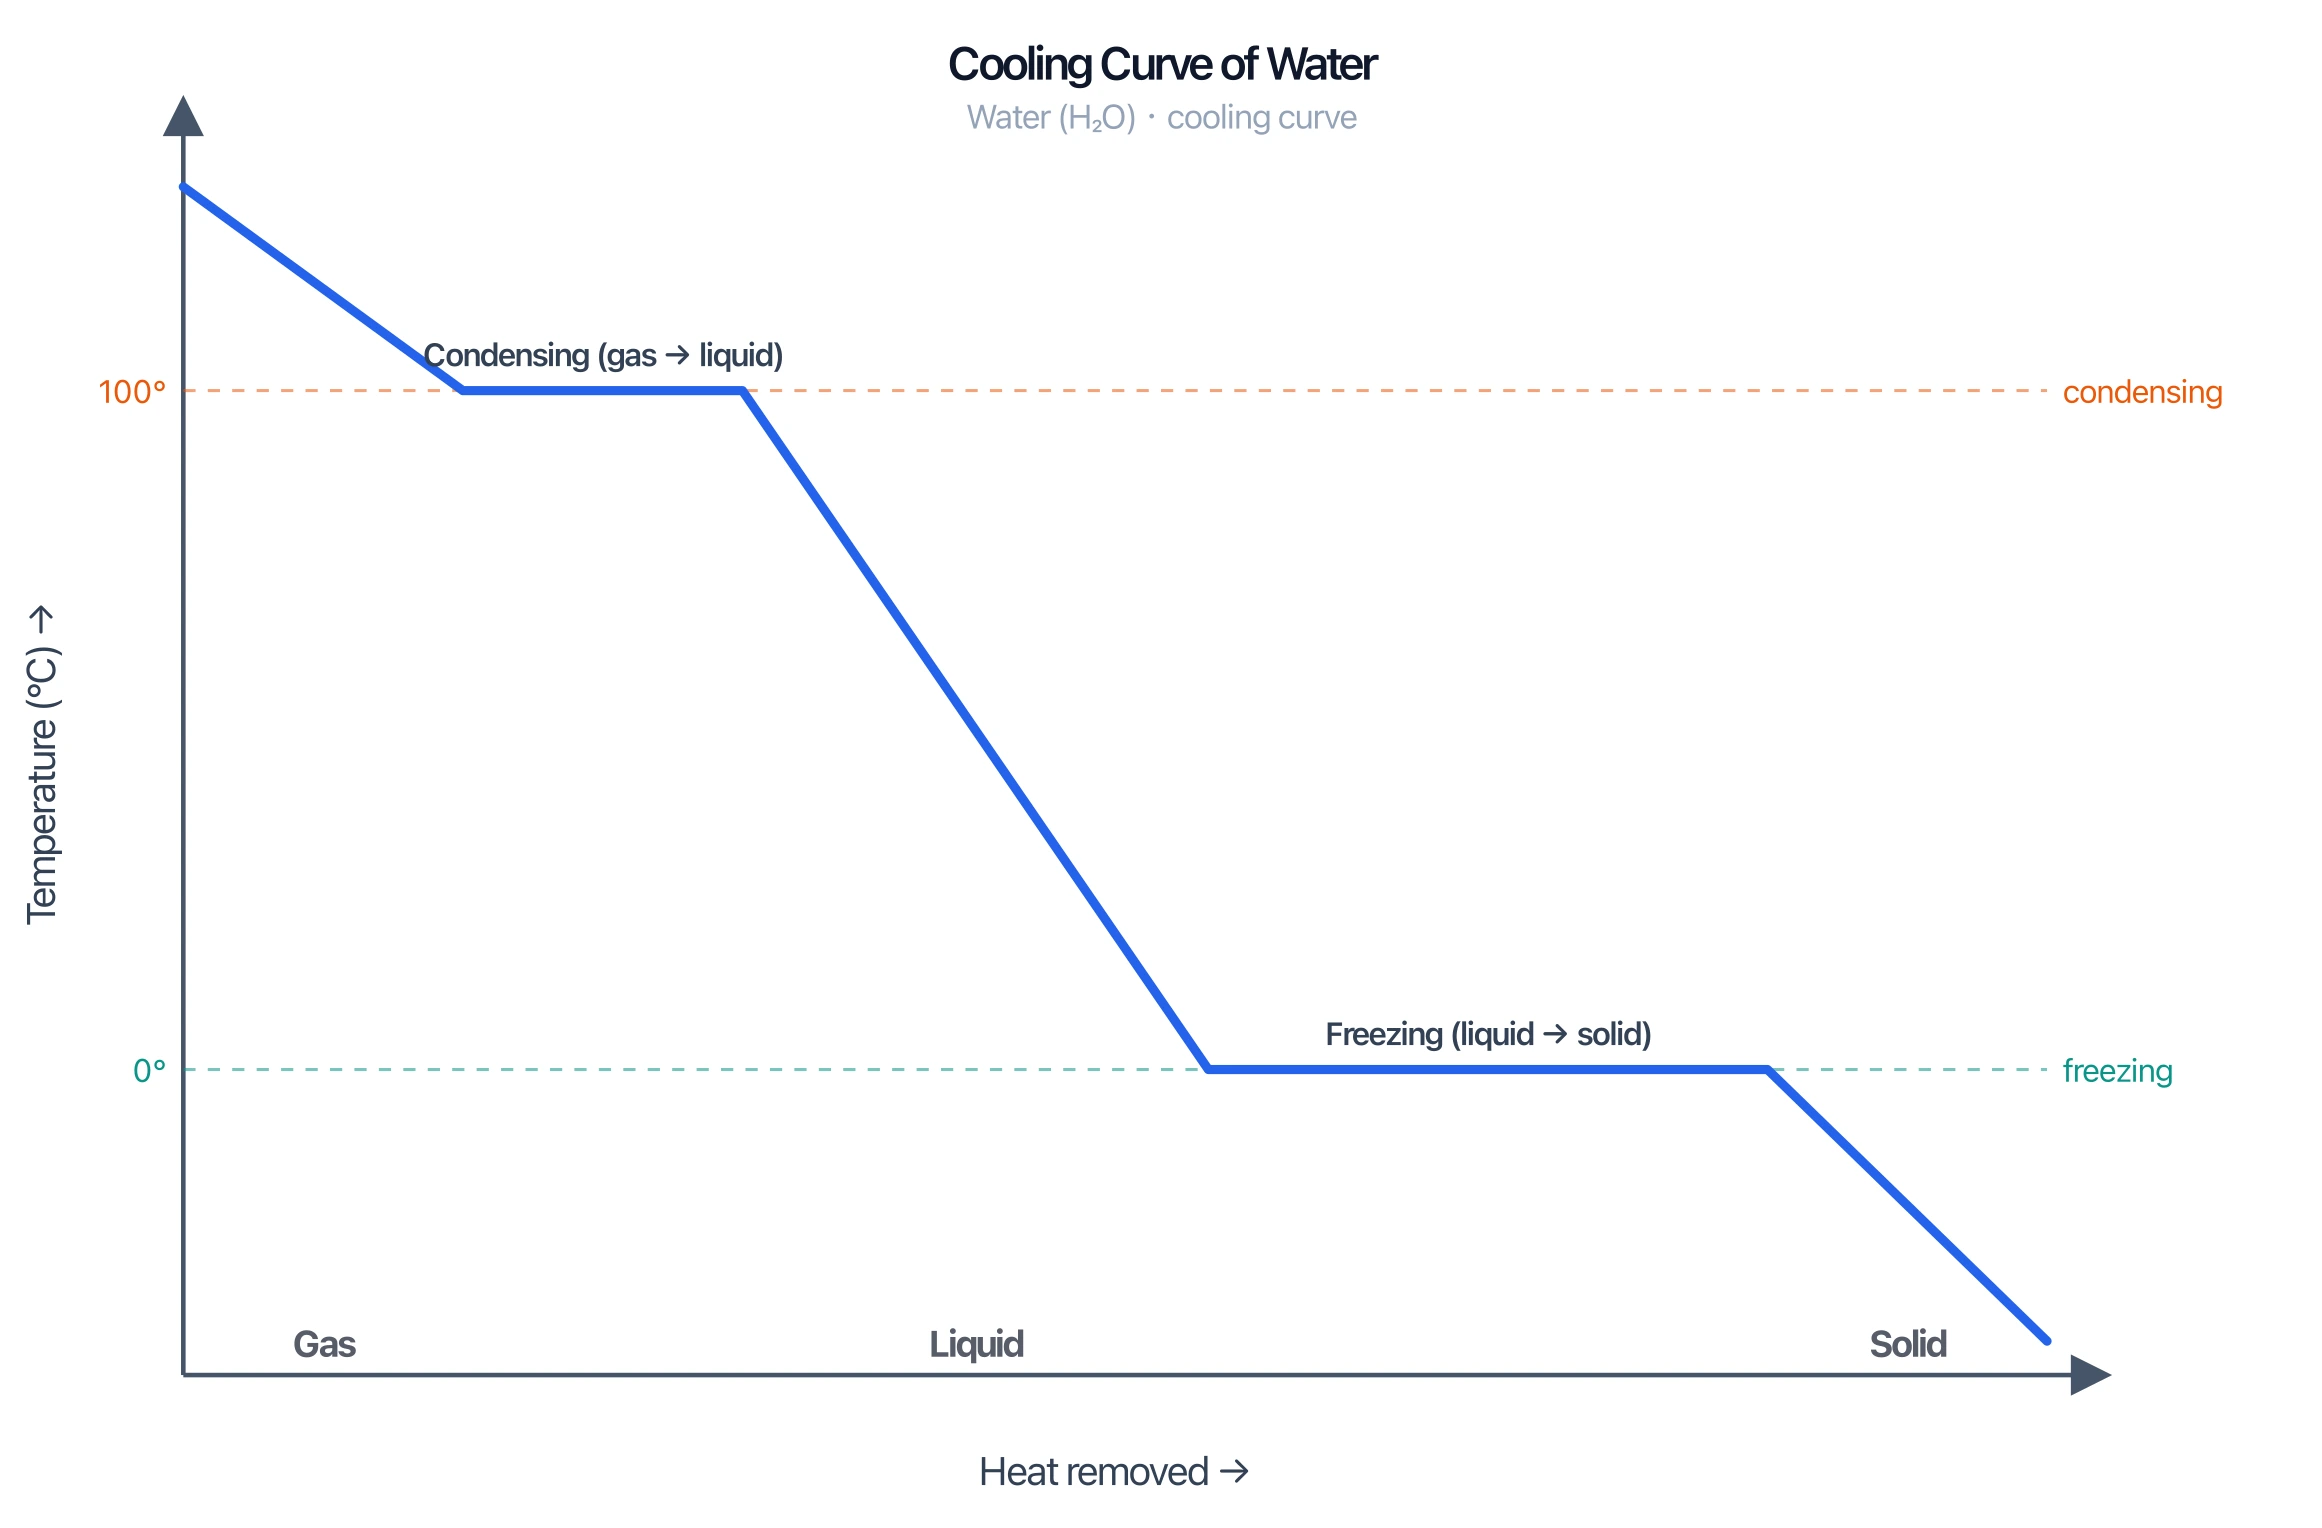
The melting point and the freezing point are the same temperature (0 °C for water); the boiling point and the condensation point are also the same (100 °C). The direction of heat flow is what differs.
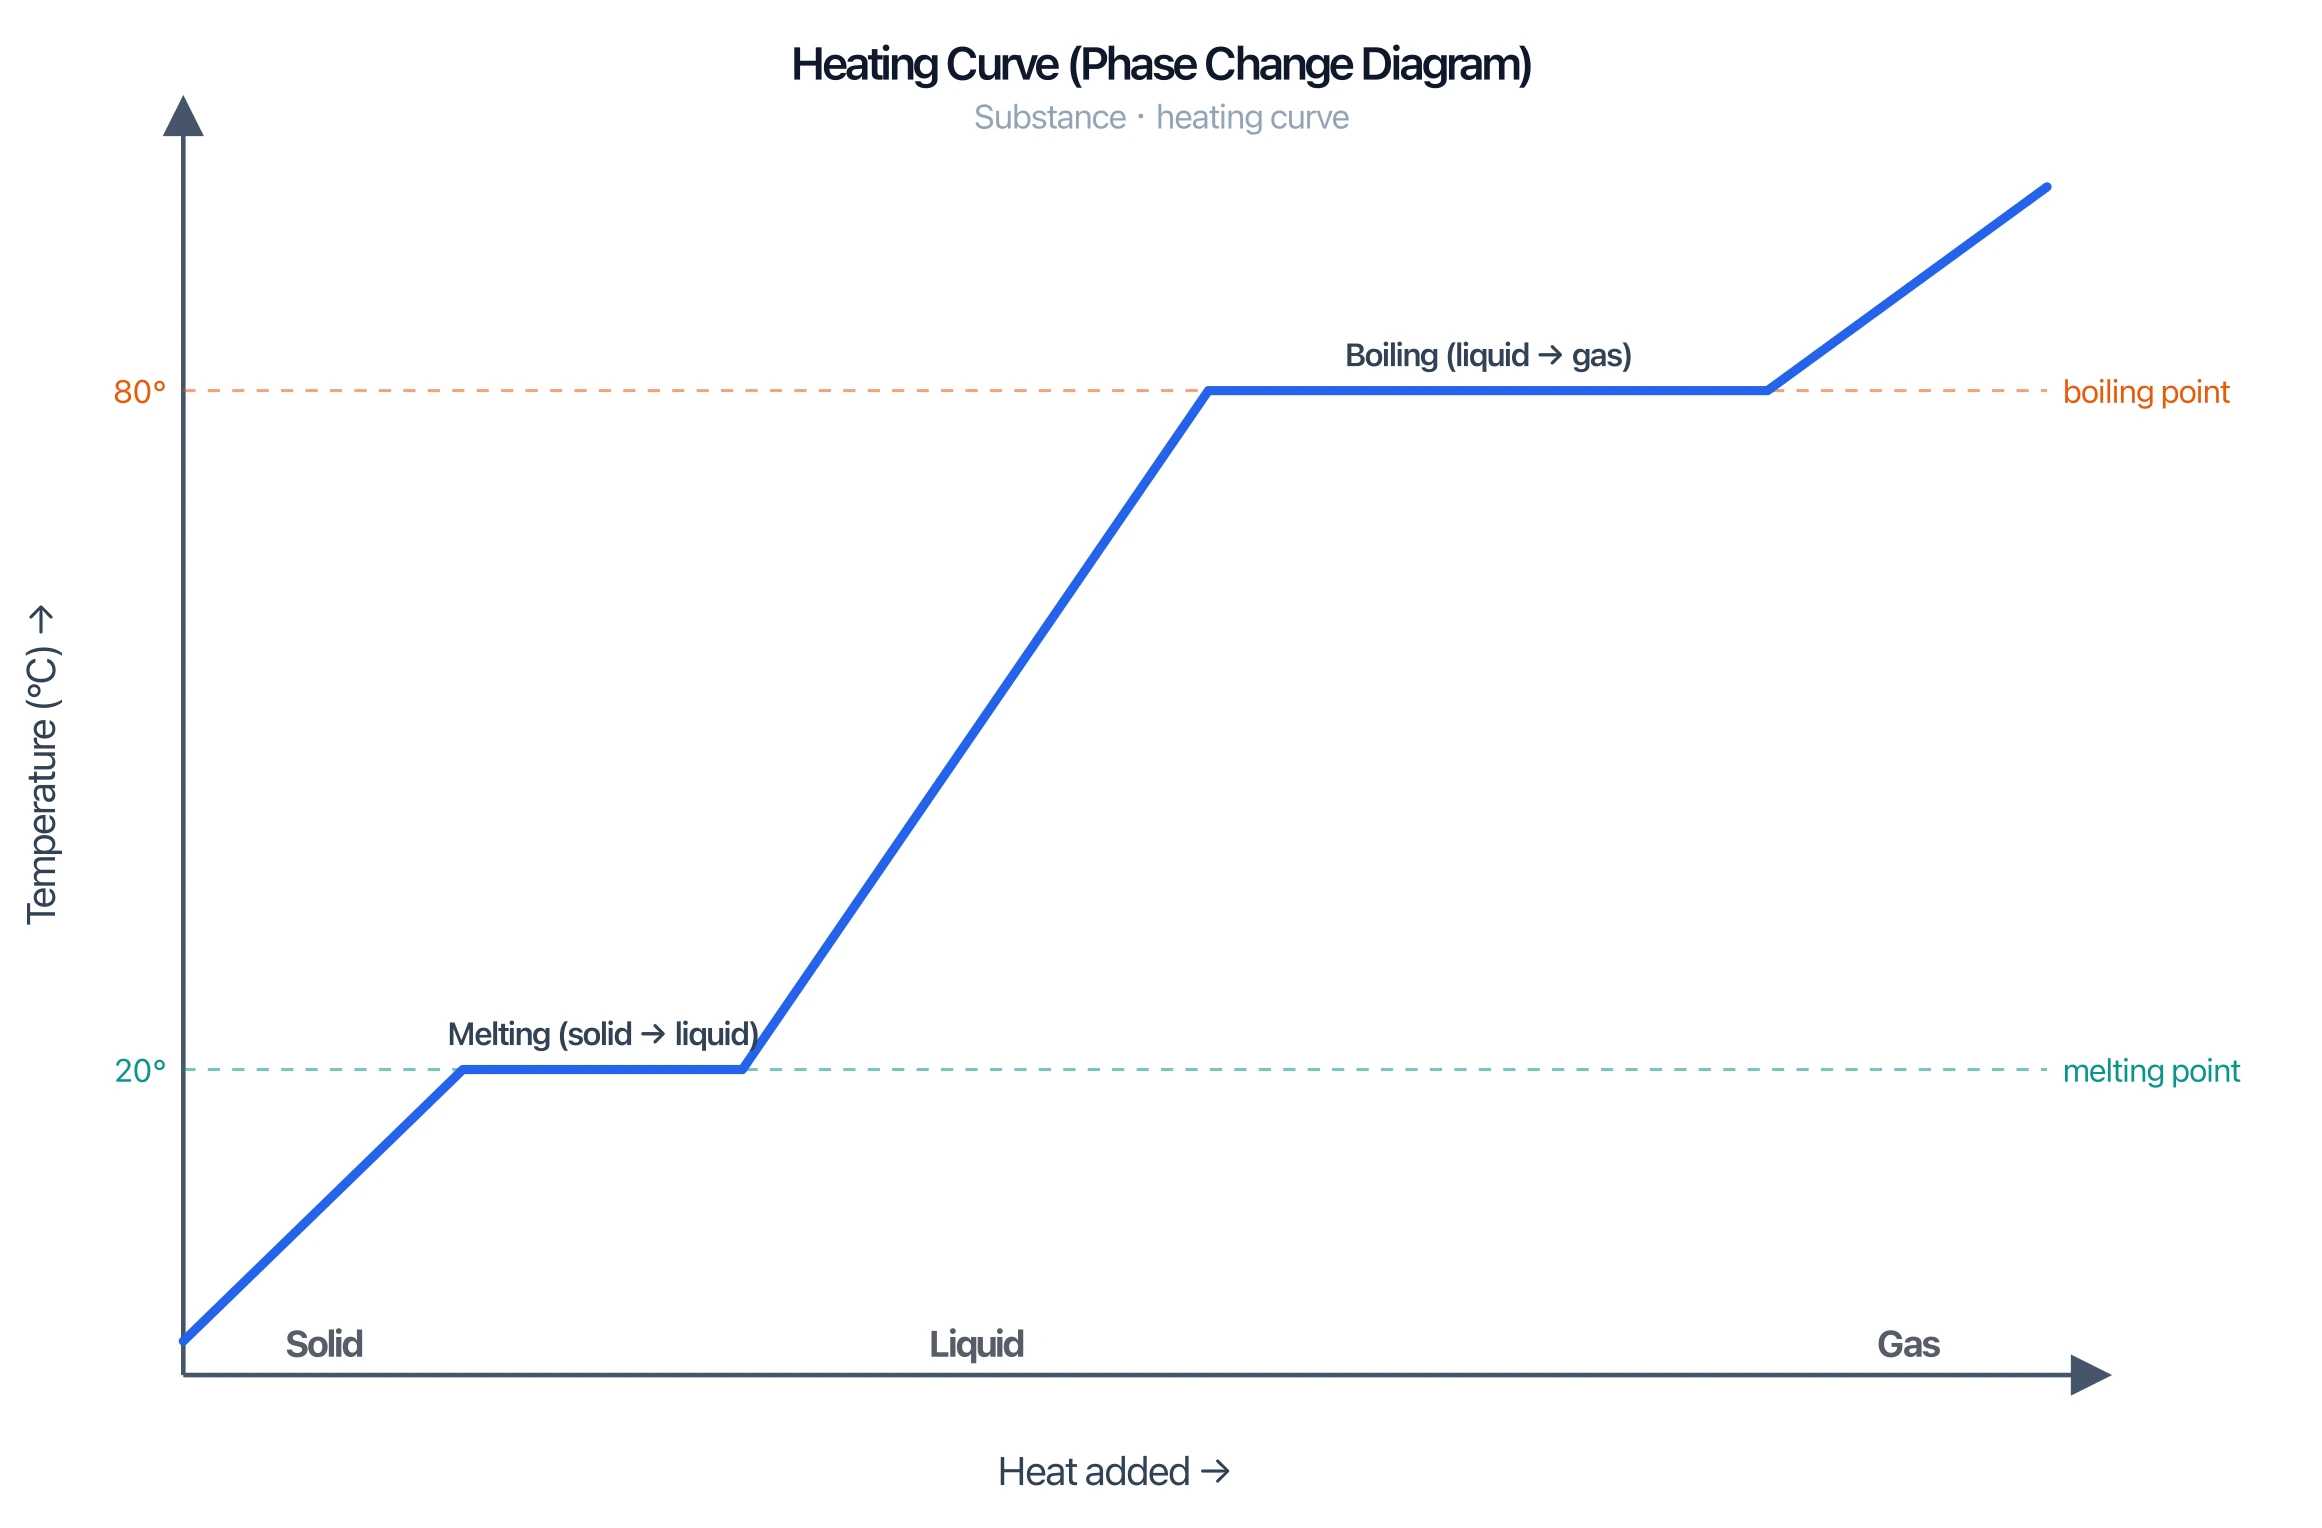
Heating Curves of Other Substances
Every substance has its own heating curve. The plateaus sit at that substance's melting and boiling points, and the slopes reflect its specific heats. A substance with strong intermolecular forces has higher melting and boiling points and longer plateaus.
Common Mistakes When Reading a Heating Curve
- Thinking temperature rises during melting or boiling. It is constant during a phase change — that is the whole point of the plateaus.
- Confusing the axes. Heat added is on the x-axis; temperature is on the y-axis. Time can replace heat only if heat is added at a constant rate.
- Expecting equal plateaus. The boiling plateau is longer than the melting plateau because vaporization needs more energy than fusion.
- Mixing up specific heat and latent heat. Specific heat governs the slopes; latent heat governs the flat sections.
- Assuming 0 °C and 100 °C for every substance. Those are water's values at 1 atm; other substances differ.
FAQ
What does a heating curve show?
A heating curve shows how the temperature of a substance changes as heat is added at a constant rate. Sloped sections are single-phase heating; flat plateaus are phase changes (melting and boiling) where the temperature stays constant.
Why does temperature stay constant during a phase change?
Because the added energy breaks intermolecular forces (increasing potential energy) rather than speeding up the molecules (increasing kinetic energy). Temperature measures average kinetic energy, so it does not change until the phase change is complete.
What are the plateaus on a heating curve?
The plateaus are the flat, horizontal sections at the melting point and the boiling point. For water they occur at 0 °C and 100 °C. They represent melting/fusion and boiling/vaporization.
Why is the boiling plateau longer than the melting plateau?
Because the heat of vaporization is much larger than the heat of fusion. Turning liquid into gas requires separating molecules completely, which takes far more energy than loosening them from a solid into a liquid.
What is the difference between a heating curve and a cooling curve?
A heating curve adds heat and temperature rises; a cooling curve removes heat and temperature falls. The cooling curve has plateaus for condensation and freezing at the same temperatures as the heating curve's boiling and melting plateaus.
Further Reading
分类
更多文章

5 Best Free Canva Alternatives for Diagrams in 2026
Best free Canva alternatives for diagrams: BioRender, draw.io, ConceptViz & more. Compare specialized tools that create professional diagrams faster than Canva.

Best Scientific Color Palettes: Hex Codes & Examples
Compare Okabe-Ito, Viridis, Paul Tol and other scientific color palettes for research figures. Includes colorblind-safe hex codes, use cases and code snippets.

How to Abstractly Depict People in Research Videos: Complete Guide for Scientists
Learn effective techniques for representing people abstractly in scientific videos and animations. Includes design approaches, privacy considerations, and practical examples for research communication.