Particle Diagram Generator for States & Types of Matter
Make particle (particulate) diagrams in seconds. Show the particle arrangement of solids, liquids, and gases, or compare an element, compound, and mixture, then export SVG or PNG — free. Clean, consistent diagrams for chemistry class.
Particle Diagram Examples
States of matter and classification rendered by the exact engine
States of Matter
The classic solid–liquid–gas comparison, with particle arrangement and properties.
Element, Compound & Mixture
Classify matter: one kind of atom, one kind of molecule, or a mix of particles.
Solid
Particles tightly packed in a regular pattern, vibrating in place.
Liquid
Particles close together but disordered, free to move past each other.
Gas
Particles far apart, moving freely and filling the container.
Compound
One kind of molecule — atoms of different elements bonded in a fixed ratio.
What is a particle diagram?
A particle diagram (or particulate diagram) is a simple drawing that represents matter as individual particles — atoms or molecules — to show how they are arranged and spaced. Particle diagrams are used in chemistry to picture the three states of matter, to classify matter as an element, compound, or mixture, and to model what happens to particles during physical and chemical changes.
Particle diagrams for the three states of matter
- Solid: particles are tightly packed in a regular, ordered pattern and only vibrate in place — a solid has a fixed shape and volume.
- Liquid: particles are still close together but disordered and able to slide past each other — a liquid has a fixed volume but takes the shape of its container.
- Gas: particles are far apart and move freely in all directions — a gas spreads to fill its container and is easily compressed.
Element, compound, and mixture particle diagrams
Particle diagrams also classify matter. An element contains only one kind of atom. A compound contains one kind of molecule, in which atoms of different elements are chemically bonded in a fixed ratio. A mixture contains more than one kind of particle (atoms or molecules) that are not chemically bonded and can be present in any proportion. This tool draws clean, consistent versions of all three so the difference is obvious.
How to draw a particle diagram
- Decide what you are representing: a state of matter, or a classification (element, compound, mixture).
- Draw particles as circles. Use the same colour for the same kind of atom, and bond atoms together for molecules.
- Space the particles to match the idea: touching and ordered for a solid, close and disordered for a liquid, far apart for a gas.
- Pick a representation in this tool and it arranges the particles correctly and consistently, ready to export.
Changes of state at the particle level
When a substance melts, boils, freezes, or condenses, the particles themselves do not change — only their arrangement and how much they move. Melting and boiling spread the particles out and let them move more; freezing and condensing bring them closer and more ordered. Use the solid, liquid, and gas diagrams side by side to show a change of state, or the AI mode to add arrows between them.
When to use the AI illustration mode
Use the exact Particle diagram mode for clean, consistent particle arrangements of states of matter and classification. Switch to AI illustration for extras: labeling specific molecules such as H₂O or CO₂, drawing a change-of-state sequence with arrows, modeling a chemical reaction at the particle level, or making a colourful classroom poster.
Frequently Asked Questions
Related Chemistry Tools
 Chemistry
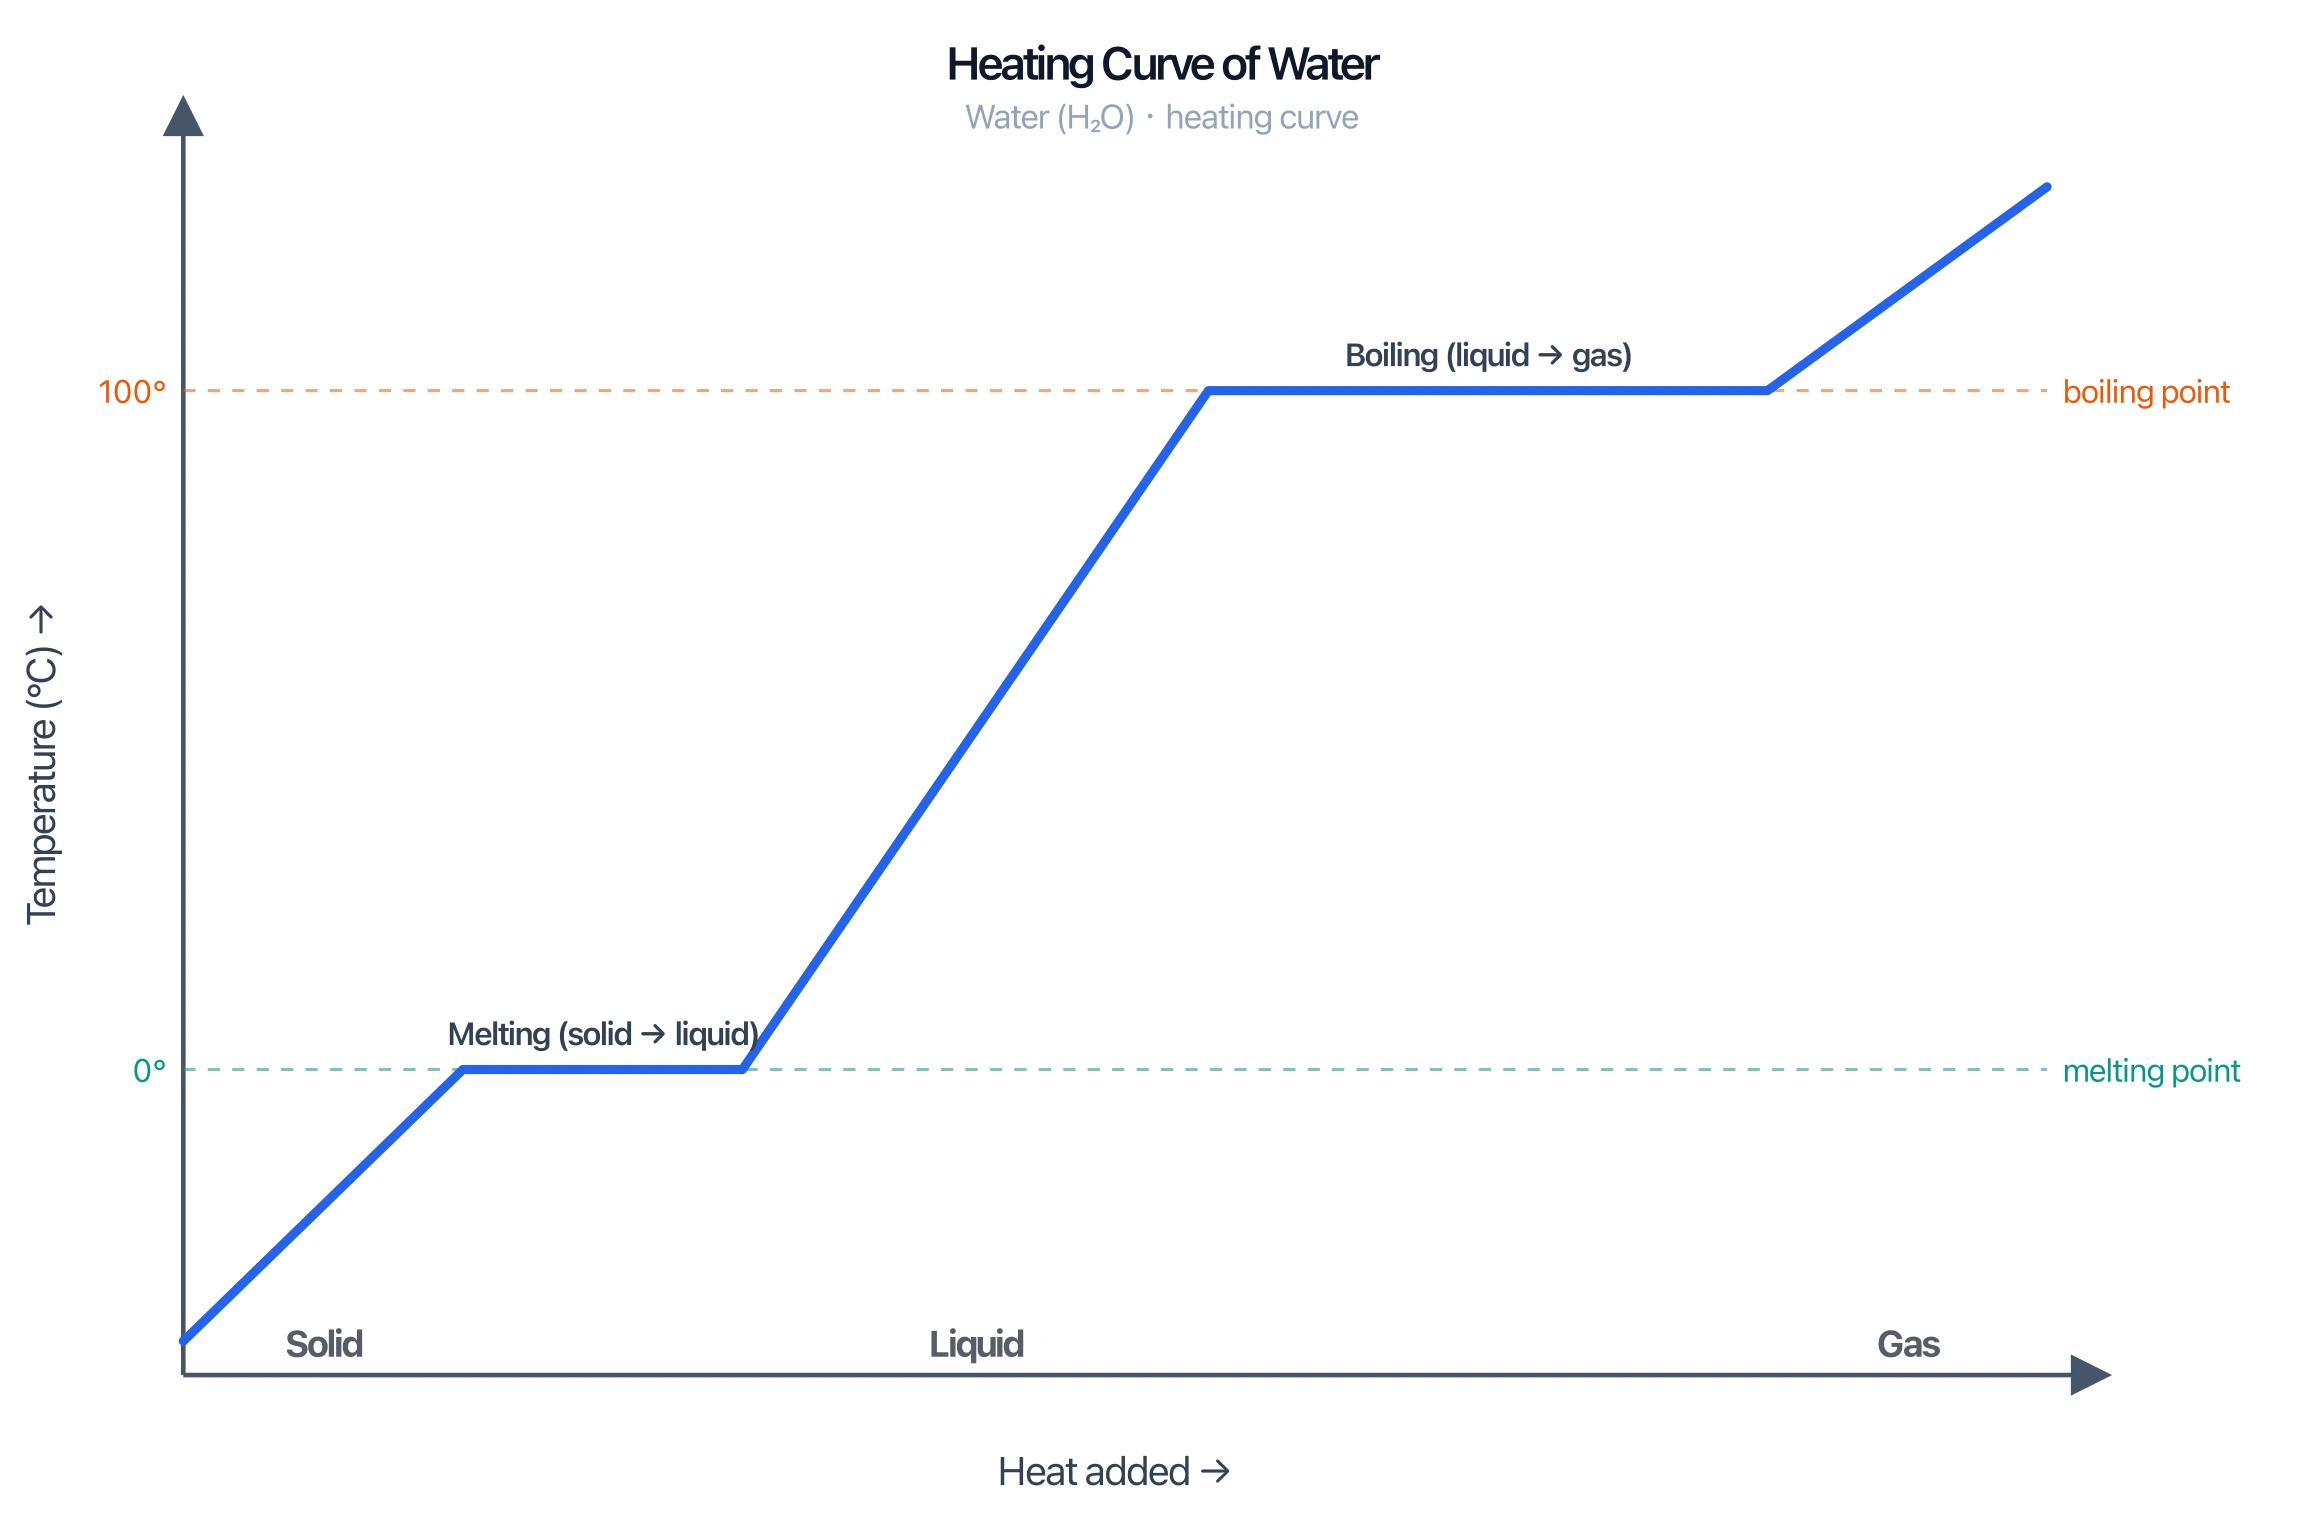
Heating Curve Generator
Plot temperature vs heat added with melting and boiling plateaus for any substance.
 Chemistry
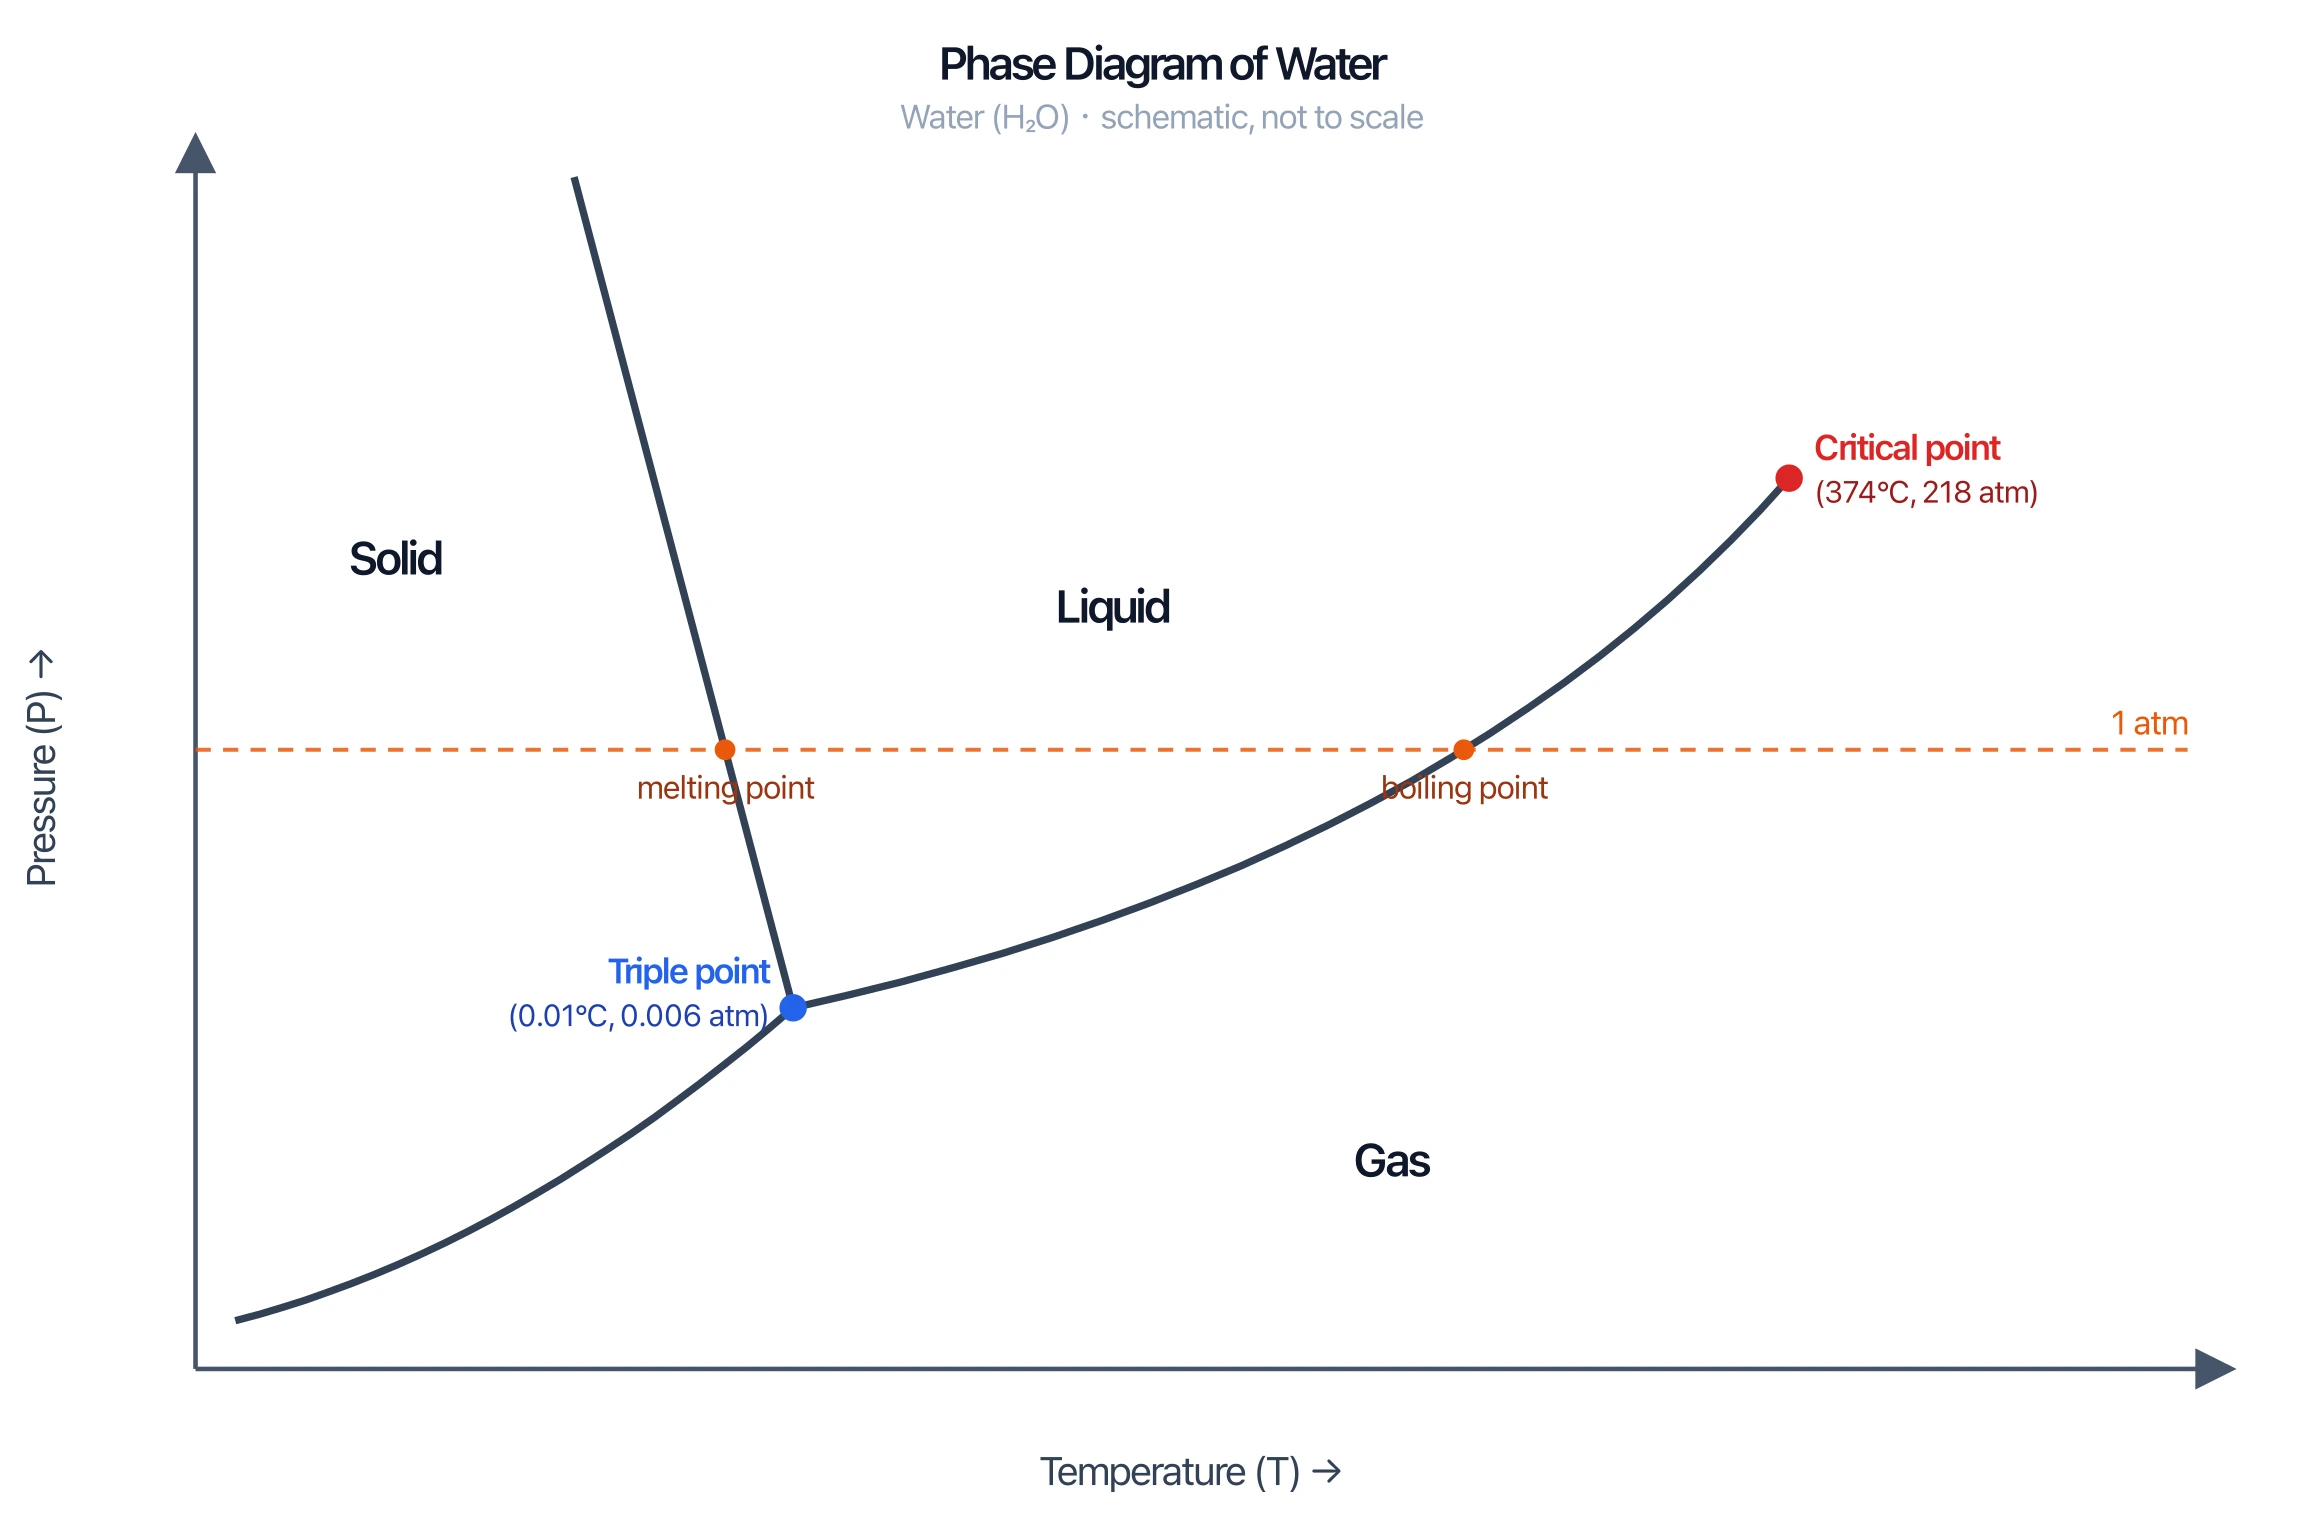
Phase Diagram Generator
Draw pressure–temperature phase diagrams with solid, liquid, and gas regions.
 Chemistry
Chemistry Structure Generator
Draw molecules, mechanisms, and chemical structures with clean bonds and labels.