Electron Configuration Diagram Generator for Shell & Orbital Diagrams
Generate clear electron configuration diagrams with AI. Visualize electron shell diagrams, orbital box diagrams with up/down arrows, the aufbau diagonal filling-order chart, and spdf energy-level notation — ideal for chemistry worksheets, slides, and study notes.
Electron Configuration Diagram Generator
Free to try ·
Your diagram will appear here
Describe what you need and click Generate
Electron Configuration Diagram Examples
Shell diagrams, orbital box diagrams, aufbau charts, and spdf notation visuals
Electron Shell Diagram
Concentric-circle shell diagram showing how electrons fill the first, second, and third energy levels around the nucleus.
Orbital Box Diagram
Box-and-arrow orbital diagram showing individual electron spins across the s and p sublevels.
Aufbau Diagonal Rule Chart
The classic aufbau diagonal arrow chart showing the correct order to fill sublevels — 1s, 2s, 2p, 3s, 3p, 4s, 3d, and so on.
spdf Energy Level Diagram
Relative energy diagram for s, p, d, and f sublevels — useful for understanding why the aufbau order skips around.
Electron Configuration Reference
A clean reference poster displaying spdf notation for several elements across the first three periods of the periodic table.
Blank Orbital Worksheet
A printer-friendly blank worksheet with empty orbital boxes and answer lines — generate the labeled version for the answer key.
What is an electron configuration diagram?
An electron configuration diagram is any visual representation that shows how the electrons in an atom are distributed across its energy levels and sublevels. The most common types are electron shell diagrams (concentric circles showing how many electrons occupy each main energy level), orbital box diagrams (rows of boxes for each sublevel, with up and down arrows for individual electron spins), and spdf notation displayed alongside an energy level diagram. Each format highlights a different layer of the same underlying idea: electrons fill the lowest available energy state first, one spin at a time, following the aufbau principle, the Pauli exclusion principle, and Hund's rule.
Electron shell diagrams: energy levels and concentric circles
A shell diagram is the most visual and beginner-friendly format. The nucleus sits at the center and electrons are placed on concentric circular rings labeled 1, 2, 3, or K, L, M. Each ring represents a principal energy level and has a maximum capacity: the first holds 2, the second holds 8, the third holds 8 for lighter elements (and up to 18 once d-orbitals are included). Shell diagrams are closely related to Bohr models and are commonly used in middle school and early high school to introduce atomic structure before students move on to orbital notation. They make it easy to count valence electrons — the electrons on the outermost ring — and to understand periodic trends in reactivity and ionisation energy.
Orbital box diagrams and the three key rules
- Aufbau principle: electrons fill sublevels from lowest energy to highest — 1s first, then 2s, 2p, 3s, 3p, 4s, 3d, and so on. The aufbau diagonal chart is a visual shortcut that shows this filling order at a glance.
- Pauli exclusion principle: each orbital (one box) holds at most two electrons, and they must have opposite spins — one arrow pointing up, one pointing down.
- Hund's rule: when electrons fill orbitals of equal energy (for example, the three 2p boxes), each box receives one electron before any box gets a second. All singly occupied orbitals have the same spin direction.
- An orbital box diagram makes all three rules visible at once: the order of the boxes encodes the aufbau sequence, the two-arrow limit per box shows the Pauli principle, and the pattern of lone arrows before pairs illustrates Hund's rule.
The aufbau diagonal rule chart explained
The aufbau filling order is not strictly numerical — the 4s sublevel fills before the 3d, and 5s fills before 4d. The diagonal rule chart is a printed grid of sublevels (rows = n value, columns = sublevel type) with diagonal lines drawn from lower-right to upper-left. Reading along each diagonal from top to bottom gives the correct filling sequence: 1s → 2s → 2p → 3s → 3p → 4s → 3d → 4p → 5s → 4d, and so on. This diagram is a standard reference printed in textbooks and posted in classrooms because it turns a confusing numbering pattern into a visual path that is easy to memorize.
spdf notation and how to read it
Spdf notation (also called spectroscopic notation) is the shorthand used to write out an electron configuration: numbers and letters indicate which sublevels are occupied, and a superscript shows how many electrons are in each. For example, 1s² 2s² 2p⁶ 3s¹ means the first shell's s sublevel has 2 electrons, the second shell's s sublevel has 2, the second shell's p sublevel has 6, and the third shell's s sublevel has 1 — a total of 11 electrons. The noble-gas shorthand condenses the core electrons into brackets (for example, [Ne] 3s¹) to keep the notation concise for larger atoms. Pairing this notation with an energy level diagram or orbital box diagram helps students check that the numbers and the visual representation agree.
Labeled vs blank diagrams for worksheets
For classroom use you typically need two versions: a fully labeled diagram for notes, slides, or a reference poster, and a blank or partially blank version for student practice. A blank orbital box diagram with empty boxes and answer lines lets students fill in the electron spins and write the spdf notation themselves. Asking for both versions in one session — a labeled diagram and then a black-and-white printer-friendly blank of the same layout — means you have a matching answer key and a practice sheet without any extra drawing.
Frequently Asked Questions
Related Chemistry Tools
 Chemistry
Bohr Model Maker
Draw precise Bohr model diagrams showing electrons on concentric shells — a visual companion to electron configuration.
ChemistryLewis Dot Structure Generator
Create Lewis dot structures and valence-electron diagrams for chemistry homework and worksheets.
 Chemistry
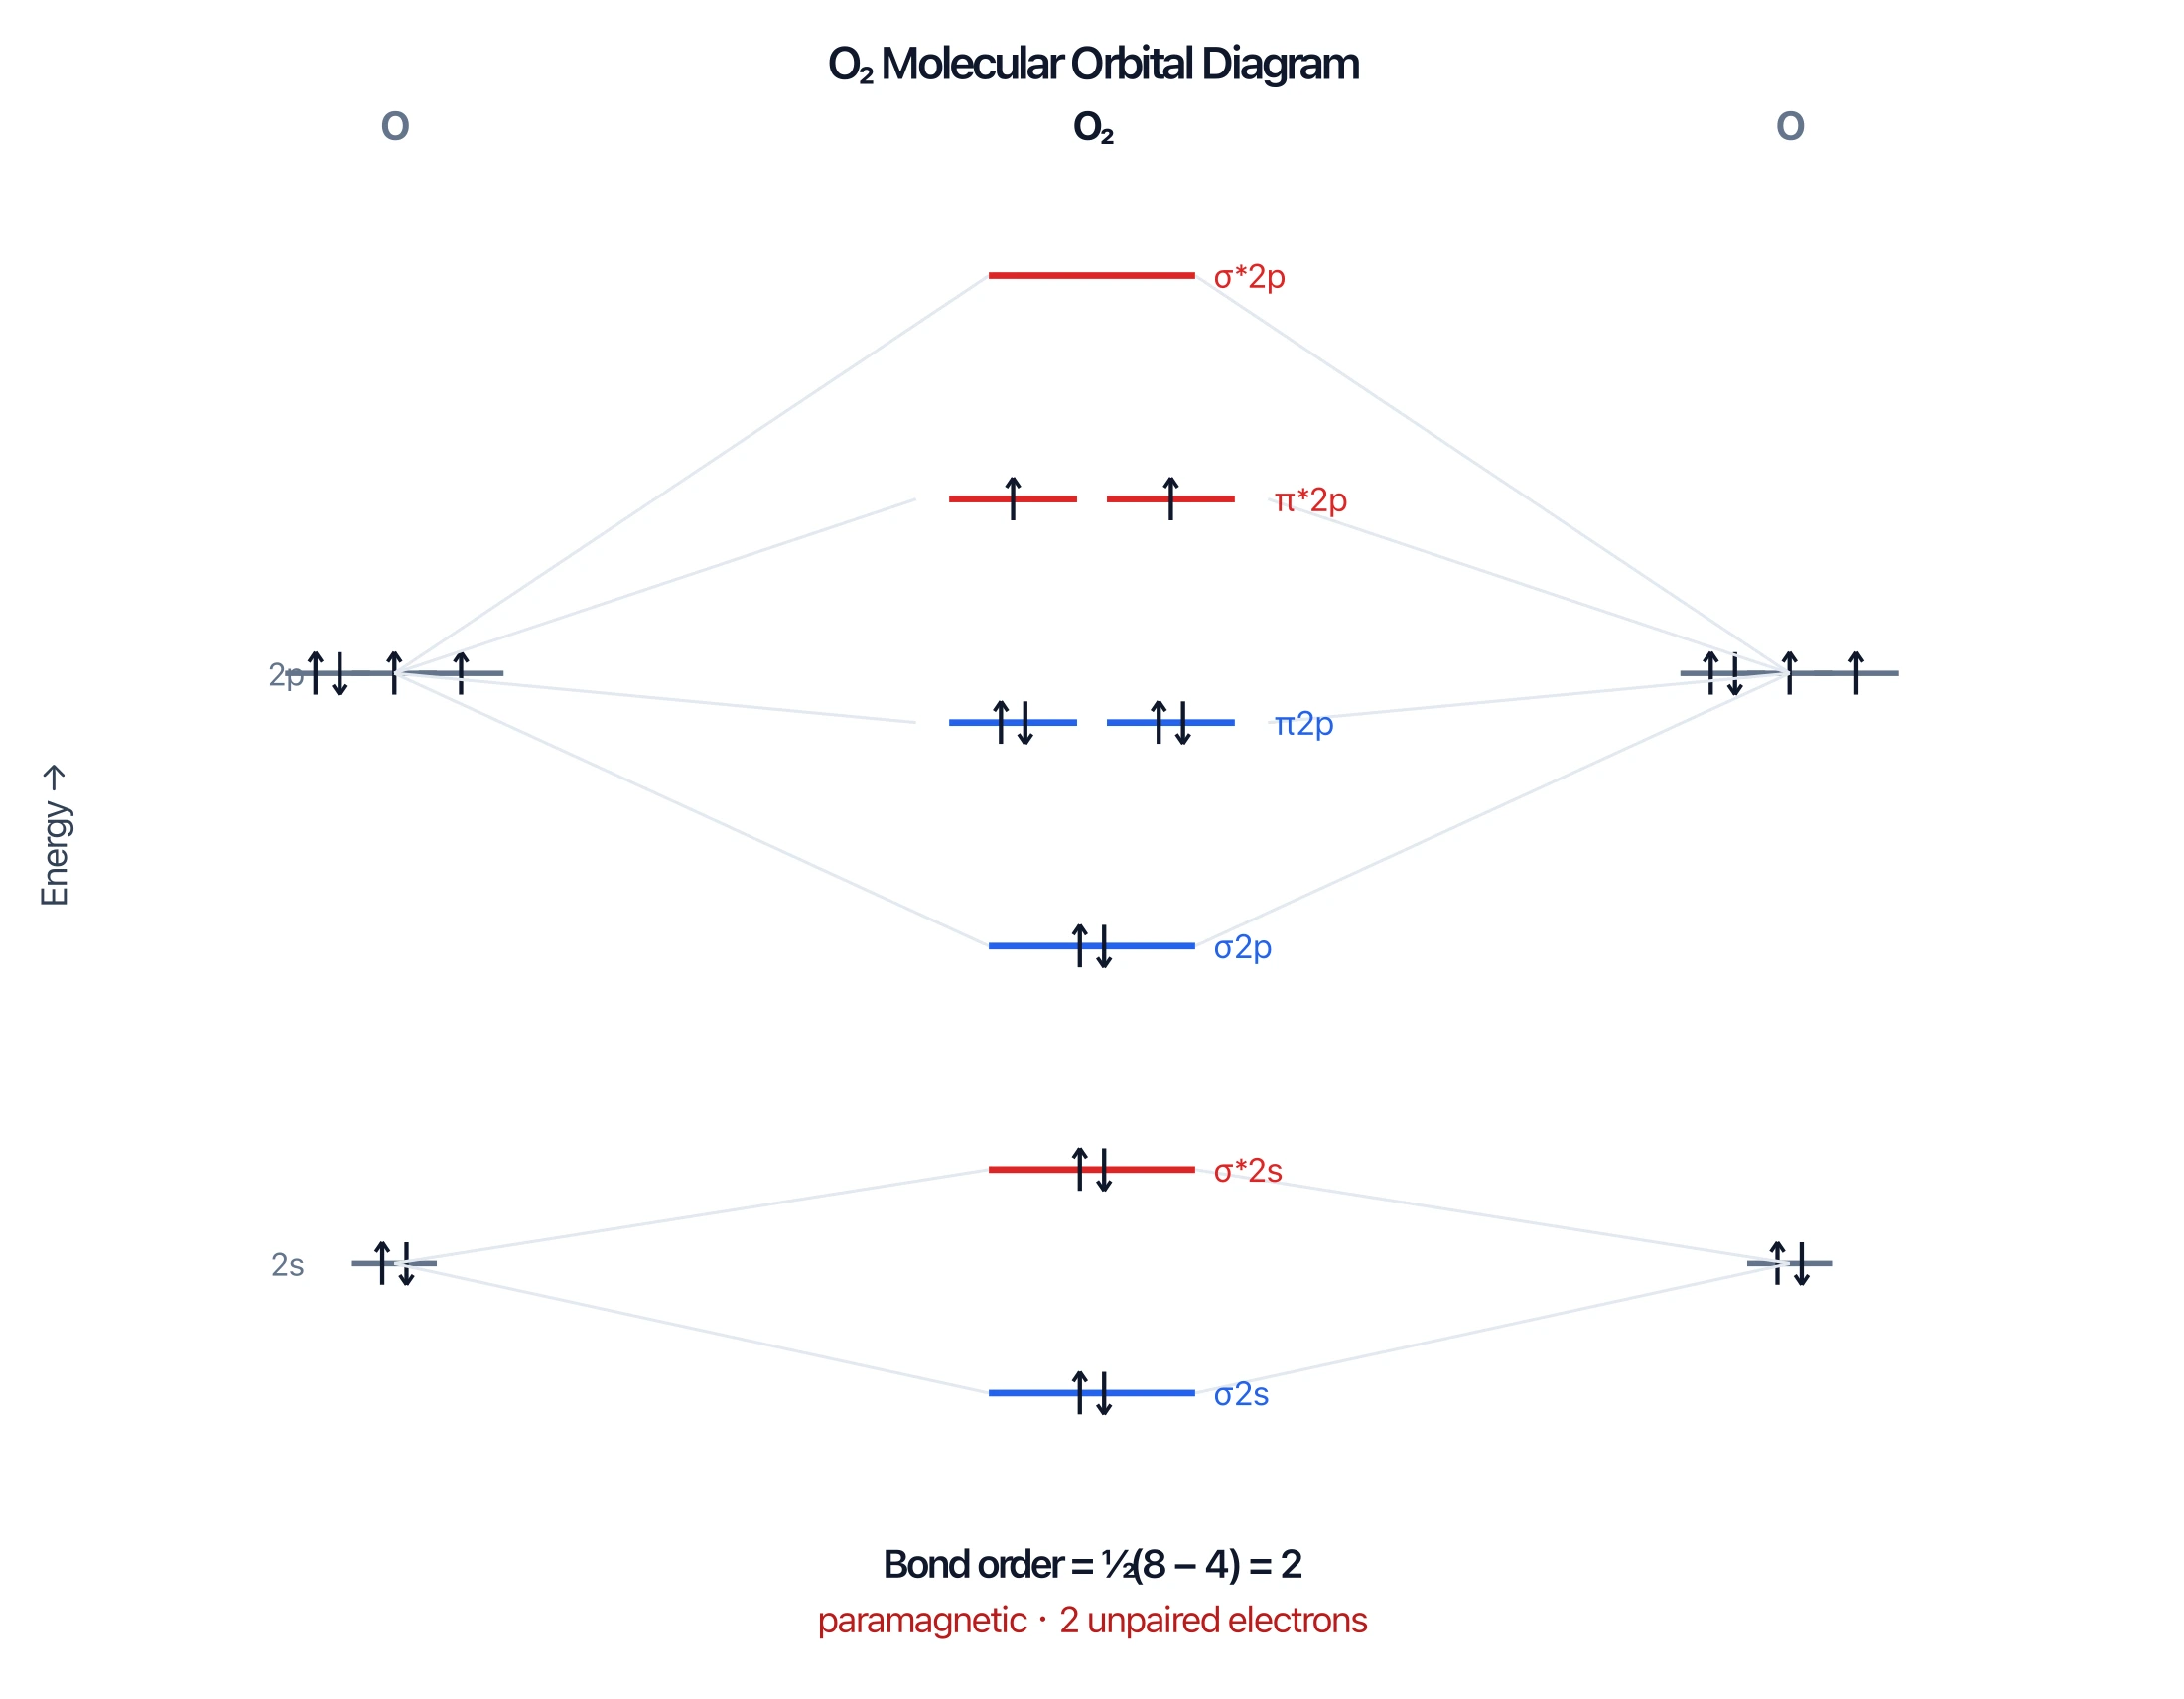
Molecular Orbital Diagram Generator
Generate molecular orbital (MO) diagrams showing bonding and antibonding orbitals for diatomic and small molecules.