
Scientific Illustration Guide 2026: Types, Tools & How to Get Started
What is scientific illustration? Learn the types (botanical, medical, technical), best tools (free & paid), and how to create effective scientific visuals. With career tips.
Scientific illustration is where art meets science—a discipline that transforms complex scientific concepts into clear, accurate visual representations. From the anatomical drawings of Leonardo da Vinci to modern molecular visualizations, scientific illustration has been essential to how we understand and communicate science.
This comprehensive guide introduces you to the world of scientific illustration, covering its definition, types, history, tools, and how you can create effective scientific visuals for your own research.
What Is Scientific Illustration?
Scientific illustration is the practice of creating visual representations of scientific subjects for the purpose of communication, education, and documentation. According to The Franklin Institute, scientific illustration "takes the viewer to the often unobservable—from molecules and viruses to the universe, from depiction of the internal anatomy of arthropods and plants to geologic cross sections."
Unlike artistic illustration, scientific illustration prioritizes:
| Aspect | Scientific Illustration | Artistic Illustration |
|---|---|---|
| Primary goal | Accuracy and clarity | Aesthetic expression |
| Subject matter | Scientific phenomena | Any subject |
| Style | Realistic, detailed | Varied, stylized |
| Audience | Researchers, students, public | General public |
| Constraints | Must be factually correct | Creative freedom |
As Thomson Environmental Consultants explains, "The main goal of a scientific illustration is to explain something graphically through a drawing, infographic, or painting, to give relevant scientific information to the viewer."
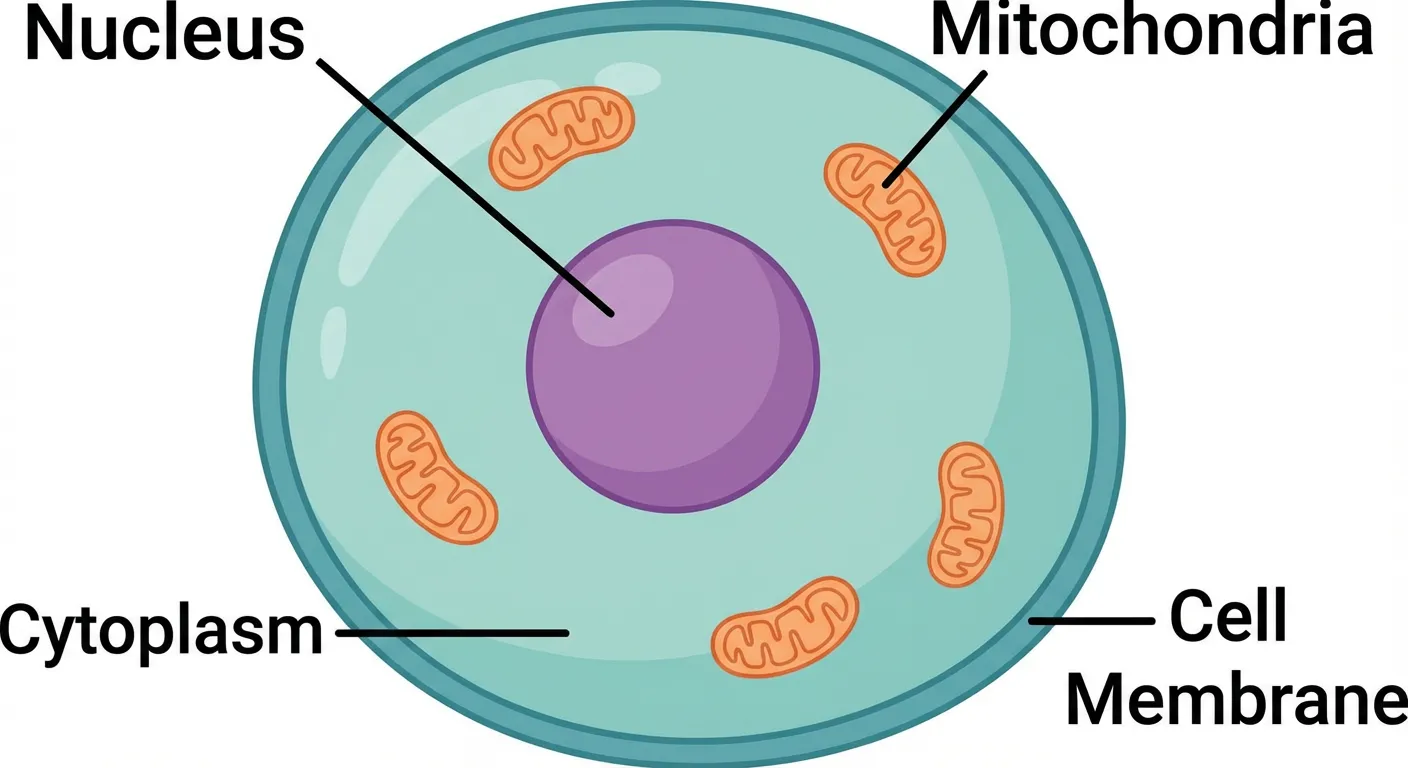
An animal cell cross-section demonstrating scientific illustration principles
Types of Scientific Illustration
Scientific illustration spans numerous disciplines, each with its own conventions and requirements.
Botanical Illustration
The oldest and most established form of scientific illustration:
- Plant anatomy and morphology
- Flower structures and reproductive parts
- Leaf arrangements and venation patterns
- Fruit and seed development
Characteristics: Highly detailed, often includes multiple views, shows scale, may include dissected parts.
Zoological Illustration
Depicting animals and their features:
- External anatomy and morphology
- Skeletal and muscular systems
- Behavioral illustrations
- Habitat and ecological context
Characteristics: Accurate proportions, natural poses, attention to texture and coloring.
Medical Illustration
Visualizing human anatomy and medical concepts:
- Anatomical structures
- Surgical procedures
- Disease processes
- Medical devices and treatments
Characteristics: Extreme accuracy required, often simplified for clarity, may show cross-sections or cutaways.
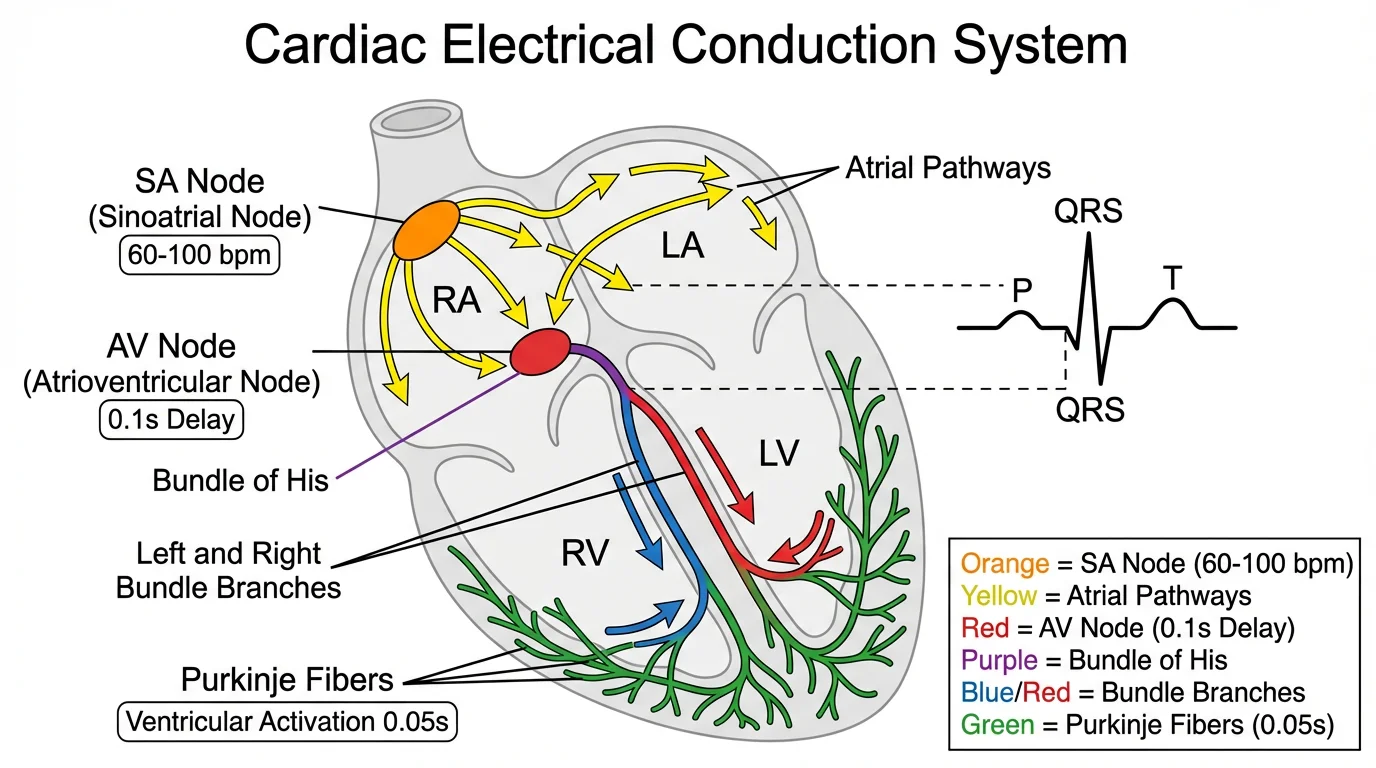
Cardiac conduction system illustration for medical education
Molecular and Cellular Illustration
Visualizing the microscopic world:
- Cell structures and organelles
- Molecular structures and interactions
- Biochemical pathways
- Genetic processes
Characteristics: Often stylized due to scale, uses color coding, shows dynamic processes.
Geological Illustration
Depicting Earth's structures and processes:
- Rock formations and strata
- Tectonic processes
- Fossil reconstructions
- Landscape cross-sections
Characteristics: Shows scale and time, often includes cross-sectional views, depicts processes.
Astronomical Illustration
Visualizing space and celestial objects:
- Planetary surfaces and atmospheres
- Stellar phenomena
- Spacecraft and missions
- Cosmological concepts
Characteristics: Often based on data rather than direct observation, combines accuracy with visualization of the invisible.
A Brief History of Scientific Illustration
Understanding the history of scientific illustration helps appreciate its evolution and importance.
Ancient and Medieval Period
According to Mind the Graph, "From prehistoric times, humans have depicted the world around them through art. Cave paintings from Paleolithic times illustrating animals are evidence of this long-established practice."
- Cave paintings (30,000+ years ago): Early animal depictions
- Ancient Egypt: Botanical and medical illustrations
- Medieval manuscripts: Herbals and bestiaries
Renaissance Revolution
The Encyclopedia.com notes that "The development of scientific illustration in early modern Europe paralleled a rising interest in studying, collecting, and classifying the natural world."
Key developments:
- Leonardo da Vinci (1452-1519): Anatomical drawings
- Andreas Vesalius (1514-1564): "De Humani Corporis Fabrica"
- Albrecht Dürer (1471-1528): Natural history illustrations
Age of Exploration (17th-19th Century)
Scientific illustration flourished with global exploration:
- Maria Sibylla Merian (1647-1717): Insect metamorphosis
- John James Audubon (1785-1851): "Birds of America"
- Ernst Haeckel (1834-1919): "Kunstformen der Natur"
Modern Era
According to Cosmos Magazine, modern scientific illustration has evolved dramatically with new technologies:
- Photography: Complemented but didn't replace illustration
- Electron microscopy: New subjects to visualize
- Digital tools: Transformed creation process
- 3D modeling: Added new dimensions
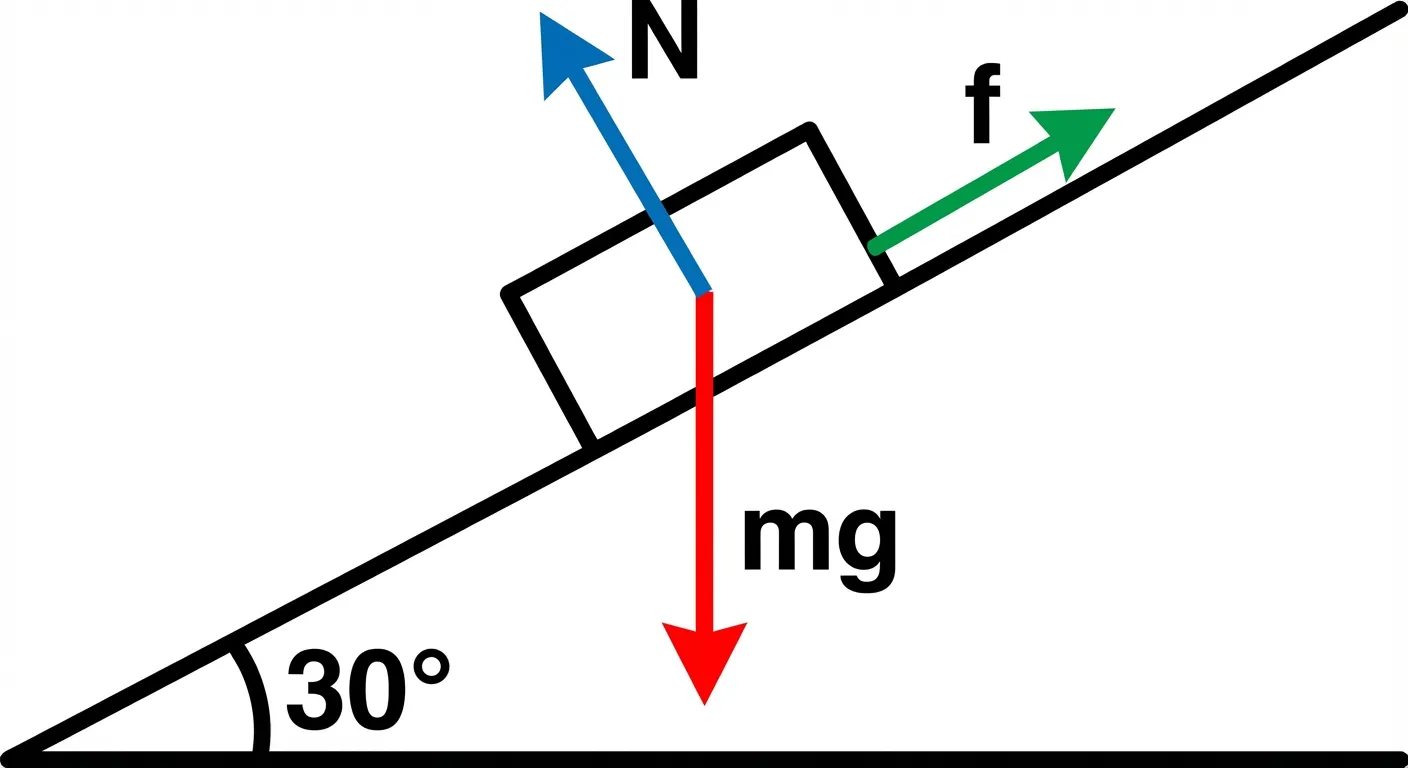
Modern physics illustration showing force vectors
Why Scientific Illustration Matters
Communication Across Barriers
Scientific illustration transcends language barriers and makes complex concepts accessible to diverse audiences.
Documentation and Record-Keeping
Illustrations provide permanent records of specimens, procedures, and observations that photographs sometimes cannot capture.
Education and Learning
Visual learning is powerful—illustrations help students understand concepts that text alone cannot convey.
Research Communication
From journal figures to conference posters, scientific illustration is essential for sharing research findings.
Public Engagement
Science communication to general audiences relies heavily on clear, engaging illustrations.
Tools for Scientific Illustration
Traditional Media
Despite digital advances, traditional media remains valuable:
Drawing:
- Graphite pencils (various grades)
- Colored pencils
- Pen and ink
- Charcoal
Painting:
- Watercolor (most traditional)
- Gouache
- Acrylics
Advantages: Unique textures, no technology required, valued for certain publications.
Digital Software
According to Animate Your Science, modern scientific illustrators have many digital options:
Professional Software:
| Software | Best For | Cost |
|---|---|---|
| Adobe Illustrator | Vector graphics, publication-ready | Subscription |
| Affinity Designer | Vector graphics, one-time purchase | One-time |
| Procreate | Digital painting (iPad) | One-time |
| Photoshop | Raster editing, compositing | Subscription |
Science-Specific Tools:
| Software | Best For | Cost |
|---|---|---|
| BioRender | Life science illustrations | Subscription |
| Mind the Graph | Scientific infographics | Freemium |
| ChemDraw | Chemical structures | Subscription |
| PyMOL | Molecular visualization | Free/Paid |
Free Options:
| Software | Best For | Platform |
|---|---|---|
| Inkscape | Vector graphics | All |
| GIMP | Raster editing | All |
| Krita | Digital painting | All |
| Blender | 3D modeling | All |
AI-Powered Tools
Modern AI tools like ConceptViz can generate scientific illustrations from text descriptions, dramatically speeding up the creation process while maintaining scientific accuracy.
Creating Effective Scientific Illustrations
Principles of Good Scientific Illustration
1. Accuracy First
Every detail must be scientifically correct. Verify your illustration against reliable sources and have experts review it.
2. Clarity Over Complexity
Remove unnecessary details that don't serve the communication goal. Simplify without sacrificing accuracy.
3. Appropriate Style
Match your illustration style to the subject and audience. A children's science book requires different treatment than a journal article.
4. Consistent Scale
Include scale bars or reference objects. Maintain consistent proportions throughout.
5. Effective Labeling
Labels should be clear, correctly positioned, and not obscure important features.
Step-by-Step Process
- Research: Understand your subject thoroughly
- Reference gathering: Collect photos, specimens, or existing illustrations
- Sketching: Create rough compositions
- Refinement: Develop the chosen concept
- Execution: Create the final illustration
- Review: Have experts verify accuracy
- Revision: Make corrections as needed
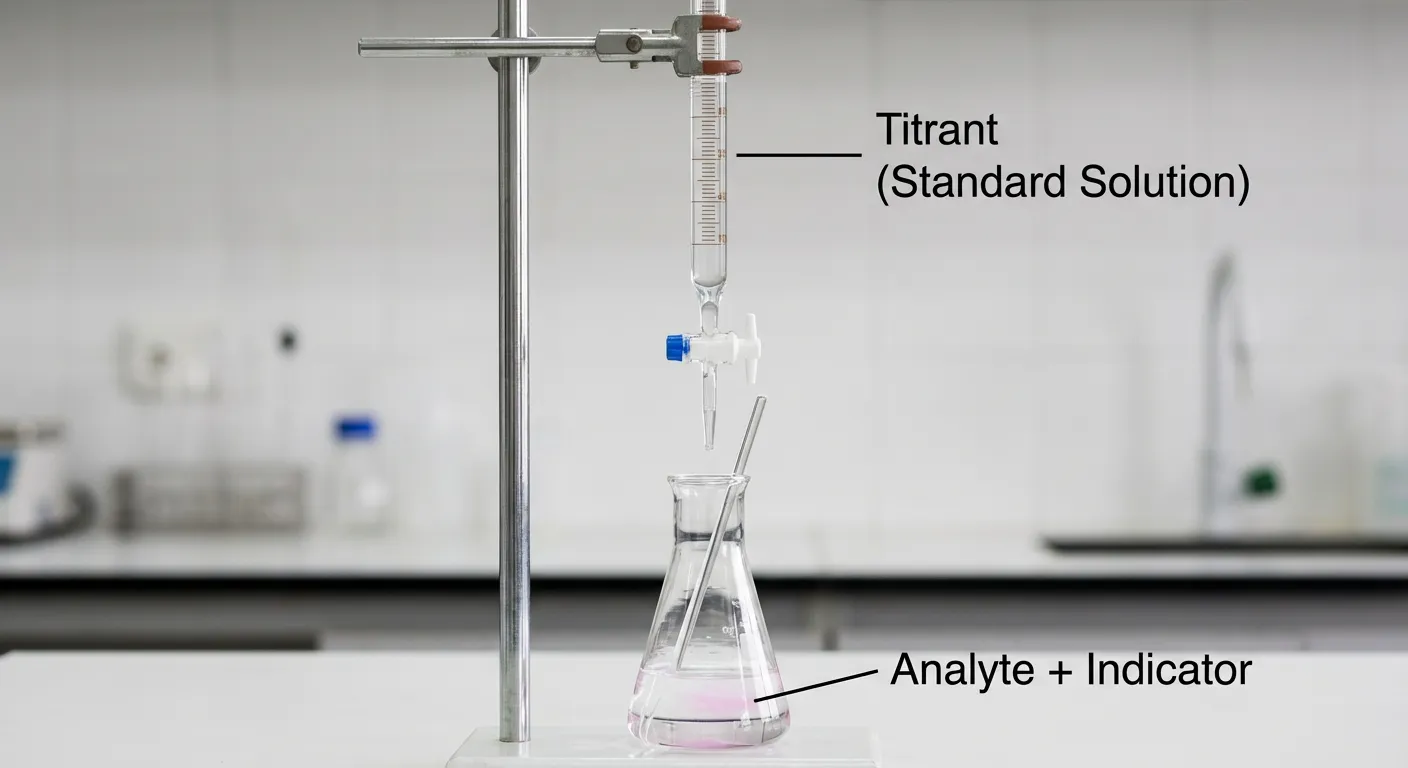
Chemistry illustration showing laboratory setup
Scientific Illustration in Research
Journal Figures
Most scientific papers require figures. Effective journal figures:
- Follow journal guidelines precisely
- Use appropriate resolution (usually 300+ DPI)
- Include proper labeling and legends
- Maintain consistent style throughout the paper
For detailed guidance, see our guide to making figures for Nature and Science journals.
Graphical Abstracts
Many journals now require or encourage graphical abstracts—single-image summaries of research papers.
Learn more in our graphical abstract creation guide.
Conference Posters
Scientific posters combine multiple illustrations with text to present research visually.
See our academic poster design guide for detailed instructions.
Grant Applications
Compelling illustrations can strengthen grant applications by clearly communicating proposed research.
Career Paths in Scientific Illustration
Education Requirements
Most scientific illustrators have backgrounds in:
- Fine arts with science coursework
- Science with art training
- Dedicated scientific illustration programs
Several universities offer specialized programs:
- Johns Hopkins University
- University of Illinois at Chicago
- California State University, Monterey Bay
Employment Options
Academic/Research:
- University departments
- Research institutions
- Museums and natural history collections
Publishing:
- Scientific journals
- Textbook publishers
- Science magazines
Medical:
- Medical schools
- Hospitals
- Pharmaceutical companies
Freelance:
- Independent contracting
- Science communication agencies
- Educational content creators
Skills Required
- Strong drawing/design abilities
- Scientific knowledge in specialty area
- Attention to detail
- Communication skills
- Software proficiency
- Ability to work with scientists
Getting Started with Scientific Illustration
For Researchers
If you need illustrations for your research:
- Learn basic tools: Start with free software like Inkscape
- Study examples: Analyze illustrations in top journals
- Practice regularly: Sketch scientific subjects
- Get feedback: Share work with colleagues
- Use AI assistance: Tools like ConceptViz can help generate initial concepts
For Aspiring Illustrators
If you want to pursue scientific illustration:
- Build foundational skills: Drawing, painting, digital tools
- Study science: Take courses in your area of interest
- Create a portfolio: Develop diverse examples
- Network: Connect with scientists and other illustrators
- Seek mentorship: Learn from established professionals
Conclusion
Scientific illustration is a vital bridge between complex science and human understanding. Whether you're a researcher needing figures for your next paper or an artist interested in science communication, understanding scientific illustration principles will enhance your work.
Key takeaways:
- Accuracy is paramount: Scientific illustration must be factually correct
- Clarity serves communication: Simplify without sacrificing truth
- Tools are evolving: From traditional media to AI-powered generation
- The field is growing: Demand for science visualization continues to increase
For more on creating effective scientific visuals, explore our guides on data visualization best practices and scientific infographic design.
Frequently Asked Questions
What is scientific illustration?
Scientific illustration is the practice of creating visual representations of scientific subjects for communication, education, and documentation. It prioritizes accuracy and clarity over artistic expression, depicting everything from molecules to ecosystems in ways that convey scientific information effectively.
What are the main types of scientific illustration?
The main types include botanical illustration (plants), zoological illustration (animals), medical illustration (human anatomy and medicine), molecular/cellular illustration (microscopic structures), geological illustration (Earth structures), and astronomical illustration (space and celestial objects).
What software is best for scientific illustration?
Popular options include Adobe Illustrator for vector graphics, BioRender for life sciences, ChemDraw for chemistry, and free alternatives like Inkscape. The best choice depends on your field, budget, and skill level. AI-powered tools like ConceptViz can also generate scientific illustrations from text descriptions.
Do I need art training to create scientific illustrations?
While formal art training helps, many researchers create effective scientific illustrations with practice and the right tools. Start with simple software, study examples from top journals, and practice regularly. Modern AI tools can also assist those without extensive art backgrounds.
How is scientific illustration different from regular illustration?
Scientific illustration prioritizes accuracy and clarity over artistic expression. Every detail must be scientifically correct and verifiable. While artistic illustration allows creative freedom, scientific illustration is constrained by the need to faithfully represent scientific reality.
What career opportunities exist in scientific illustration?
Scientific illustrators work in academic institutions, research organizations, medical schools, publishing companies, museums, pharmaceutical companies, and as freelancers. The field requires both artistic skills and scientific knowledge, with growing demand for digital and AI-assisted illustration.
How has scientific illustration evolved over time?
Scientific illustration has evolved from prehistoric cave paintings through Renaissance anatomical drawings to modern digital and AI-generated visuals. Key milestones include the work of Leonardo da Vinci, the botanical illustrations of the Age of Exploration, and the current digital revolution with tools like BioRender and AI generators.
What makes a good scientific illustration?
A good scientific illustration is accurate, clear, appropriately styled for its audience, consistently scaled, and effectively labeled. It should communicate scientific information without unnecessary complexity while maintaining factual correctness that experts can verify.
Категории
Ещё публикации
")
7 Best Free Napkin AI Alternatives in 2026 (Text-to-Visual Tools)
Best free Napkin AI alternatives: Gamma, Canva, Piktochart, Venngage & more. Compare AI-powered text-to-visual tools for diagrams and infographics.
")
15 Illustration and Infographic Design Styles Explained (2026)
Explore 15 illustration and infographic design styles with examples: flat, isometric, 3D, hand-drawn, minimalist, vector, cartoon, line art and more.
")
How to Create a Scatter Plot Diagram: Complete Guide for Researchers & Students (2026)
Learn how to draw a scatter diagram in Excel, Python, R, and with AI tools. Step-by-step scatter plot guide with best practices, examples, and common mistakes to avoid.