")
Canva Venn Diagram Maker: Complete Guide + Free Alternatives (2026)
Learn how to make a Venn diagram in Canva step by step, discover its limitations, and explore the best free alternatives including AI-powered tools for faster diagram creation.
Canva Venn Diagram Maker: Everything You Need to Know
Canva is one of the most popular graphic design platforms, and its Venn diagram maker is a go-to choice for students, educators, and professionals who need to visualize overlapping concepts quickly. With hundreds of templates and a drag-and-drop editor, Canva makes it easy to create basic Venn diagrams without any design experience.
But is Canva really the best tool for making Venn diagrams? In this comprehensive guide, we walk through the complete step-by-step process for creating Venn diagrams in Canva, discuss its strengths and limitations, and compare it with the best free alternatives available in 2026 — including AI-powered tools that can generate Venn diagrams from a simple text description.
Venn Diagram Generator
Create beautiful, publication-ready Venn diagrams instantly with AI. Just describe what you want to compare — no manual design needed.
Try it free →How to Make a Venn Diagram in Canva: Step-by-Step Guide
Follow these steps to create a professional-looking Venn diagram using Canva's free plan.
Step 1: Log In and Search for Templates
- Go to canva.com and sign in (or create a free account)
- In the search bar at the top, type "Venn Diagram"
- Press Enter to browse hundreds of pre-designed Venn diagram templates
- Filter results by style, color, or number of circles if needed
Canva organizes templates by use case — you will find options for education, business presentations, marketing comparisons, and more.
Step 2: Choose a Template or Start from Scratch
- Using a template: Click on a template that matches your needs. Most templates include two or three overlapping circles with placeholder text
- Starting from scratch: Click "Create a blank design" and choose a custom size (1920 x 1080 px works well for presentations)
For most users, starting with a template saves significant time since the circle positions, overlap, and color scheme are already set up.
Step 3: Customize the Circles
Click on any circle in the diagram to select it, then:
- Change colors: Use the color picker in the top toolbar to assign distinct colors to each circle
- Adjust opacity: Set transparency to 50-70% so the overlapping section is clearly visible
- Resize circles: Drag the corner handles to make circles larger or smaller
- Reposition: Click and drag circles to adjust how much they overlap
Tip: Hold the Shift key while resizing to maintain a perfect circle shape.
Step 4: Add and Edit Text Labels
- Click on the placeholder text in each circle section
- Type your category labels (e.g., "Mammals," "Reptiles")
- In the overlapping area, add the shared characteristics
- Use the text formatting toolbar to adjust font size, weight, and color
For readability, use a bold sans-serif font (like Montserrat or Open Sans) and ensure text contrasts well with the circle background colors.
Step 5: Add Visual Elements (Optional)
Canva offers additional elements to enhance your Venn diagram:
- Icons: Search for icons in the left sidebar (e.g., animal icons for a biology comparison)
- Images: Drag photos into each circle section for a visual comparison
- Lines and arrows: Add connecting elements to highlight relationships
- Stickers and shapes: Use decorative elements for informal or educational diagrams
Step 6: Download and Share
- Click the Share button in the top right corner
- Choose Download and select your format:
- PNG — Best for web use and presentations
- PDF — Ideal for print-quality output
- JPG — Smaller file size for general use
- SVG — Vector format (requires Canva Pro)
- Alternatively, share a live link for collaboration, or embed the diagram directly
Canva Venn Diagram: Tips for Better Results
These practical tips help you create cleaner, more professional Venn diagrams in Canva:
| Tip | Why It Matters |
|---|---|
| Use 50-60% opacity | Makes overlap sections readable without losing circle color identity |
| Limit to 2-3 circles | More circles become visually cluttered in Canva's editor |
| Choose contrasting colors | Helps viewers distinguish sections at a glance |
| Keep text concise | Use bullet points or short phrases, not full sentences |
| Align elements | Use Canva's alignment guides (purple lines) for symmetry |
| Use consistent fonts | Stick to one font family across the entire diagram |
Limitations of Canva's Venn Diagram Maker
While Canva is excellent for simple visual designs, it has notable limitations when it comes to Venn diagrams specifically:
1. Template-Based, Not Data-Driven
Canva's Venn diagrams are purely visual — you manually place circles and type text. There is no way to input data and have the diagram auto-generate with proportionally sized overlaps. If you need accurate area-proportional Venn diagrams (where circle sizes reflect actual data), Canva cannot do this.
2. Limited Circle Count
Most Canva templates support two or three circles. Creating four-circle or five-circle Venn diagrams requires significant manual effort, and the results often look messy because Canva lacks smart layout algorithms for complex overlaps.
3. No AI Generation
You cannot describe what you want to compare in plain text and have Canva generate the Venn diagram for you. Every element must be manually positioned, which is time-consuming for complex comparisons.
4. SVG Export Requires Pro
Free users cannot export in SVG (vector) format, which is important for scalable, print-quality diagrams. PNG exports work for most purposes but are resolution-limited.
5. Collaboration Friction
While Canva supports sharing links, real-time collaborative editing on specific diagram elements can be cumbersome. Comments are tied to the overall design, not individual diagram sections.
6. No Euler Diagram Support
Canva only supports standard overlapping circles. It cannot create Euler diagrams (where some circles do not overlap) or asymmetric Venn diagrams without extensive manual positioning.
Best Free Alternatives to Canva for Venn Diagrams
If Canva's limitations are a concern, these alternatives offer different strengths for creating Venn diagrams.
1. ConceptViz Venn Diagram Generator (AI-Powered)
Best for: Instant Venn diagram creation from text descriptions
ConceptViz takes a fundamentally different approach — instead of dragging circles around, you simply describe what you want to compare in plain text, and the AI generates a complete, styled Venn diagram in seconds.
Key advantages over Canva:
- AI-powered generation: Describe your comparison in natural language and get a ready-made diagram
- Automatic content: The AI fills in the overlap sections based on your topic
- Publication-ready output: High-resolution export suitable for academic papers and presentations
- No design skills needed: The AI handles colors, layout, and typography
- Free tier available: Create Venn diagrams without a paid subscription
AI Chart Generator
Generate charts and diagrams from text descriptions using AI. Supports Venn diagrams, flowcharts, bar charts, and more.
2. Lucidchart
Best for: Professional diagramming with collaboration features
Lucidchart offers dedicated Venn diagram shapes with smart formatting. Its free plan includes limited documents, but the Venn diagram experience is significantly better than Canva for multi-circle designs.
Strengths:
- Dedicated Venn diagram shape library (2 to 6 circles)
- Auto-spacing and alignment
- Real-time team collaboration
- Integration with Google Workspace and Microsoft Office
Limitations:
- Free plan limited to 3 editable documents
- More complex interface than Canva
- No AI generation
3. Creately
Best for: Template variety and educational use
Creately provides a large collection of Venn diagram templates with real-time collaboration and an intuitive drag-and-drop editor. It is particularly popular in educational settings.
Strengths:
- Extensive Venn diagram template library
- Real-time collaboration with cursor tracking
- Infinite canvas for brainstorming
- Export to PNG, SVG, PDF
Limitations:
- Free plan has usage limits
- Can feel slow with complex diagrams
4. Google Drawings
Best for: Simple diagrams with zero cost
Google Drawings is a completely free, browser-based tool that integrates seamlessly with Google Workspace. While it lacks Venn diagram templates, you can create them using basic shapes.
Strengths:
- Completely free, no account limits
- Direct integration with Google Docs, Slides, and Sheets
- Real-time collaboration built in
- No watermarks on any plan
Limitations:
- No Venn-specific templates or shapes
- Very basic styling options
- Manual circle positioning only
5. Visme
Best for: Data visualization with design polish
Visme combines infographic-style design with diagramming capabilities. Its Venn diagram templates are visually polished and suitable for marketing and business presentations.
Strengths:
- Visually stunning templates
- Animation support for presentations
- Data-driven chart integration
- Brand kit for consistent styling
Limitations:
- Free plan has limited downloads
- More focused on infographics than pure diagramming
6. Miro
Best for: Whiteboard-style brainstorming with Venn diagrams
Miro offers Venn diagrams as part of its broader whiteboarding platform. It excels at collaborative brainstorming sessions where Venn diagrams are one component of a larger visual workspace.
Strengths:
- Infinite whiteboard canvas
- Built-in Venn diagram templates
- Excellent real-time collaboration
- Integration with Slack, Jira, and other tools
Limitations:
- Free plan limited to 3 boards
- Overkill for creating just a Venn diagram
- Steeper learning curve for simple tasks
Comparison Table: Canva vs. Alternatives for Venn Diagrams
| Feature | Canva | ConceptViz | Lucidchart | Creately | Google Drawings | Visme | Miro |
|---|---|---|---|---|---|---|---|
| AI generation | No | Yes | No | No | No | No | No |
| Free plan | Yes | Yes | Limited | Limited | Unlimited | Limited | Limited |
| Max circles | 3 (easy) | AI-determined | 6 | 5 | Manual | 4 | Manual |
| Templates | 200+ | AI-generated | 50+ | 100+ | None | 30+ | 20+ |
| SVG export (free) | No | Yes | No | Yes | No | No | No |
| Real-time collab | Yes | No | Yes | Yes | Yes | Yes | Yes |
| Data-driven sizing | No | No | No | No | No | No | No |
| Mobile app | Yes | Web-based | Yes | Web-based | Web-based | Yes | Yes |
| Learning curve | Low | Very low | Medium | Low | Low | Medium | Medium |
| Best for | Quick visual design | Instant AI creation | Professional teams | Education | Google users | Marketing | Workshops |
When to Use Canva vs. When to Switch
Stick with Canva When:
- You need a visually polished 2-circle Venn diagram
- You already use Canva for other design work and want consistency
- You prefer browsing pre-made templates over starting from scratch
- Your diagram is for social media, a presentation, or informal use
- You need to combine the Venn diagram with other graphic elements
Switch to an Alternative When:
- You need to create Venn diagrams quickly without manual design work (use ConceptViz)
- You need more than 3 overlapping circles (use Lucidchart)
- You need data-proportional Venn diagrams with accurate overlap sizes
- You need SVG vector export on a free plan (use Creately)
- You are working with a team that needs real-time collaborative editing on diagrams (use Miro)
- You need Venn diagrams for academic papers with strict formatting requirements
How to Create a Venn Diagram with AI (Alternative Workflow)
If you want to skip the manual template-editing workflow entirely, here is how to create a Venn diagram using an AI-powered tool:
- Go to ConceptViz Venn Diagram Generator
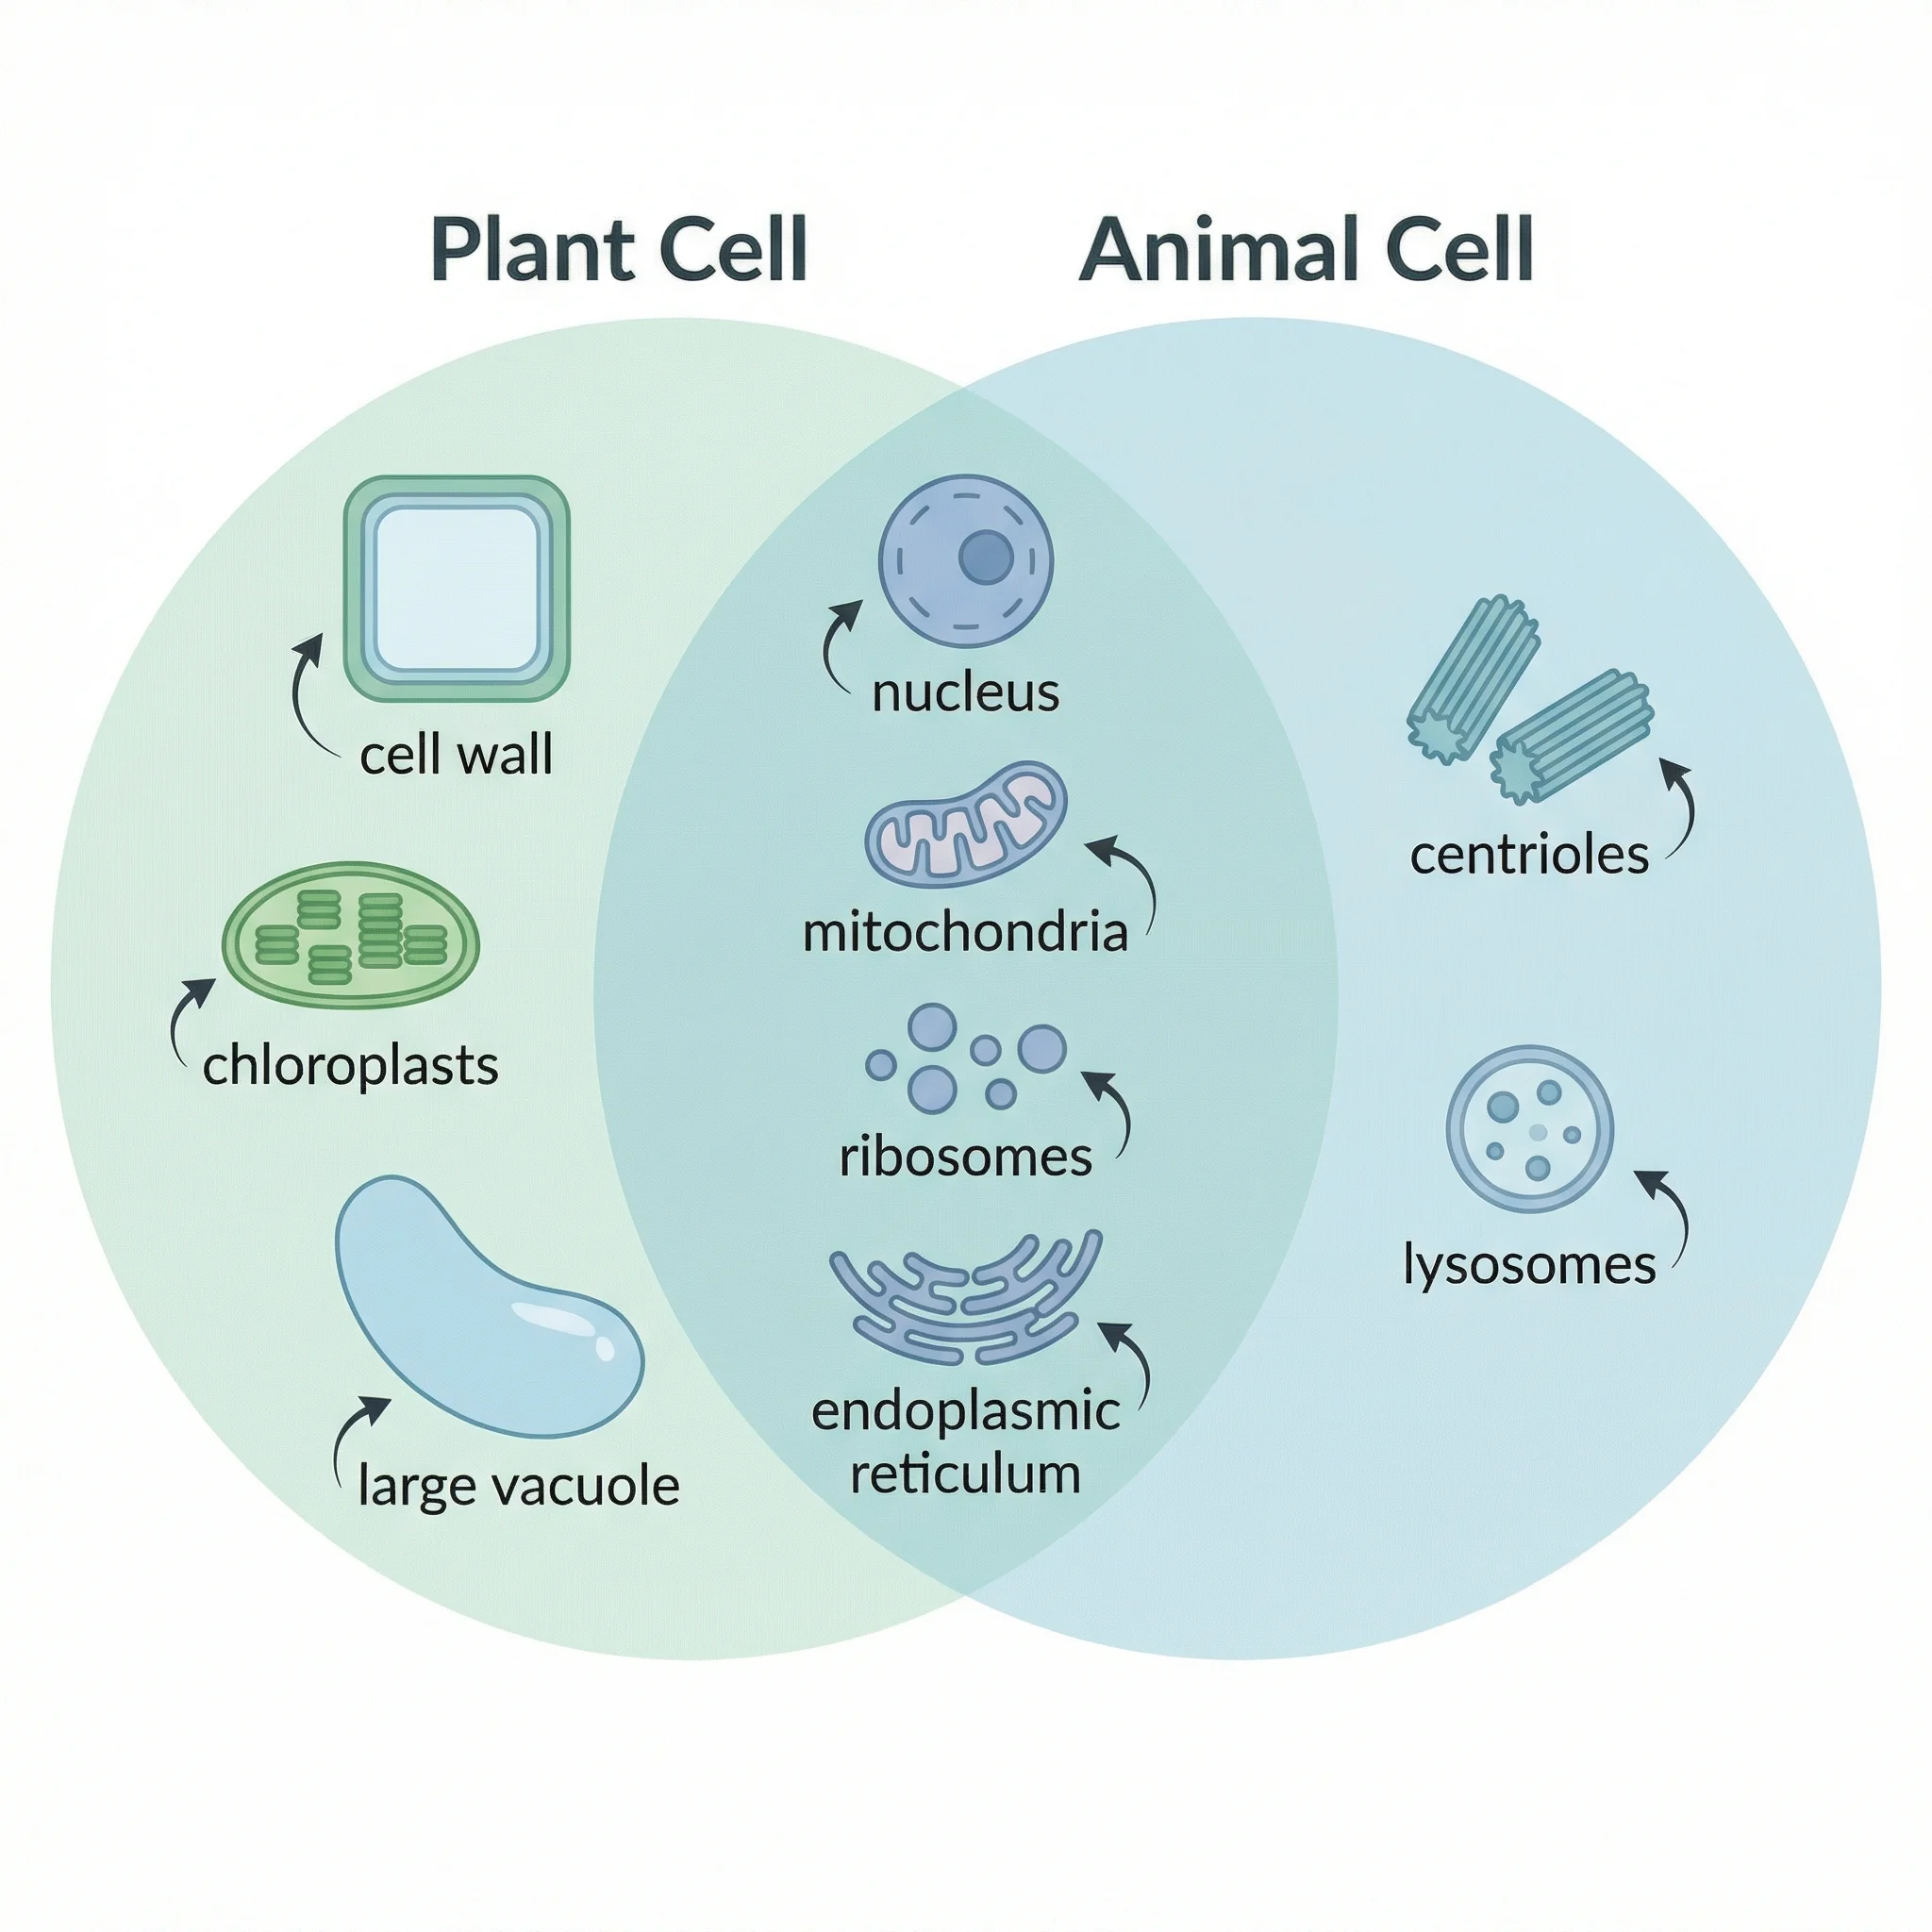
- Describe your comparison in plain text — for example: "Compare plant cells and animal cells, highlighting their unique features and shared structures"
- Click Generate — the AI creates a complete Venn diagram with properly placed labels and overlap content
- Customize colors, fonts, and layout if needed
- Download in high-resolution PNG or SVG format
This workflow takes about 30 seconds compared to the 5-10 minutes typically needed in Canva. It is especially useful when you know what you want to compare but do not want to spend time on the visual design.
AI-generated Venn diagram comparing plant and animal cells — created in seconds without any manual design
Use Cases: What People Create with Venn Diagram Makers
Understanding common use cases helps you choose the right tool:
Education
- Comparing literary characters, historical events, or scientific concepts
- Teaching set theory and logical relationships
- Student assignments and classroom activities
Business
- Product feature comparisons
- Market segment overlap analysis
- Competitor positioning diagrams
- Team role and responsibility mapping
Research
- Comparing methodologies (qualitative vs. quantitative vs. mixed methods)
- Visualizing gene expression overlap in bioinformatics
- Literature review concept mapping
Marketing
- Brand positioning and differentiation
- Audience overlap between channels
- Content strategy alignment
For related diagramming needs, see our guides on UML diagram types and mapping diagrams.
Frequently Asked Questions
Is Canva's Venn diagram maker free?
Yes, Canva offers a free Venn diagram maker with access to many templates, shapes, and basic export options (PNG, JPG, PDF). However, some premium templates, stock images, and SVG export require a Canva Pro subscription ($12.99/month). The free plan is sufficient for most basic Venn diagram needs.
How do I make a 3-circle Venn diagram in Canva?
Search for '3 circle Venn diagram' in Canva's template search, select a template, and customize the text and colors. If starting from scratch, add three circles from the Elements panel, set their opacity to 50-60%, and position them so all three overlap in the center. Add text boxes for each unique section and the overlapping areas.
Can I make a Venn diagram in Canva on my phone?
Yes, the Canva mobile app (iOS and Android) supports Venn diagram creation. Search for Venn diagram templates in the app, select one, and edit text and colors using touch gestures. However, precise circle positioning is easier on a desktop or tablet due to the larger screen and mouse control.
What is the best free alternative to Canva for Venn diagrams?
It depends on your needs. For instant AI-generated Venn diagrams, ConceptViz is the fastest option. For professional diagramming with collaboration, Lucidchart's free plan works well. For completely free, no-limits usage, Google Drawings is a solid choice. Creately is excellent for education-focused Venn diagrams with more template variety.
Can Canva create proportional Venn diagrams where circle sizes reflect data?
No, Canva's Venn diagram maker is purely decorative — circle sizes are manually adjusted and do not reflect actual data proportions. For area-proportional Venn diagrams, you need specialized tools like BioVenn (for bioinformatics), InteractiVenn, or programming libraries in R (VennDiagram package) or Python (matplotlib-venn).
How do I add more than 3 circles to a Venn diagram in Canva?
While Canva templates typically include 2-3 circles, you can manually add more from the Elements panel. Add circles, set their opacity to 50%, and position them to create 4 or 5-way overlaps. However, this requires careful manual alignment, and Canva does not automatically handle the complex overlap regions. For 4+ circle Venn diagrams, dedicated tools like Lucidchart or ConceptViz offer better results.
Can I use Canva Venn diagrams in Google Slides or PowerPoint?
Yes, download your Canva Venn diagram as a PNG or PDF and insert it into Google Slides or PowerPoint. Alternatively, use Canva's direct integration: in the Share menu, select 'Microsoft PowerPoint' to download as a .pptx file. Note that the diagram will be a flat image in Slides or PowerPoint, not editable shapes.
Is there an AI tool that can make Venn diagrams automatically?
Yes, ConceptViz's Venn Diagram Generator uses AI to create Venn diagrams from text descriptions. You describe what you want to compare (e.g., 'Compare renewable and non-renewable energy sources'), and the AI generates a complete diagram with labels, overlap content, and styling. This is significantly faster than manually building a Venn diagram in Canva or similar tools.
Conclusion
Canva's Venn diagram maker is a solid choice for creating simple, visually appealing Venn diagrams — especially if you already use Canva for other design tasks. The template library is extensive, the editor is intuitive, and the free plan covers most basic needs.
However, if you need to create Venn diagrams quickly without manual design work, need more than three circles, or require publication-quality output, the alternatives offer compelling advantages. AI-powered tools like ConceptViz's Venn Diagram Generator can save significant time by generating complete diagrams from a simple text description, while professional tools like Lucidchart and Creately offer more advanced diagramming capabilities.
The best tool ultimately depends on your workflow: Canva for visual polish within a broader design project, ConceptViz for speed and AI-powered generation, and Lucidchart or Creately for collaborative professional diagramming.
Need help with other types of diagrams? Explore our guides on converting Mermaid diagrams to images, ER diagrams for research, and Canva alternatives for science diagrams.
Категории
Ещё публикации
")
How to Make a Gantt Chart: Step-by-Step Guide for Projects and Research (2026)
Learn how to make a Gantt chart for project planning, research schedules, and launch timelines. Covers manual logic, Excel workflows, common mistakes, and when to use timeline tools instead.

AI Worksheet Generator Guide: Create Printable Worksheets and Answer Keys
Learn how to use an AI worksheet generator for printable classroom worksheets, answer keys, differentiation, diagrams, and teacher review workflows.

Best Free Adobe Illustrator Alternatives 2026
Compare the best free Adobe Illustrator alternatives in 2026: Inkscape, Affinity by Canva, Canva, Vectr, Gravit and ConceptViz for vector graphics and diagrams.