
How to Draw a Neural Network Architecture Diagram: A Complete Guide
Learn how to draw neural network architecture diagrams for CNNs, RNNs, Transformers, and more. Step-by-step guide with tools, examples, and best practices for researchers and engineers.
A neural network architecture diagram is one of the most important visuals in deep learning research and engineering. Whether you are writing a paper, preparing a conference poster, documenting a model for your team, or pitching an AI product to stakeholders, a clear architecture diagram communicates the structure of your model far faster than equations or code ever can.
This guide covers the full process: what a neural network diagram should include, conventions for different architectures, the tools researchers and engineers use, and common mistakes to avoid.
Neural Network Diagram Generator
Create professional neural network architecture diagrams for CNNs, RNNs, Transformers, and more with AI.
Try it free →What Is a Neural Network Architecture Diagram?
A neural network architecture diagram is a visual representation of the layers, connections, and data flow within a neural network model. At minimum, a useful architecture diagram shows:
- The input layer — what data enters the network and in what shape
- Hidden layers — the transformations applied at each intermediate stage
- The output layer — the final prediction, embedding, or reconstruction
- Connections — how information flows from layer to layer
- Key parameters — kernel sizes, number of filters, attention heads, or other architectural choices
Unlike a simple flowchart, a neural network diagram must convey the shape and type of data transformations, not just the sequence of operations. This is what makes neural network diagrams distinctively technical — and distinctively challenging to draw well.
Why Architecture Diagrams Matter in Research
Architecture diagrams appear in nearly every deep learning paper published at NeurIPS, ICML, CVPR, and similar venues. According to a survey of top-cited deep learning papers on Papers With Code, architecture figures are consistently among the most-cited visual elements — reviewers and readers use them to quickly assess whether the proposed model is novel and whether the complexity is justified.
A clear diagram serves multiple audiences:
- Reviewers need to evaluate novelty and correctness without running the code
- Replication researchers use the diagram to reconstruct the model
- Engineering teams use it to understand implementation requirements
- Grant committees and funding bodies use it to assess feasibility
A poorly drawn architecture diagram — one that's cluttered, unlabeled, or inconsistent — is often cited as a weakness in peer review.
Common Neural Network Architecture Types and How to Represent Them
1. Feedforward / Multilayer Perceptron (MLP)
The simplest architecture: a sequence of fully connected layers. In diagrams, MLP architectures are typically represented as columns of circles (neurons) connected to every neuron in the adjacent column.
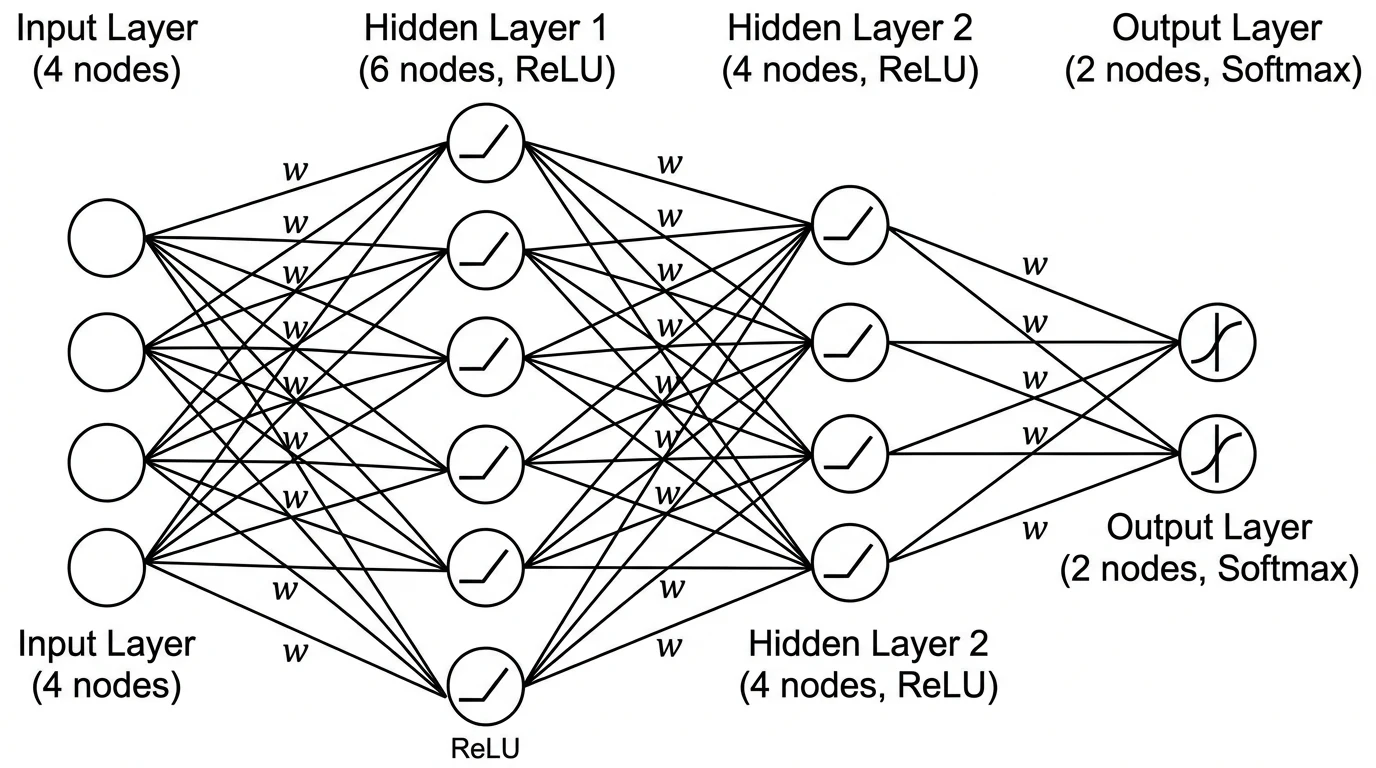
A feedforward MLP diagram showing the input layer (left), two hidden layers, and output layer (right). Each node represents a neuron; lines represent weight connections.
Conventions:
- Draw layers vertically as columns of nodes
- Use horizontal spacing between layers to show the direction of forward pass (left to right)
- Label each layer with the node count and activation function (e.g., "ReLU, 256 units")
- For large networks, use a "..." placeholder node to avoid drawing all neurons
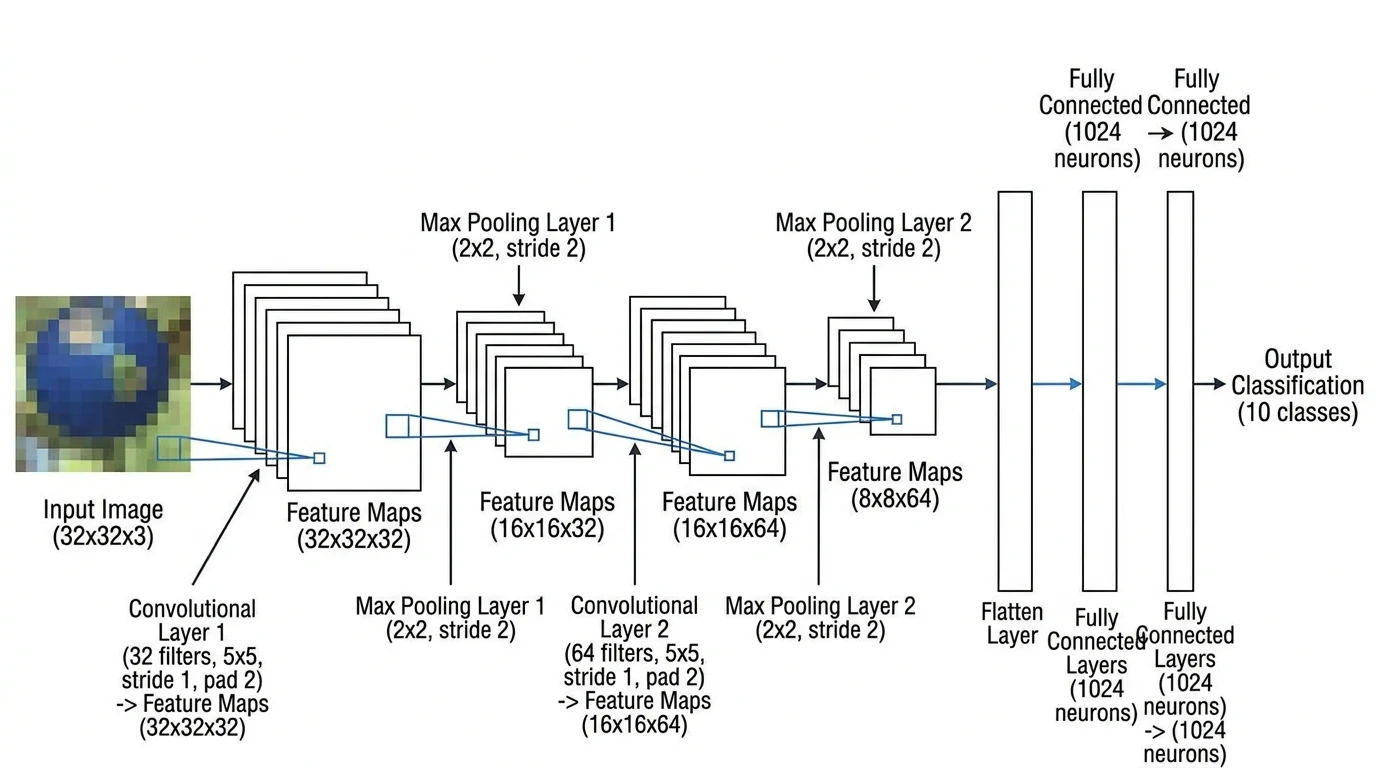
2. Convolutional Neural Networks (CNN)
CNNs are the dominant architecture for computer vision tasks. Their spatial structure requires a different visual convention than MLPs: layers are typically drawn as 3D rectangular blocks representing feature maps, with the block width indicating spatial size and the block depth indicating the number of channels.
A CNN architecture diagram for image classification. 3D cuboid blocks represent feature map tensors; block depth encodes channel count. Arrows show the forward pass from input image through convolutional and pooling layers to the classification output.
Conventions:
- Use 3D cuboids (or 2D rectangles with a depth dimension illustrated in perspective) for feature maps
- Label each block with dimensions:
H × W × C(height × width × channels) - Show pooling layers with a smaller block
- Label convolutional layers with kernel size and stride (e.g.,
Conv 3×3, stride 2) - Use consistent color coding: one color for conv layers, another for pooling, another for FC layers
The PlotNeuralNet library on GitHub (see github.com/HarisIqbal88/PlotNeuralNet) provides LaTeX-based tools specifically designed to produce publication-quality CNN block diagrams in this style.
3. Recurrent Neural Networks (RNN) and LSTMs
RNN architectures involve temporal sequences and recurrent connections, requiring a different representational approach. The standard convention is to show the network "unrolled" over time steps — drawing the same recurrent unit repeated horizontally across the time axis with arrows indicating the hidden state passed from one timestep to the next.
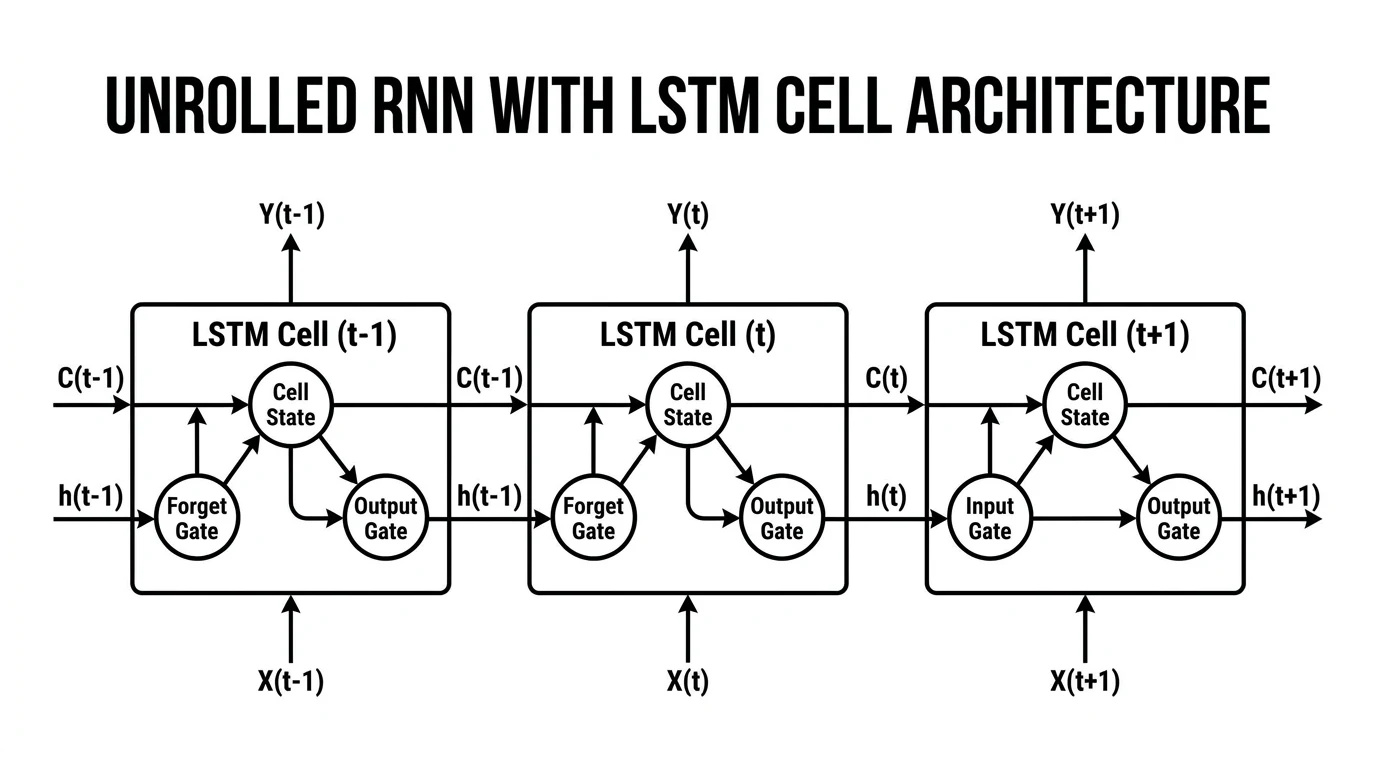
An unrolled RNN/LSTM diagram showing input sequences (bottom), recurrent hidden states (middle), and output predictions (top) over four time steps. The horizontal arrow represents the hidden state passed between timesteps.
Conventions:
- Draw the unrolled version for clarity (the recurrent loop shown as repetition across time)
- Label the hidden state arrow with its dimension (e.g.,
h_t: 512) - For LSTMs, you may need a separate inset diagram showing the four gates (input, forget, cell, output) within a single LSTM unit
- Use
...to indicate that the sequence continues beyond what is shown
4. Transformer and Attention Architectures
Transformers have become the foundation for language models (BERT, GPT, LLaMA) and vision models (ViT). Their diagrams need to capture the multi-head attention mechanism, positional encoding, and the encoder-decoder structure (where applicable).
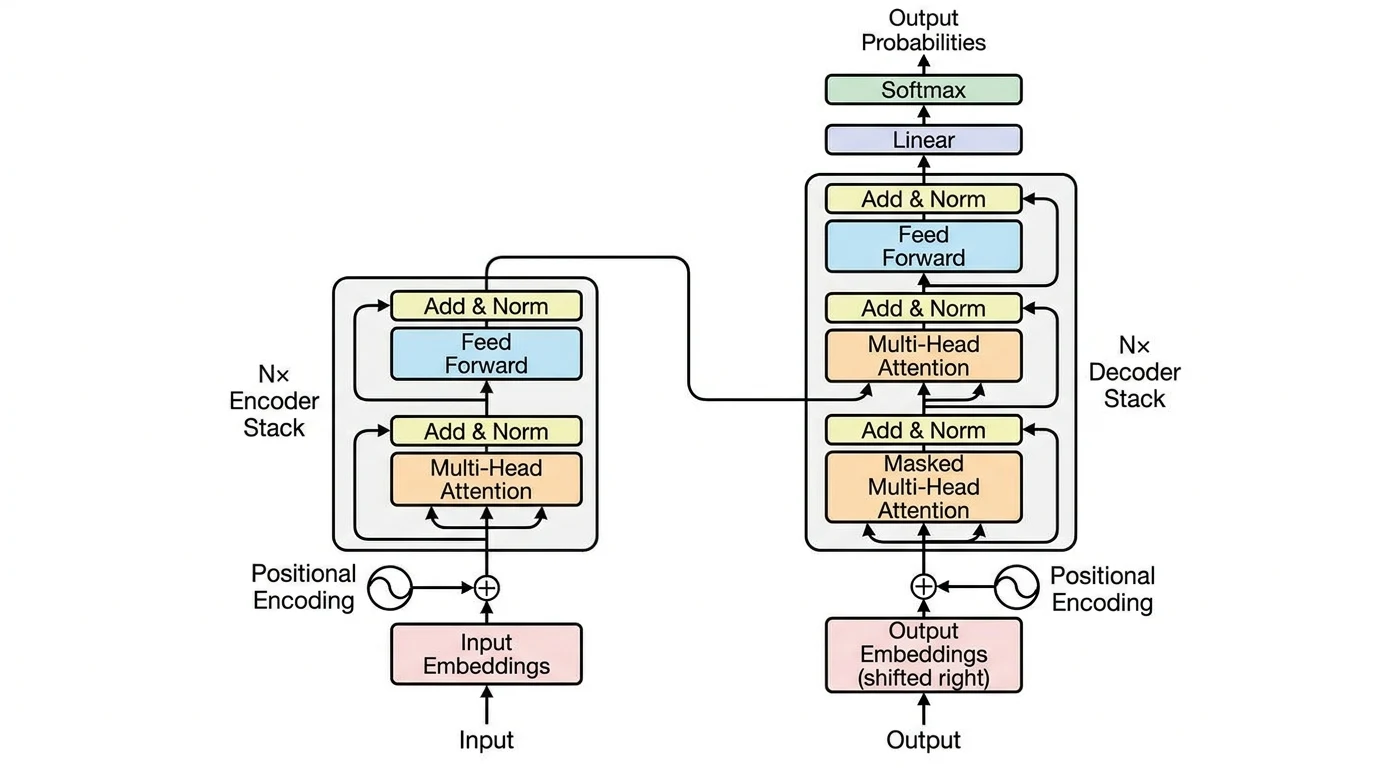
A Transformer encoder architecture diagram showing positional encoding, multi-head self-attention, layer normalization, and feed-forward sublayers. The stacked structure indicates N repeated encoder blocks.
Conventions:
- Draw encoder and decoder as separate stacked-block columns
- Use a box with "×N" to indicate a block is repeated N times
- Show the residual (skip) connection as an arrow bypassing the sublayer
- Attention mechanisms can be drawn with query (Q), key (K), value (V) inputs feeding into a central "Attention" block
- For cross-attention in encoder-decoder models, show the K/V inputs coming from the encoder
The original "Attention Is All You Need" figure from Vaswani et al. (2017) remains the canonical reference for how to visualize Transformer architectures.
5. Generative Adversarial Networks (GANs)
GANs consist of two competing networks — the Generator and the Discriminator — which must be shown in relation to each other with a feedback loop representing the adversarial training dynamic.
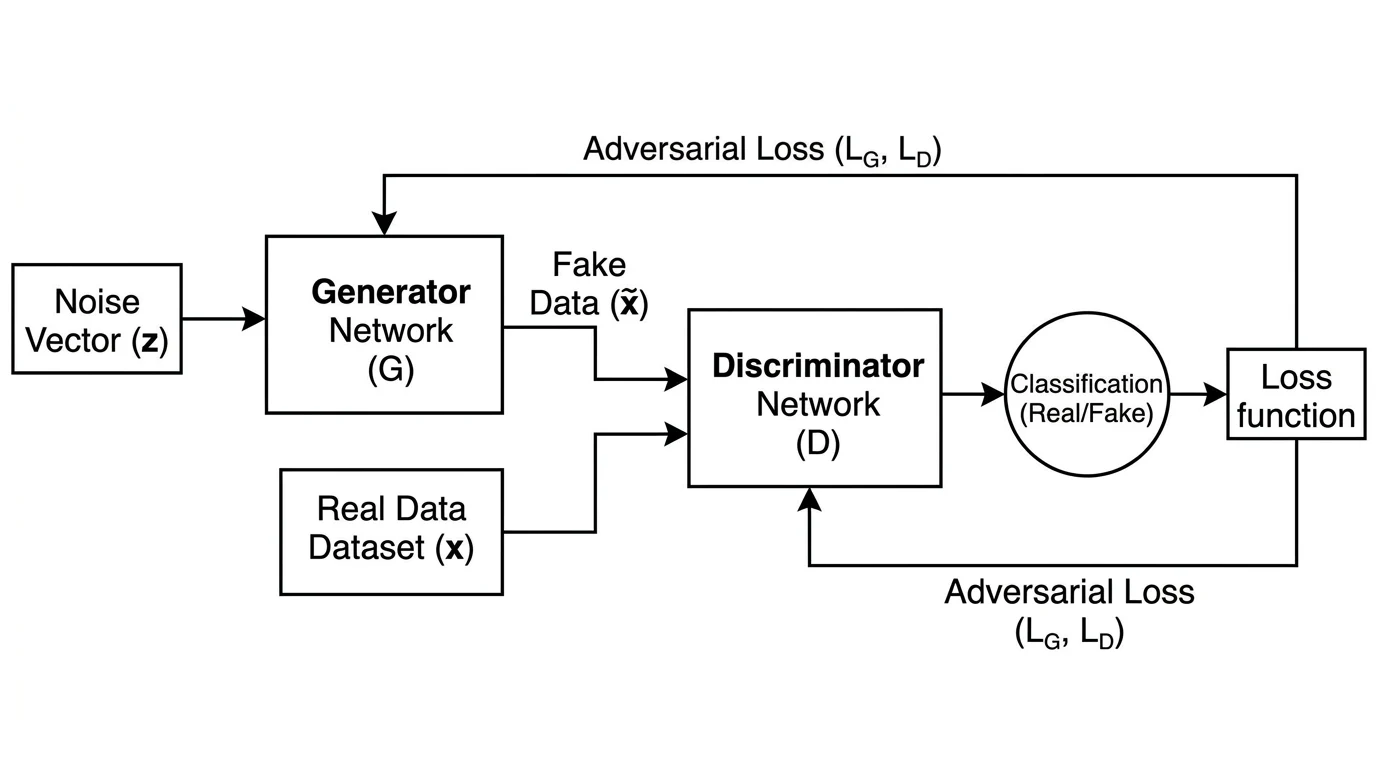
A GAN architecture diagram showing the generator (top) taking noise input and producing a synthetic image, which is passed to the discriminator (bottom) alongside real samples. The discriminator's real/fake output feeds back into generator training.
Conventions:
- Show both networks side by side or stacked, clearly labeled "Generator (G)" and "Discriminator (D)"
- Indicate the latent noise input
zto the generator - Show two paths into the discriminator: real samples (from the training dataset) and fake samples (from G)
- Use dashed arrows or color-coded paths to distinguish real vs. generated data flow
- Label the discriminator output: "Real" or "Fake" probability
6. Autoencoders
Autoencoders have a characteristic "hourglass" or "bottleneck" shape: wide at the input and output, narrow at the latent representation in the middle. This shape is their defining visual feature and should be clearly communicated in the diagram.
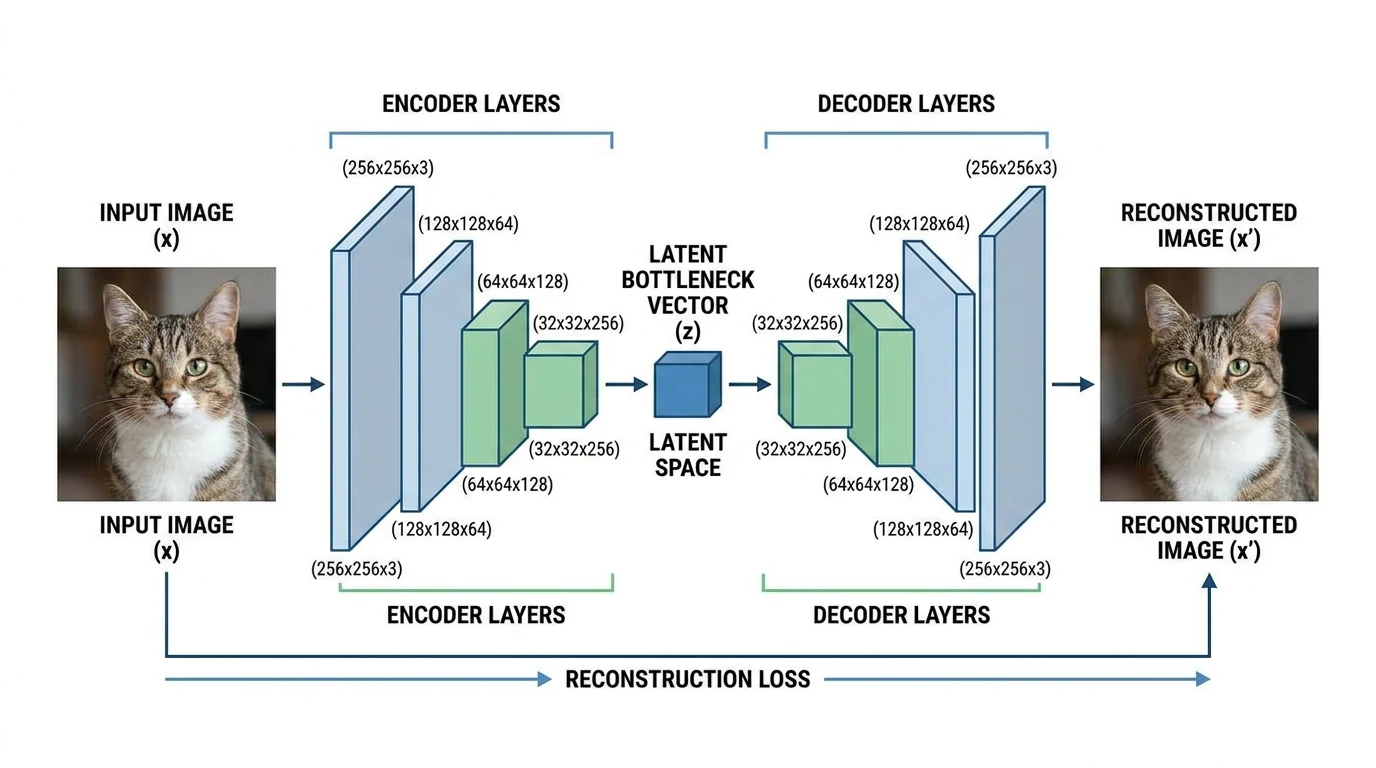
An autoencoder diagram showing the encoder (left) progressively compressing the input through smaller layers to a bottleneck latent representation, then the decoder (right) expanding back to reconstruct the original input.
Conventions:
- Draw the encoder as progressively narrower layers (or smaller blocks)
- Label the bottleneck explicitly: "Latent space: z ∈ ℝⁿ"
- Mirror the encoder structure in the decoder
- Add a dashed horizontal axis of symmetry to emphasize the symmetric architecture
- For variational autoencoders (VAEs), show the mean (μ) and variance (σ²) heads at the bottleneck
Step-by-Step: How to Draw a Neural Network Architecture Diagram
Step 1: Define what the diagram needs to communicate
Before opening any tool, answer: what is the primary audience for this diagram?
- Paper figure: Needs to fit within column width, use vector graphics (SVG or PDF), and follow the visual conventions of your target venue
- Conference poster: Can be larger and more visually elaborate; space permits more annotation
- Internal documentation: Clarity and completeness matter more than aesthetic polish
- Presentation slide: Simplicity wins — remove all non-essential labels
Step 2: Choose the representation convention for your architecture type
Match the visual convention to the architecture type as described above. Do not mix conventions (e.g., drawing CNN layers as circles like an MLP) — this confuses readers who rely on visual conventions to parse diagrams quickly.
Step 3: Sketch the diagram on paper first
A quick pencil sketch takes 5 minutes and saves hours of rearranging elements in a tool. Sketch:
- The overall flow direction (usually left to right)
- The rough number and type of layers
- Where labels will go
- Any inset detail panels needed (e.g., an expanded view of a single attention head)
Step 4: Choose your diagramming tool
| Tool | Best For | Format | Cost |
|---|---|---|---|
| ConceptViz Neural Network Diagram Generator | Fast AI-generated diagrams from text description | PNG/WebP | Free tier |
| NN-SVG (alexlenail.me) | Publication-quality MLP and LeNet-style CNN diagrams | SVG | Free |
| PlotNeuralNet | LaTeX-rendered CNN block diagrams for papers | PDF/LaTeX | Free |
| draw.io / diagrams.net | Custom fully-manual diagrams | SVG/PNG | Free |
| Inkscape | Manual vector editing with full control | SVG | Free |
| PowerPoint / Keynote | Presentation diagrams, not for paper figures | PNG | Paid |
| Netron | Automatically visualizing actual model weights | Web | Free |
For exploratory or documentation purposes, alexlenail.me/NN-SVG is the fastest way to produce a clean MLP or CNN diagram without coding. For actual model files (ONNX, PyTorch, TensorFlow SavedModel), Netron can auto-generate an accurate computation graph from your trained weights — though the output style is not always publication-ready.
Step 5: Draw the layers in order
Start with the input, then draw each subsequent layer in the forward pass direction. For each layer:
- Choose the correct shape (circle, rectangle, 3D block, etc.)
- Apply consistent sizing relative to the actual layer dimensions
- Connect with directional arrows
Step 6: Add dimension labels
Label every layer with the output tensor dimensions. Use a consistent notation — e.g., [B, C, H, W] for batched image tensors in PyTorch convention, or [seq_len, d_model] for Transformer layers. Place dimension labels below or beside each layer consistently throughout the diagram.
Step 7: Add operation labels
Label the operations between layers: "Conv2d", "BatchNorm", "ReLU", "MaxPool", "Linear", "Self-Attention", "LayerNorm". These can be placed on the arrows or as sublabels within the layer shapes.
Step 8: Apply color coding consistently
Pick 3–5 colors and assign each to a layer type. For example:
- Blue: convolutional layers
- Green: activation functions
- Orange: pooling or downsampling
- Purple: fully connected / linear layers
- Gray: normalization layers
Apply this scheme consistently throughout the diagram and include a legend if the color coding is not immediately obvious.
Step 9: Review against the actual model code
The most critical check: verify the diagram matches your actual implementation. Architecture diagram errors in published papers — wrong layer counts, incorrect skip connection placement, missing operations — are surprisingly common and are caught during peer review or replication attempts.
A useful approach: write a torchsummary or model.summary() output alongside your diagram and check that every layer in the summary appears in the diagram.
Tools for Automating Neural Network Diagrams
For researchers who want to generate diagrams programmatically from model definitions:
TensorFlow Playground — interactive browser-based neural network visualizer for understanding how feedforward networks learn. Not for publication figures, but excellent for building intuition and for teaching.
Keras model visualization — tf.keras.utils.plot_model() generates a layer graph from any Keras model. Output is a PNG node-graph style diagram, which can serve as a starting point for creating a polished version.
GitHub: Awesome Neural Network Visualization — a curated list of 20+ tools for neural network visualization maintained by the community. Covers tools from simple block diagrams to interactive 3D renderings.
Towards Data Science: Neural Network Architecture Diagrams — comprehensive visual overview of architectures with diagram conventions. Useful as a reference for what established architectures look like when diagrammed.
Neural Network Diagram Generator
Generate publication-quality neural network architecture diagrams from text descriptions in seconds.
AI Flowchart Generator
Create data flow and system architecture diagrams for ML pipelines.
Common Neural Network Diagram Mistakes
Using the wrong visual convention for the architecture type Drawing a CNN architecture as a circle-and-line MLP diagram (or vice versa) immediately signals unfamiliarity with the field. Match the visual language to the architecture — 3D blocks for CNNs, unrolled timesteps for RNNs, stacked encoder/decoder panels for Transformers.
Omitting tensor dimensions A diagram without dimensions forces the reader to guess the shape of the data at each stage. Always annotate key layers with their output shapes. This is especially critical for attention mechanism diagrams where head count and dimension choices are architecturally significant.
Mixing information densities Some diagrams show every batch normalization and dropout layer; others show only the main structural layers. Mixing these is confusing — choose one level of detail and apply it consistently. For a paper figure, it is usually better to show fewer layers with more annotation than more layers with no annotation.
Diagram doesn't match the code
The most serious mistake in published work. Architecture diagrams that are inconsistent with the actual implementation mislead replication efforts. Always verify the diagram against the actual model definition — ideally by cross-checking with model.summary() or torchinfo.summary().
No legend for color coding If you use color to encode layer type, include a legend. Readers encountering your paper without prior knowledge of your color scheme cannot interpret the colors without one.
Arrows without direction indicators Every arrow in a neural network diagram should have a clear arrowhead indicating data flow direction. Bidirectional arrows (e.g., for autoencoder reconstruction loss or GAN feedback) should use double-headed arrows and be labeled.
Inconsistent node or block sizes If block width is supposed to encode the number of filters or the feature dimension, it must do so consistently. A block that is supposed to represent 512 channels should not visually appear the same size as a block representing 64 channels.
Accessibility Considerations
Neural network diagrams in papers and posters are often inaccessible to readers with color vision deficiencies. Beyond standard accessibility practices:
- Use shape differences in addition to color to distinguish layer types (e.g., rounded corners for activation functions, sharp corners for linear layers)
- Use a colorblind-safe palette — the Okabe-Ito palette is a common recommendation in scientific publishing
- Ensure sufficient contrast between the label text and the background of each shape
Related Reading
- How to Create a Data Flow Diagram — for diagramming how data moves through ML pipelines
- UML Diagram Types Complete Guide — when to use UML activity or component diagrams instead of custom architecture diagrams
- Research Data Visualization Best Practices — broader guidance on figures for academic publications
- Okabe-Ito Palette Hex Codes — colorblind-safe colors for diagrams
- NN-SVG by Alexander LeNail — free browser tool for MLP and CNN diagrams (external)
- PlotNeuralNet on GitHub — LaTeX-based CNN diagram generator (external)
- Netron Model Visualizer — automatically visualize ONNX/PyTorch/TF model graphs (external)
Frequently Asked Questions
What software is best for drawing neural network architecture diagrams?
The best tool depends on your use case. For quick publication-quality MLP and CNN diagrams, NN-SVG (alexlenail.me) is free and requires no coding. For LaTeX-rendered CNN block diagrams, PlotNeuralNet produces the style seen in top conference papers. For fully custom diagrams, draw.io or Inkscape give you complete control. For AI-generated diagrams from text descriptions without manual drawing, ConceptViz Neural Network Diagram Generator is the fastest option.
How do I visualize a neural network from a PyTorch model?
Several options exist: (1) torchinfo (pip install torchinfo) gives a text-based layer summary with shapes; (2) torch.onnx.export followed by Netron gives an interactive computation graph from actual model weights; (3) Keras's plot_model function (for TensorFlow/Keras models) generates a PNG node graph. For publication-quality diagrams, these auto-generated outputs are usually a starting point for manual refinement in a vector graphics tool.
What are the standard conventions for drawing CNN architecture diagrams?
The dominant convention for CNN diagrams uses 3D rectangular blocks (cuboids) to represent feature map tensors. Block width typically represents spatial resolution, block depth represents number of channels, and block height is often kept constant. Layers are arranged left to right in the order of the forward pass. Each block is labeled with its dimensions (H×W×C) and the operation producing it (e.g., 'Conv 3×3, stride 1'). Color coding distinguishes layer types — blue for convolutional layers, orange for pooling, purple for fully connected layers is a common scheme.
How do I draw a Transformer architecture diagram?
The canonical Transformer diagram (from Vaswani et al., 2017) shows the encoder on the left and decoder on the right, each as stacked blocks with '×N' notation indicating repetition. Within each block, sublayers (multi-head attention, feed-forward, layer normalization) are shown as labeled rectangles stacked vertically. Residual (skip) connections are shown as bypass arrows. For encoder-only models like BERT, draw only the encoder stack. For decoder-only models like GPT, draw a single stack with masked self-attention labeled accordingly.
What dimensions should I label on a neural network diagram?
Label the output tensor dimensions at every layer where the shape changes significantly. For image models, use H×W×C notation (height × width × channels). For sequence models, label sequence length and embedding dimension (e.g., 'seq_len × d_model'). Always label the input (including batch size if relevant) and output dimensions. For attention mechanisms, label the number of heads and head dimension. Use consistent notation throughout the diagram — mixing different notations for the same thing is a common source of confusion.
Can I use PowerPoint or Keynote for neural network diagrams in papers?
PowerPoint and Keynote can produce adequate diagrams for slides and internal documentation, but they are generally not recommended for published papers. The main limitation is that they produce raster (PNG/JPG) output by default, which may appear pixelated in print or zoomed PDFs. For papers, prefer SVG or PDF vector outputs from tools like draw.io, Inkscape, or PlotNeuralNet. If you must use PowerPoint, export at 300 DPI minimum and use the 'Save as Picture' option set to SVG if available in your version.
How detailed should a neural network architecture diagram be?
The right level of detail depends on the figure's purpose. For a main paper figure, show the key structural elements — layer types, major dimensions, skip connections, and the overall data flow — but omit per-layer details like exact dropout rates or weight initialization. For a technical appendix or supplementary material, you can include a more detailed diagram with all hyperparameters. For a presentation slide, simplify further — show only 3–5 key layers and the overall shape of the architecture. A diagram with too many elements becomes unreadable; it is better to use a higher-level diagram with an inset showing one component in detail.
How do I draw a GAN architecture diagram?
A GAN diagram must clearly show both the Generator and Discriminator networks and the adversarial relationship between them. Show the Generator receiving a noise vector z as input and producing a synthetic output. Show the Discriminator receiving both real samples (from training data) and fake samples (from the Generator) and outputting a real/fake probability. Use arrows or color coding to distinguish the two paths (real vs. fake) entering the Discriminator. Show the feedback path from the Discriminator's output back to the Generator to indicate that Generator training depends on Discriminator predictions.
分類
更多文章
")
15 Illustration and Infographic Design Styles Explained (2026)
Explore 15 illustration and infographic design styles with examples: flat, isometric, 3D, hand-drawn, minimalist, vector, cartoon, line art and more.
")
How to Create a Tree Diagram: 5 Types, Examples & Free AI Generator (2026)
Learn how to create tree diagrams for probability, decisions, org charts, and more. Step-by-step guide with real examples — plus a free AI tree diagram maker.
: Tips, Slide Examples & Presentation Guide (2026)")
3 Minute Thesis (3MT): Tips, Slide Examples & Presentation Guide (2026)
3MT tips and winning slide examples. Learn how to design your 3 Minute Thesis slide, structure your presentation, and avoid common mistakes.