")
12 лучших бесплатных программ для создания диаграмм (Open Source, 2026)
Сравнение 12 лучших бесплатных инструментов для создания диаграмм с открытым исходным кодом — draw.io, Excalidraw, Mermaid, PlantUML и другие. Функции, GitHub-звёзды и рекомендации по выбору.
Лучшие open source инструменты для диаграмм и онлайн-досок
Если вам нужно документировать архитектуру ПО, строить блок-схемы для бизнес-процессов или объяснять студентам сетевые топологии, open source инструменты для диаграмм могут стать сильной альтернативой Visio, Lucidchart или Miro. Они бесплатны, прозрачны, развиваются сообществом и не привязывают вас к одному вендору.
В этом обзоре мы сравниваем лучшие open source приложения для диаграмм и онлайн-досок, актуальные в 2026 году. Внутри вы найдете визуальные редакторы с drag-and-drop интерфейсом, diagram-as-code инструменты для разработчиков и коллаборативные whiteboard-решения для брейнштормов, а также поймете, где в эту картину вписываются AI-инструменты вроде ConceptViz.
Генератор диаграмм из текста
Преобразуйте текстовое описание в профессиональную диаграмму за секунды. AI поддерживает блок-схемы, sequence diagrams, сетевые схемы и многое другое.
Попробовать бесплатно →Почему стоит выбрать open source инструменты для диаграмм?
Прежде чем переходить к конкретным сервисам, полезно понять, почему open source особенно важен именно в задачах визуализации:
| Преимущество | Описание |
|---|---|
| Без лицензионных платежей | Бесплатно навсегда — без оплаты за пользователя и без подписочных уровней |
| Без vendor lock-in | Можно экспортировать в стандартные форматы (SVG, PNG, PDF) и при необходимости легко сменить инструмент |
| Прозрачность | Исходный код можно аудировать, что важно для компаний с повышенными требованиями к безопасности |
| Развитие сообществом | Новые функции и исправления добавляют тысячи разработчиков по всему миру |
| Self-hosting | Многие решения можно развернуть на своих серверах для полного контроля над данными |
| Гибкая настройка | При желании инструмент можно адаптировать под свой процесс и интеграции |
| Офлайн-доступ | Многие программы работают полностью без интернета |
Компромисс в том, что open source решения иногда уступают коммерческим сервисам в полировке интерфейса, уровне поддержки и готовых интеграциях. Но для многих команд их преимущества заметно перевешивают эти минусы.
Визуальные open source редакторы диаграмм
Эти инструменты предлагают визуальный интерфейс с drag-and-drop, близкий к коммерческим редакторам диаграмм.
1. Draw.io (diagrams.net)
Золотой стандарт open source диаграмм
Draw.io, который теперь официально называется diagrams.net, пожалуй, самый популярный open source инструмент для построения диаграмм в мире. Он работает в браузере, умеет работать офлайн и интегрируется почти со всеми популярными платформами.
Ключевые возможности:
- Большие библиотеки фигур для блок-схем, UML, сетевых диаграмм, планов помещений и других сценариев
- Прямая интеграция с Google Drive, OneDrive, Dropbox, GitHub и GitLab
- Офлайн-приложение для Windows, macOS и Linux
- Плагины для Confluence и Jira
- Экспорт в SVG, PNG, PDF, XML, HTML и VSDX (формат Visio)
- История версий и поддержка diff для файлов диаграмм
- Полностью бесплатное использование без функциональных ограничений
Лучше всего подходит для: универсальных диаграмм, схем архитектуры, IT-сетей и команд, которые уже живут в Atlassian или Google Workspace.
| Параметр | Значение |
|---|---|
| Лицензия | Apache 2.0 |
| GitHub stars | 45,000+ |
| Платформы | Web, Desktop (Electron), Mobile |
| Self-hosting | Да |
| Совместная работа | Через облачные хранилища |
Ограничения: интерфейс может показаться перегруженным для простых схем. Для совместного редактирования в реальном времени нужен внешний облачный backend, встроенного multiplayer здесь нет. Визуально инструмент скорее функциональный, чем современный.
2. Excalidraw
Онлайн-доска с рисованным стилем, которую любят разработчики
Excalidraw резко вырос в популярности благодаря узнаваемому hand-drawn стилю и почти нулевому порогу входа. Это один из лучших вариантов для быстрых скетчей, обсуждения архитектуры и совместной работы на онлайн-доске.
Ключевые возможности:
- Рисованный визуальный стиль, за счет которого схемы выглядят проще и дружелюбнее
- Совместная работа в реальном времени с end-to-end шифрованием
- Бесконечный холст без настройки: открыл и сразу рисуешь
- Достаточно богатый набор фигур, стрелок, коннекторов и текста
- Публичная библиотека готовых компонентов и шаблонов
- Возможность встраивания в другие приложения через React-компонент
- Совместные комнаты без обязательной регистрации
Лучше всего подходит для: быстрых набросков, обсуждений архитектуры, брейнштормов и команд, которым важны простота и визуальная чистота.
| Параметр | Значение |
|---|---|
| Лицензия | MIT |
| GitHub stars | 90,000+ |
| Платформы | Web, Embeddable |
| Self-hosting | Да |
| Совместная работа | Встроенная, в реальном времени |
Ограничения: не лучший выбор для строгих формальных диаграмм, потому что рисованный стиль здесь намеренный. Библиотеки фигур беднее, чем у draw.io. Нет встроенной поддержки UML, BPMN и других стандартизированных нотаций.
3. LibreOffice Draw
Надежный десктопный вариант для офлайн-работы
LibreOffice Draw входит в пакет LibreOffice и представляет собой полноценный редактор векторной графики для диаграмм, блок-схем и технических иллюстраций. Из open source решений он ближе всего к Microsoft Visio.
Ключевые возможности:
- Редактирование узлов и кривых Безье для точной настройки фигур
- Точки соединения и автоматическая прокладка связей в блок-схемах
- Поддержка слоев для сложных схем
- Система шаблонов для единообразного оформления
- Интеграция с другими приложениями LibreOffice: Writer, Impress и Calc
- Экспорт в SVG, PDF, PNG и ODP
- Полностью офлайн-режим
Лучше всего подходит для: пользователей, которым нужен desktop-first инструмент, работающий без интернета и хорошо встраивающийся в документооборот.
| Параметр | Значение |
|---|---|
| Лицензия | MPL 2.0 |
| GitHub stars | N/A (зеркало LibreOffice) |
| Платформы | Windows, macOS, Linux |
| Self-hosting | Desktop app |
| Совместная работа | Нет встроенной |
Ограничения: интерфейс выглядит устаревшим по сравнению с современными веб-инструментами. Нет совместного редактирования в реальном времени. Обновляется медленнее, а обучение новичков занимает больше времени.
4. yEd Graph Editor
Сильные алгоритмы автоматической компоновки
yEd — это бесплатный редактор графов, известный прежде всего своими сильными алгоритмами авто-раскладки. Формально он не полностью open source: десктопная версия распространяется как freeware, а yEd Live является проприетарным веб-продуктом. Но в практических сценариях он по-прежнему часто попадает в сравнения рядом с open source инструментами.
Ключевые возможности:
- Более десятка алгоритмов авто-раскладки: hierarchical, organic, orthogonal, circular, tree и другие
- Импорт данных из Excel, GraphML и других форматов
- Большая панель свойств для тонкой настройки оформления
- Группировка и сворачивание узлов для сложных иерархических схем
- Экспорт в SVG, PNG, PDF и EMF
Лучше всего подходит для: больших и сложных графов, где ручная компоновка непрактична, например для сетевых топологий, оргструктур и графов зависимостей.
| Параметр | Значение |
|---|---|
| Лицензия | Freeware (desktop), Proprietary (web) |
| Платформы | Windows, macOS, Linux, Web |
| Self-hosting | Только desktop |
| Совместная работа | Нет |
Ограничения: это не настоящий open source продукт. Интерфейс выглядит устаревшим, веб-версия заметно слабее десктопной, а совместного редактирования в реальном времени нет.
Diagram-as-Code инструменты
Эти инструменты работают иначе: вы пишете код или разметку, а система рендерит из нее диаграмму. Такой подход особенно подходит разработчикам, которым нужны схемы в version control, автогенерация документации и CI/CD workflow.
5. Mermaid.js
Diagrams in Markdown, rendered everywhere
Mermaid has become the de facto standard for diagram-as-code in documentation. Write simple text syntax, and Mermaid renders flowcharts, sequence diagrams, Gantt charts, class diagrams, and more. Its native integration with GitHub, GitLab, Notion, and other platforms makes it incredibly accessible.
Key features:
- Simple, readable text syntax for 15+ diagram types
- Native rendering in GitHub Markdown files (no plugins needed)
- Supports flowcharts, sequence diagrams, class diagrams, ER diagrams, Gantt charts, pie charts, gitgraph, and more
- Active development with regular new diagram types
- Embeddable via CDN or npm package
- Live editor at mermaid.live for quick prototyping
Best for: Developers writing documentation, README files, and technical specs that need to live alongside code.
| Detail | Info |
|---|---|
| License | MIT |
| GitHub stars | 75,000+ |
| Platform | Web, CLI, Embeddable |
| Self-hosting | Yes |
| Collaboration | Via version control |
Example syntax:
flowchart LR
    A[User Request] --> B{Authenticated?}
    B -->|Yes| C[Process Request]
    B -->|No| D[Login Page]
    C --> E[Return Response]
Limitations: Limited styling control — diagrams look the same. Auto-layout can produce awkward results for complex diagrams. No drag-and-drop editing. Debugging layout issues requires trial and error with the text syntax.
For more on working with Mermaid, see our guide on converting Mermaid diagrams to images.
6. PlantUML
The veteran of diagram-as-code
PlantUML has been around since 2009 and remains the most feature-rich diagram-as-code tool available. It excels at UML diagrams but supports far more types than its name suggests.
Key features:
- Comprehensive UML support: class, sequence, activity, use case, component, deployment, object, and state diagrams
- Non-UML diagrams: wireframes, Gantt charts, mind maps, JSON/YAML visualization
- Advanced customization with themes, sprites, and custom styles
- Integration with IDEs (VS Code, IntelliJ), wikis, and documentation tools
- Runs as a Java application — self-host anywhere
- Mature, stable, and well-documented
Best for: Software engineering teams that need formal UML documentation, especially for enterprise architecture and design specifications.
| Detail | Info |
|---|---|
| License | GPL v3 |
| GitHub stars | 11,000+ |
| Platform | Java (cross-platform), Web |
| Self-hosting | Yes |
| Collaboration | Via version control |
Limitations: Requires Java runtime. Steeper learning curve than Mermaid. The rendering engine produces a distinctive "PlantUML look" that some find dated. Performance can be slow for very large diagrams.
7. Graphviz
The original graph visualization engine
Graphviz (Graph Visualization Software) is a classic tool developed at AT&T Labs. It uses the DOT language to describe graphs and has sophisticated layout algorithms that handle even very large graphs efficiently.
Key features:
- Multiple layout engines: dot (hierarchical), neato (spring model), fdp (force-directed), circo (circular), twopi (radial)
- Handles graphs with thousands of nodes
- Widely used in academic research and data science
- Available as a command-line tool and library
- Integration with many programming languages (Python, R, Java, etc.)
Best for: Automated graph generation from data, academic papers, and large-scale network visualization.
| Detail | Info |
|---|---|
| License | EPL 1.0 |
| GitHub stars | 8,000+ |
| Platform | CLI (cross-platform) |
| Self-hosting | Yes |
| Collaboration | Via version control |
Limitations: Command-line only — no visual editor. Dated visual output. The DOT syntax is less intuitive than Mermaid. Not actively developed with new features.
Collaborative Whiteboard Tools
These tools focus on real-time collaboration and free-form drawing, with diagramming as one of many capabilities.
8. WBO (Whiteboard Online)
Simple, open source collaborative whiteboard
WBO is a lightweight, open source online whiteboard that allows multiple users to draw simultaneously in real time. It is designed for simplicity — no account required, just share a link.
Key features:
- Instant collaboration with a shared URL
- Drawing tools: freehand, lines, rectangles, circles, text
- No sign-up required
- Self-hostable with Docker
- Lightweight and fast
Best for: Quick collaborative sketching sessions, teaching, and brainstorming without any setup.
| Detail | Info |
|---|---|
| License | AGPL v3 |
| GitHub stars | 2,000+ |
| Platform | Web |
| Self-hosting | Yes (Docker) |
| Collaboration | Built-in real-time |
Limitations: Very basic drawing tools — no diagram-specific shapes. No export to standard formats. No templates or shape libraries. Not suitable for formal diagrams.
Comparison Table: All Open Source Diagramming Tools
| Tool | Type | License | GitHub Stars | Self-Host | Collab | Best Diagram Types |
|---|---|---|---|---|---|---|
| Draw.io | GUI | Apache 2.0 | 45K+ | Yes | Cloud sharing | Flowcharts, UML, Network |
| Excalidraw | Whiteboard | MIT | 90K+ | Yes | Real-time | Sketches, Architecture |
| LibreOffice Draw | Desktop | MPL 2.0 | N/A | Desktop | None | Technical, Flowcharts |
| yEd | GUI | Freeware | N/A | Desktop | None | Large graphs, Networks |
| Mermaid.js | Code | MIT | 75K+ | Yes | VCS | Flowcharts, Sequence, ER |
| PlantUML | Code | GPL v3 | 11K+ | Yes | VCS | UML, Architecture |
| Graphviz | Code | EPL 1.0 | 8K+ | Yes | VCS | Graphs, Networks |
| WBO | Whiteboard | AGPL v3 | 2K+ | Yes | Real-time | Freehand sketches |
How to Choose the Right Tool
Choosing a diagramming tool depends on your workflow, team size, and diagram types. Use this decision framework:
For Software Developers
- Documentation that lives with code: Use Mermaid.js — it renders natively on GitHub and GitLab
- Quick architecture sketches: Use Excalidraw — open a browser and start drawing
- Formal UML documentation: Use PlantUML — the most complete UML support available
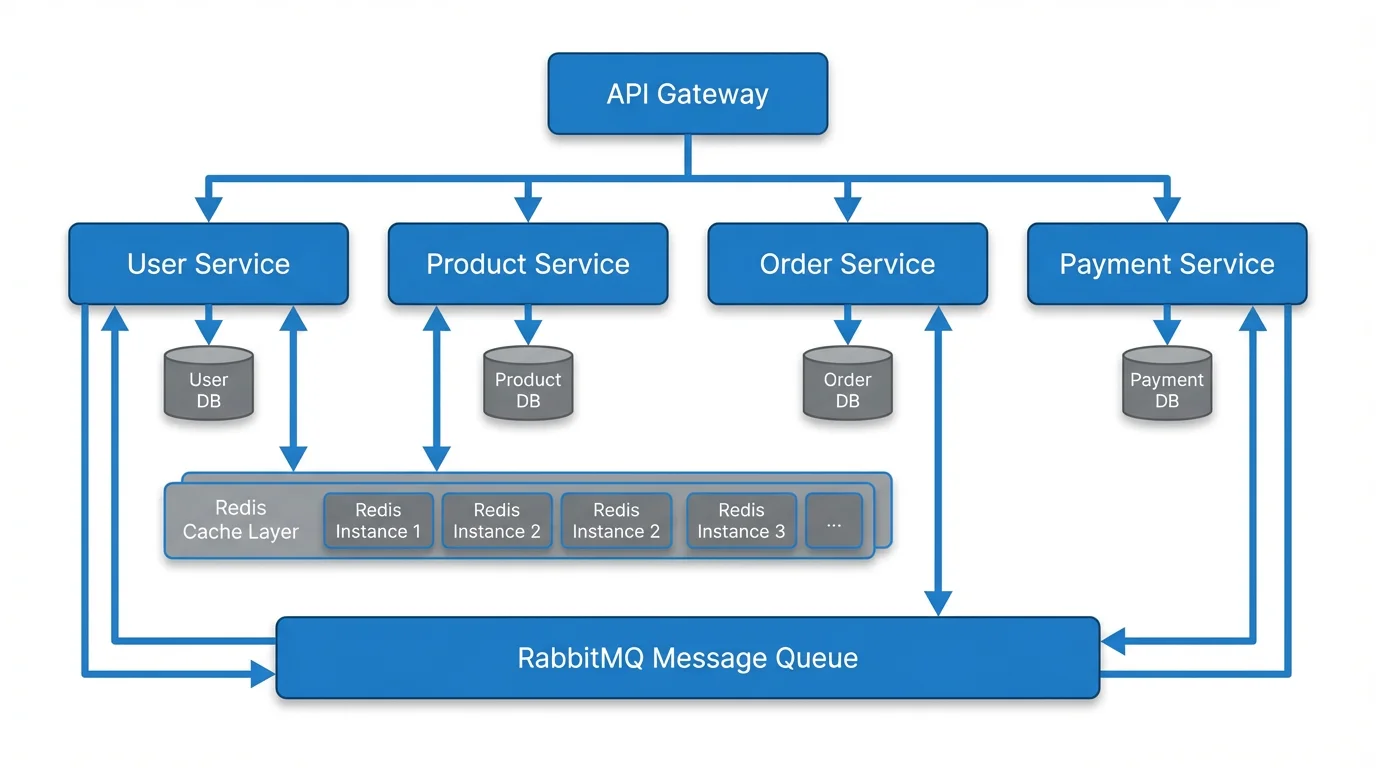
- Complex system diagrams: Use Draw.io — the most versatile general-purpose tool
For Non-Technical Teams
- Business process flowcharts: Use Draw.io — intuitive drag-and-drop with rich shape libraries
- Brainstorming and workshops: Use Excalidraw — the hand-drawn style encourages creative thinking
- Quick comparison diagrams: Use ConceptViz — describe what you need in plain text and get a diagram in seconds
For Educators
- Classroom whiteboarding: Use Excalidraw or WBO — no setup, instant collaboration
- Curriculum diagrams: Use Draw.io — save to Google Drive and embed in Google Docs
- Student assignments: Use Mermaid.js — teaches students text-based thinking while creating visuals
For Data Scientists and Researchers
- Automated graph generation: Use Graphviz — integrates with Python, R, and Jupyter
- Publication figures: Use Draw.io — export to SVG for vector-quality figures
- Reproducible diagrams: Use Mermaid or PlantUML — diagrams are just text files in your repository
The AI Alternative: When Open Source Is Not Enough
Open source diagramming tools are powerful but require manual effort. You either drag shapes around a canvas or write code syntax — both demand time and knowledge of the tool.
AI-powered diagram generators take a different approach. You describe what you need in natural language, and the AI creates the diagram for you. This is particularly useful when:
- You need a diagram quickly and do not want to learn a new tool
- You know what you want to visualize but not how to structure it
- You are creating diagrams for presentations where speed matters more than precision
ConceptViz is not open source, but it offers a free tier that covers most use cases. It supports flowcharts, sequence diagrams, Venn diagrams, network diagrams, and more — all generated from text descriptions.
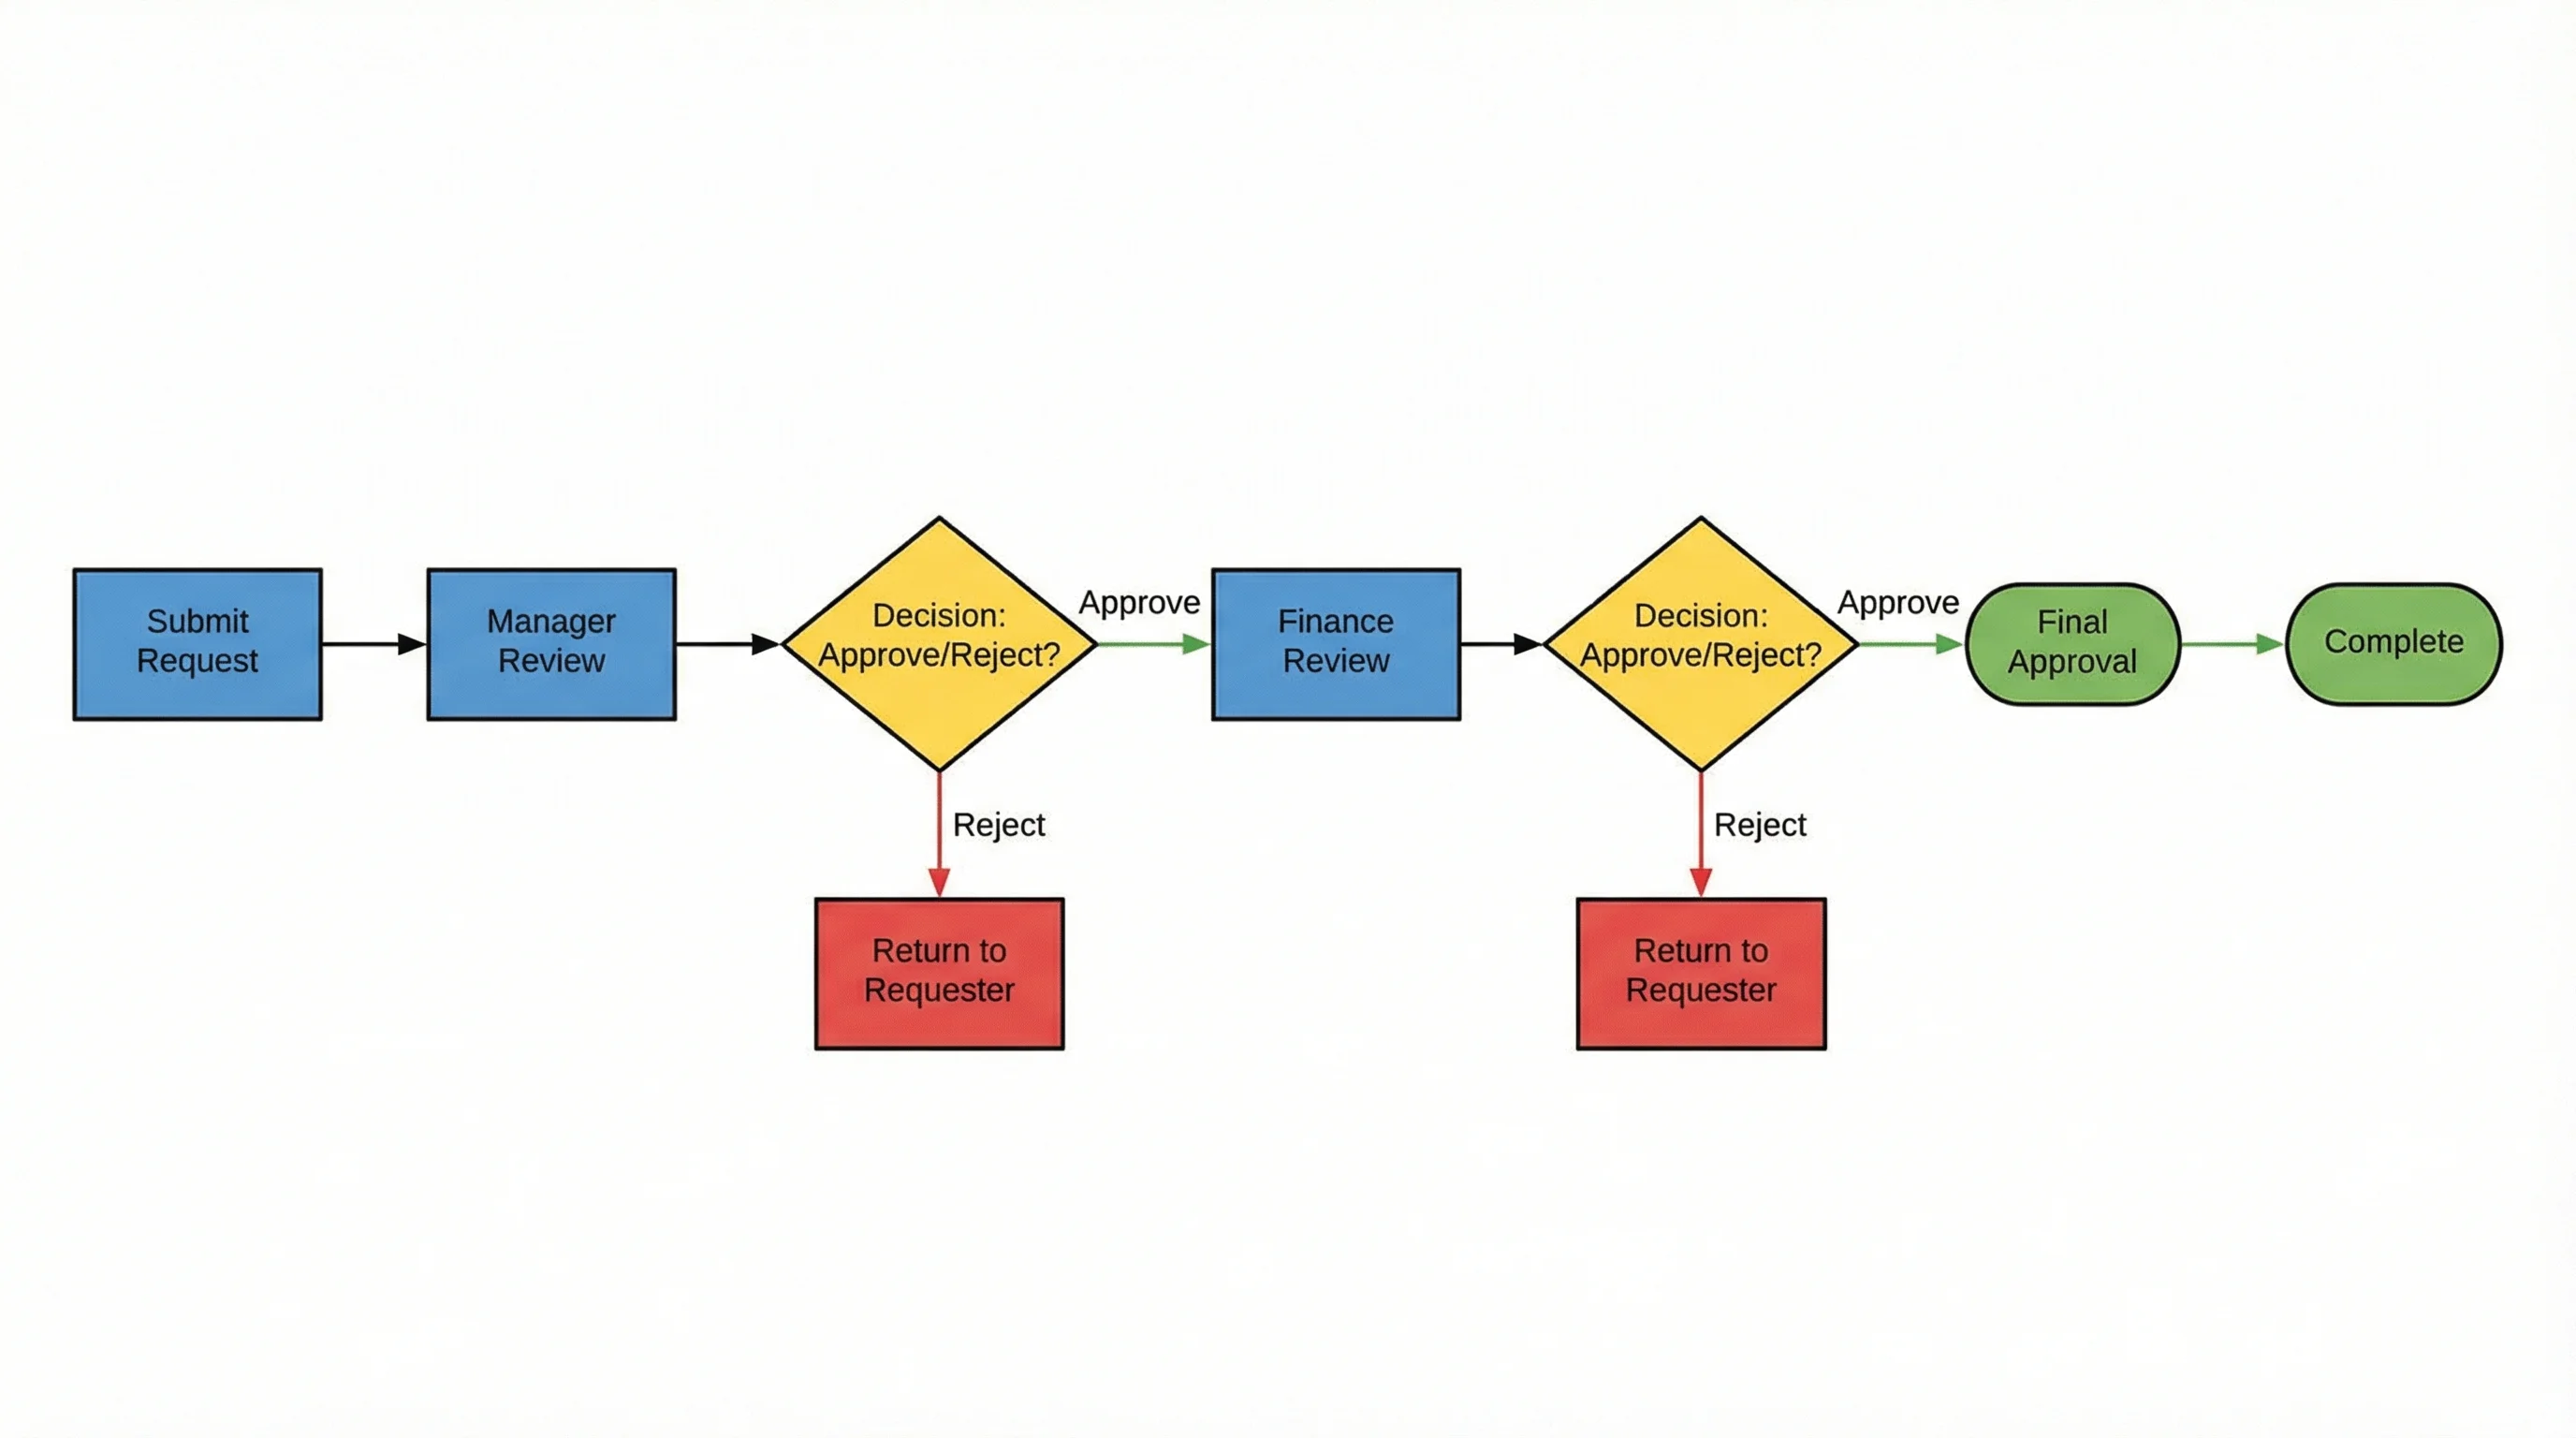
AI Flowchart Generator
Describe your process in plain text and get a professional flowchart instantly. No drag-and-drop needed.
The ideal setup for many teams is to combine open source tools for detailed, precise work (like draw.io for architecture diagrams or Mermaid for documentation) with AI-powered tools for quick, ad-hoc diagram creation.
Setting Up Open Source Diagramming Tools
Here are quick-start instructions for the most popular options:
Draw.io (No Installation Needed)
- Visit app.diagrams.net
- Choose where to save your diagrams (Google Drive, OneDrive, local device)
- Select a template or start with a blank diagram
- Start dragging shapes from the left panel
For desktop use, download the Electron app from the official releases page.
Excalidraw (No Installation Needed)
- Visit excalidraw.com
- Start drawing immediately — no account required
- Share collaboration links with your team
- Export to PNG, SVG, or Excalidraw's native JSON format
Mermaid.js (For Developers)
Add Mermaid diagrams to any GitHub or GitLab Markdown file:
```mermaid
flowchart TD
    A[Start] --> B{Decision}
    B -->|Yes| C[Action 1]
    B -->|No| D[Action 2]
    C --> E[End]
    D --> E
```
For live editing, use the Mermaid Live Editor.
PlantUML (Requires Java)
- Install Java Runtime Environment (JRE 8+)
- Download plantuml.jar from the official site
- Create a
.pumlfile with your diagram code - Run
java -jar plantuml.jar diagram.pumlto generate the image
For VS Code users, install the "PlantUML" extension for live preview.
Frequently Asked Questions
What is the best free open source diagramming tool?
Draw.io (diagrams.net) is widely considered the best overall open source diagramming tool. It is completely free with no feature restrictions, works in the browser and as a desktop app, and supports virtually every diagram type including flowcharts, UML, network diagrams, and more. For developer-focused workflows, Mermaid.js is the best choice due to its native GitHub integration.
Is draw.io really open source?
Yes, draw.io (diagrams.net) is open source under the Apache 2.0 license. The source code is publicly available on GitHub. You can self-host it, modify it, and use it without any licensing fees. The company behind it (JGraph) maintains the project and offers commercial integrations for Atlassian products.
What is the difference between a diagramming tool and a whiteboarding tool?
Diagramming tools (like draw.io, PlantUML, Mermaid) focus on creating structured diagrams with specific shapes, connectors, and notation standards. They produce precise, formal output. Whiteboarding tools (like Excalidraw, WBO, Miro) prioritize free-form drawing, collaboration, and brainstorming. The hand-drawn aesthetic of whiteboard tools encourages exploration over precision.
Can I use Mermaid diagrams in GitHub README files?
Yes, GitHub natively renders Mermaid diagrams in Markdown files. Simply wrap your Mermaid code in a fenced code block with the 'mermaid' language identifier. When anyone views the file on GitHub, the diagram is rendered automatically — no plugins or external services needed. GitLab, Notion, and many other platforms also support Mermaid rendering.
Which open source diagramming tool has real-time collaboration?
Excalidraw offers the best real-time collaboration experience among open source diagramming tools. It supports live collaborative editing with end-to-end encryption, and you can create a shared room without any sign-up. WBO (Whiteboard Online) also supports real-time collaboration but with more basic drawing tools. Draw.io supports collaboration through cloud storage sharing but not real-time co-editing.
Is there an open source alternative to Microsoft Visio?
Draw.io (diagrams.net) is the closest open source alternative to Microsoft Visio. It supports Visio file import and export (VSDX format), has extensive shape libraries similar to Visio's stencils, and offers a comparable drag-and-drop editing experience. LibreOffice Draw is another option for desktop users who prefer an offline application.
What is diagram-as-code and why should I use it?
Diagram-as-code means writing diagrams in a text-based syntax (like Mermaid or PlantUML) rather than using a visual editor. Benefits include version control (diagrams are just text files), automated generation in CI/CD pipelines, easy maintenance alongside code documentation, and no dependency on proprietary file formats. The trade-off is that you lose drag-and-drop convenience.
Can AI tools replace open source diagramming software?
AI tools like ConceptViz complement rather than replace open source diagramming software. AI excels at quickly generating standard diagram types from text descriptions — perfect for presentations, brainstorming, and first drafts. Open source tools are better for precise, detailed work where you need full control over layout, notation standards, and integration with development workflows. Many teams use both: AI for speed, open source for precision.
Conclusion
The open source diagramming ecosystem in 2026 is remarkably mature. Draw.io covers nearly every general diagramming need, Excalidraw dominates collaborative whiteboarding, Mermaid has become the standard for documentation-embedded diagrams, and PlantUML remains the most powerful UML tool available.
For most teams, the right approach is not choosing a single tool but combining them based on context:
- Draw.io for detailed architecture and process diagrams
- Excalidraw for quick sketches and team discussions
- Mermaid for diagrams in documentation and README files
- ConceptViz for instant AI-generated diagrams when speed matters
All of these tools (except ConceptViz, which offers a free tier) are completely free and open source, giving you full control over your diagramming workflow without any licensing costs or vendor lock-in.
Explore more diagramming resources: UML diagram types complete guide, ER diagrams for research, how to make scientific diagrams for research papers, and mapping diagram complete guide.
Категории
Ещё публикации
")
How to Create a Scatter Plot Diagram: Complete Guide for Researchers & Students (2026)
Learn how to draw a scatter diagram in Excel, Python, R, and with AI tools. Step-by-step scatter plot guide with best practices, examples, and common mistakes to avoid.
")
Free Photosynthesis Diagram Worksheets for Teachers (2026)
Download free printable photosynthesis diagram worksheets for elementary, middle, and high school. Includes labeled diagrams, blank worksheets for quizzes, light & dark reaction visuals, and hands-on activities aligned with NGSS standards.

Ear Anatomy: Parts of the Human Ear Explained
Learn human ear anatomy: the outer ear (pinna, ear canal), middle ear (eardrum, ossicles), and inner ear (cochlea, semicircular canals), plus how hearing works.