Process Flow Diagram Generator for Process & Plant Design
Create a process flow diagram (PFD) with AI. Describe your process and get a clean diagram of the major equipment — tanks, pumps, reactors, columns, and heat exchangers — connected by labeled material-flow streams. Download as PNG.
AI Process Flow Diagram Generator
By using ConceptViz, you agree not to generate or edit adult, sexual, explicit, unsafe, or policy-violating content. See Content Policy.
Gratuit à essayer ·
Your process flow diagram will appear here
Describe the major equipment and flow order
Process Flow Diagram Examples
Major equipment and material streams for chemical and process engineering
Simple Process PFD
The big picture — major equipment connected by labeled material-flow streams.
Distillation Process
A unit operation — column with condenser, reflux drum, reboiler, and products.
PFD Equipment Symbols
The standard equipment symbols used on a PFD, labeled.
Water Treatment
From intake to clean water — coagulation, sedimentation, filtration, disinfection.
Ammonia Plant
A full plant overview with a recycle loop — feed compression, reactor, separator.
PFD with Stream Table
Numbered streams with a data table — the way real PFDs present conditions.
What is a process flow diagram (PFD)?
A process flow diagram (PFD) is an engineering drawing that shows the overall flow of material through a process and the major equipment involved — tanks, pumps, reactors, distillation columns, and heat exchangers — connected by labeled streams. It gives the big-picture view of how a plant works, often with a stream table listing temperatures, pressures, and flow rates. PFDs are used in chemical, process, and manufacturing engineering.
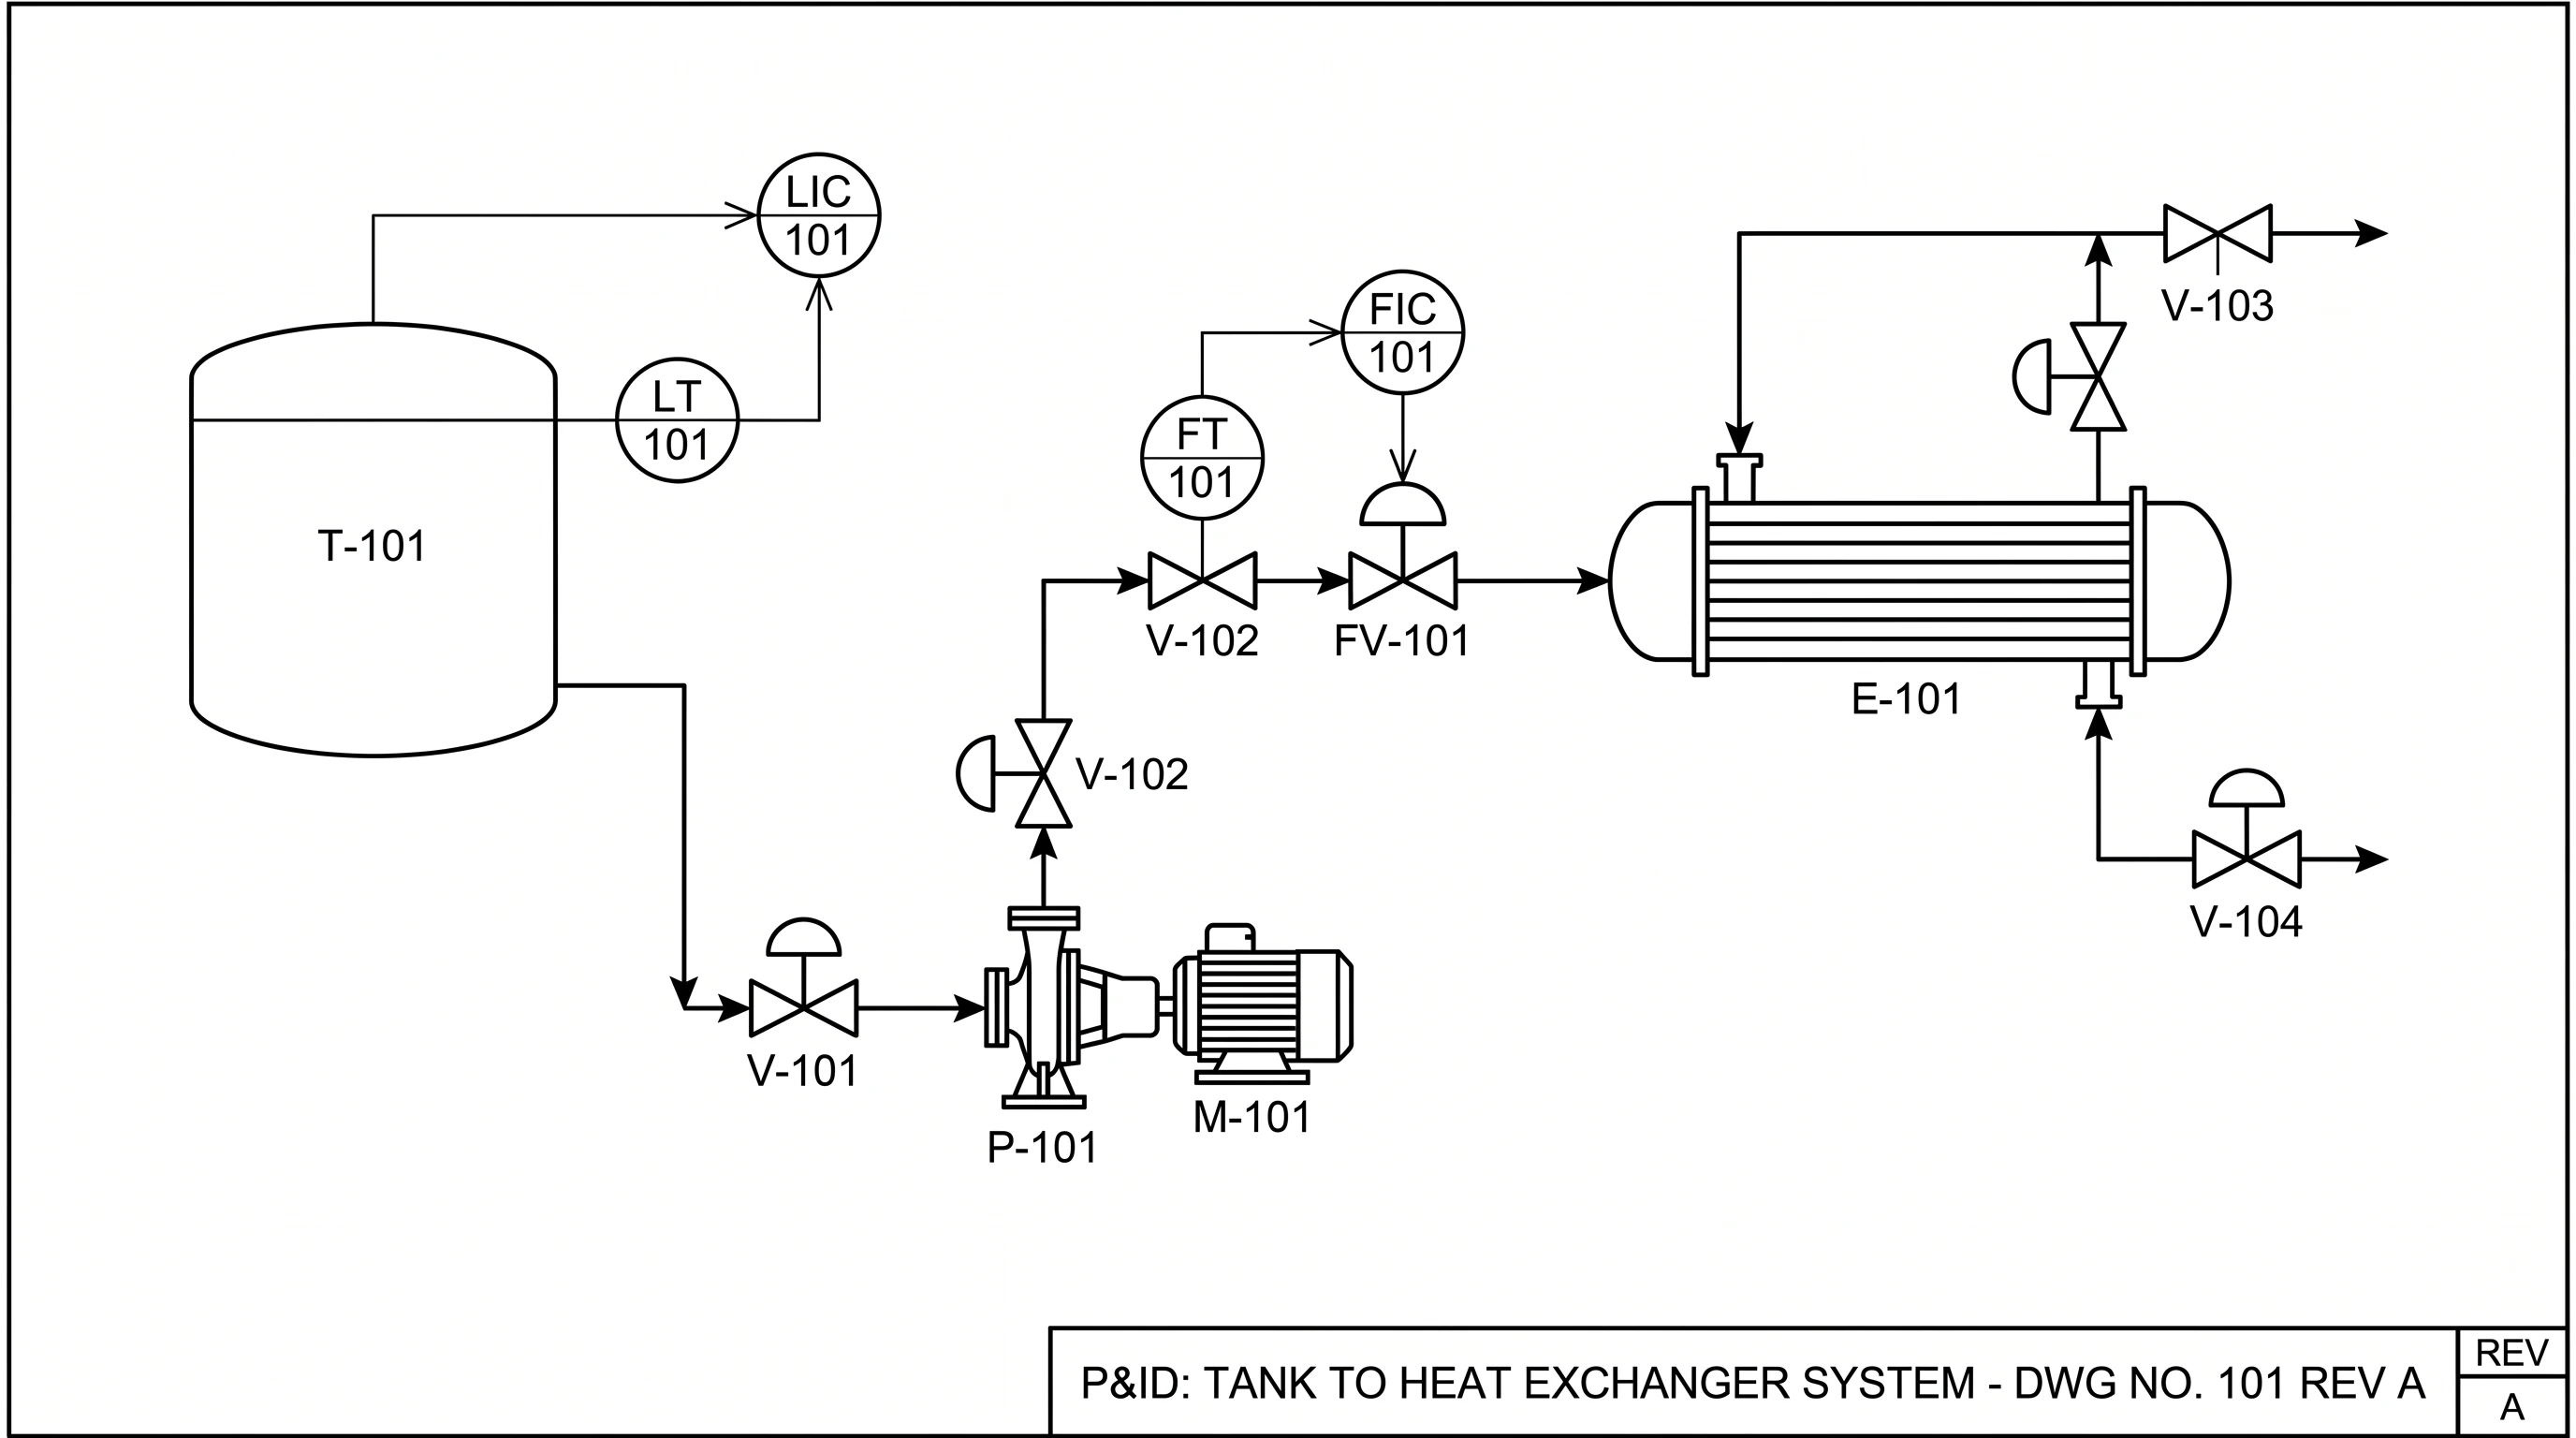
PFD vs P&ID
A PFD shows the conceptual overview: the major equipment and the main material streams, plus key operating conditions. A P&ID (Piping and Instrumentation Diagram) is the detailed version that adds every pipe, valve, instrument, and control loop. Engineers usually draw the PFD first to capture the process, then develop the P&ID for construction and operation. For the detailed version, use the P&ID maker.
What a PFD includes
- Major equipment: tanks, pumps, compressors, reactors, columns, and heat exchangers, each labeled with a tag.
- Process flow streams: arrows showing the direction material moves between units, often numbered.
- Operating conditions: a stream table with temperature, pressure, and flow rate for each numbered stream.
- Recycle and utility streams where relevant.
How to make a process flow diagram with AI
Describe your process step by step — the feed, the major units it passes through, and the products and recycle streams — and the tool draws a PFD with labeled equipment and flow arrows. Mention specific equipment (reactor, distillation column, heat exchanger) and the order of operations for the most accurate result. Generate a few options and pick the clearest, then download it.
Where PFDs are used
PFDs are core documents in chemical and process engineering, used to communicate plant design, train operators, and plan modifications. They also appear in coursework and textbooks to teach unit operations. Because they focus on equipment and flow rather than fine detail, they are ideal for explaining how a process works at a glance.
Questions Fréquentes
Related Engineering Tools
 Engineering
P&ID Maker
Create detailed piping and instrumentation diagrams with ISA symbols and instrument tags.
 Engineering
Schematic Diagram Maker
Create technical schematic diagrams for systems, equipment, and processes.
 Software
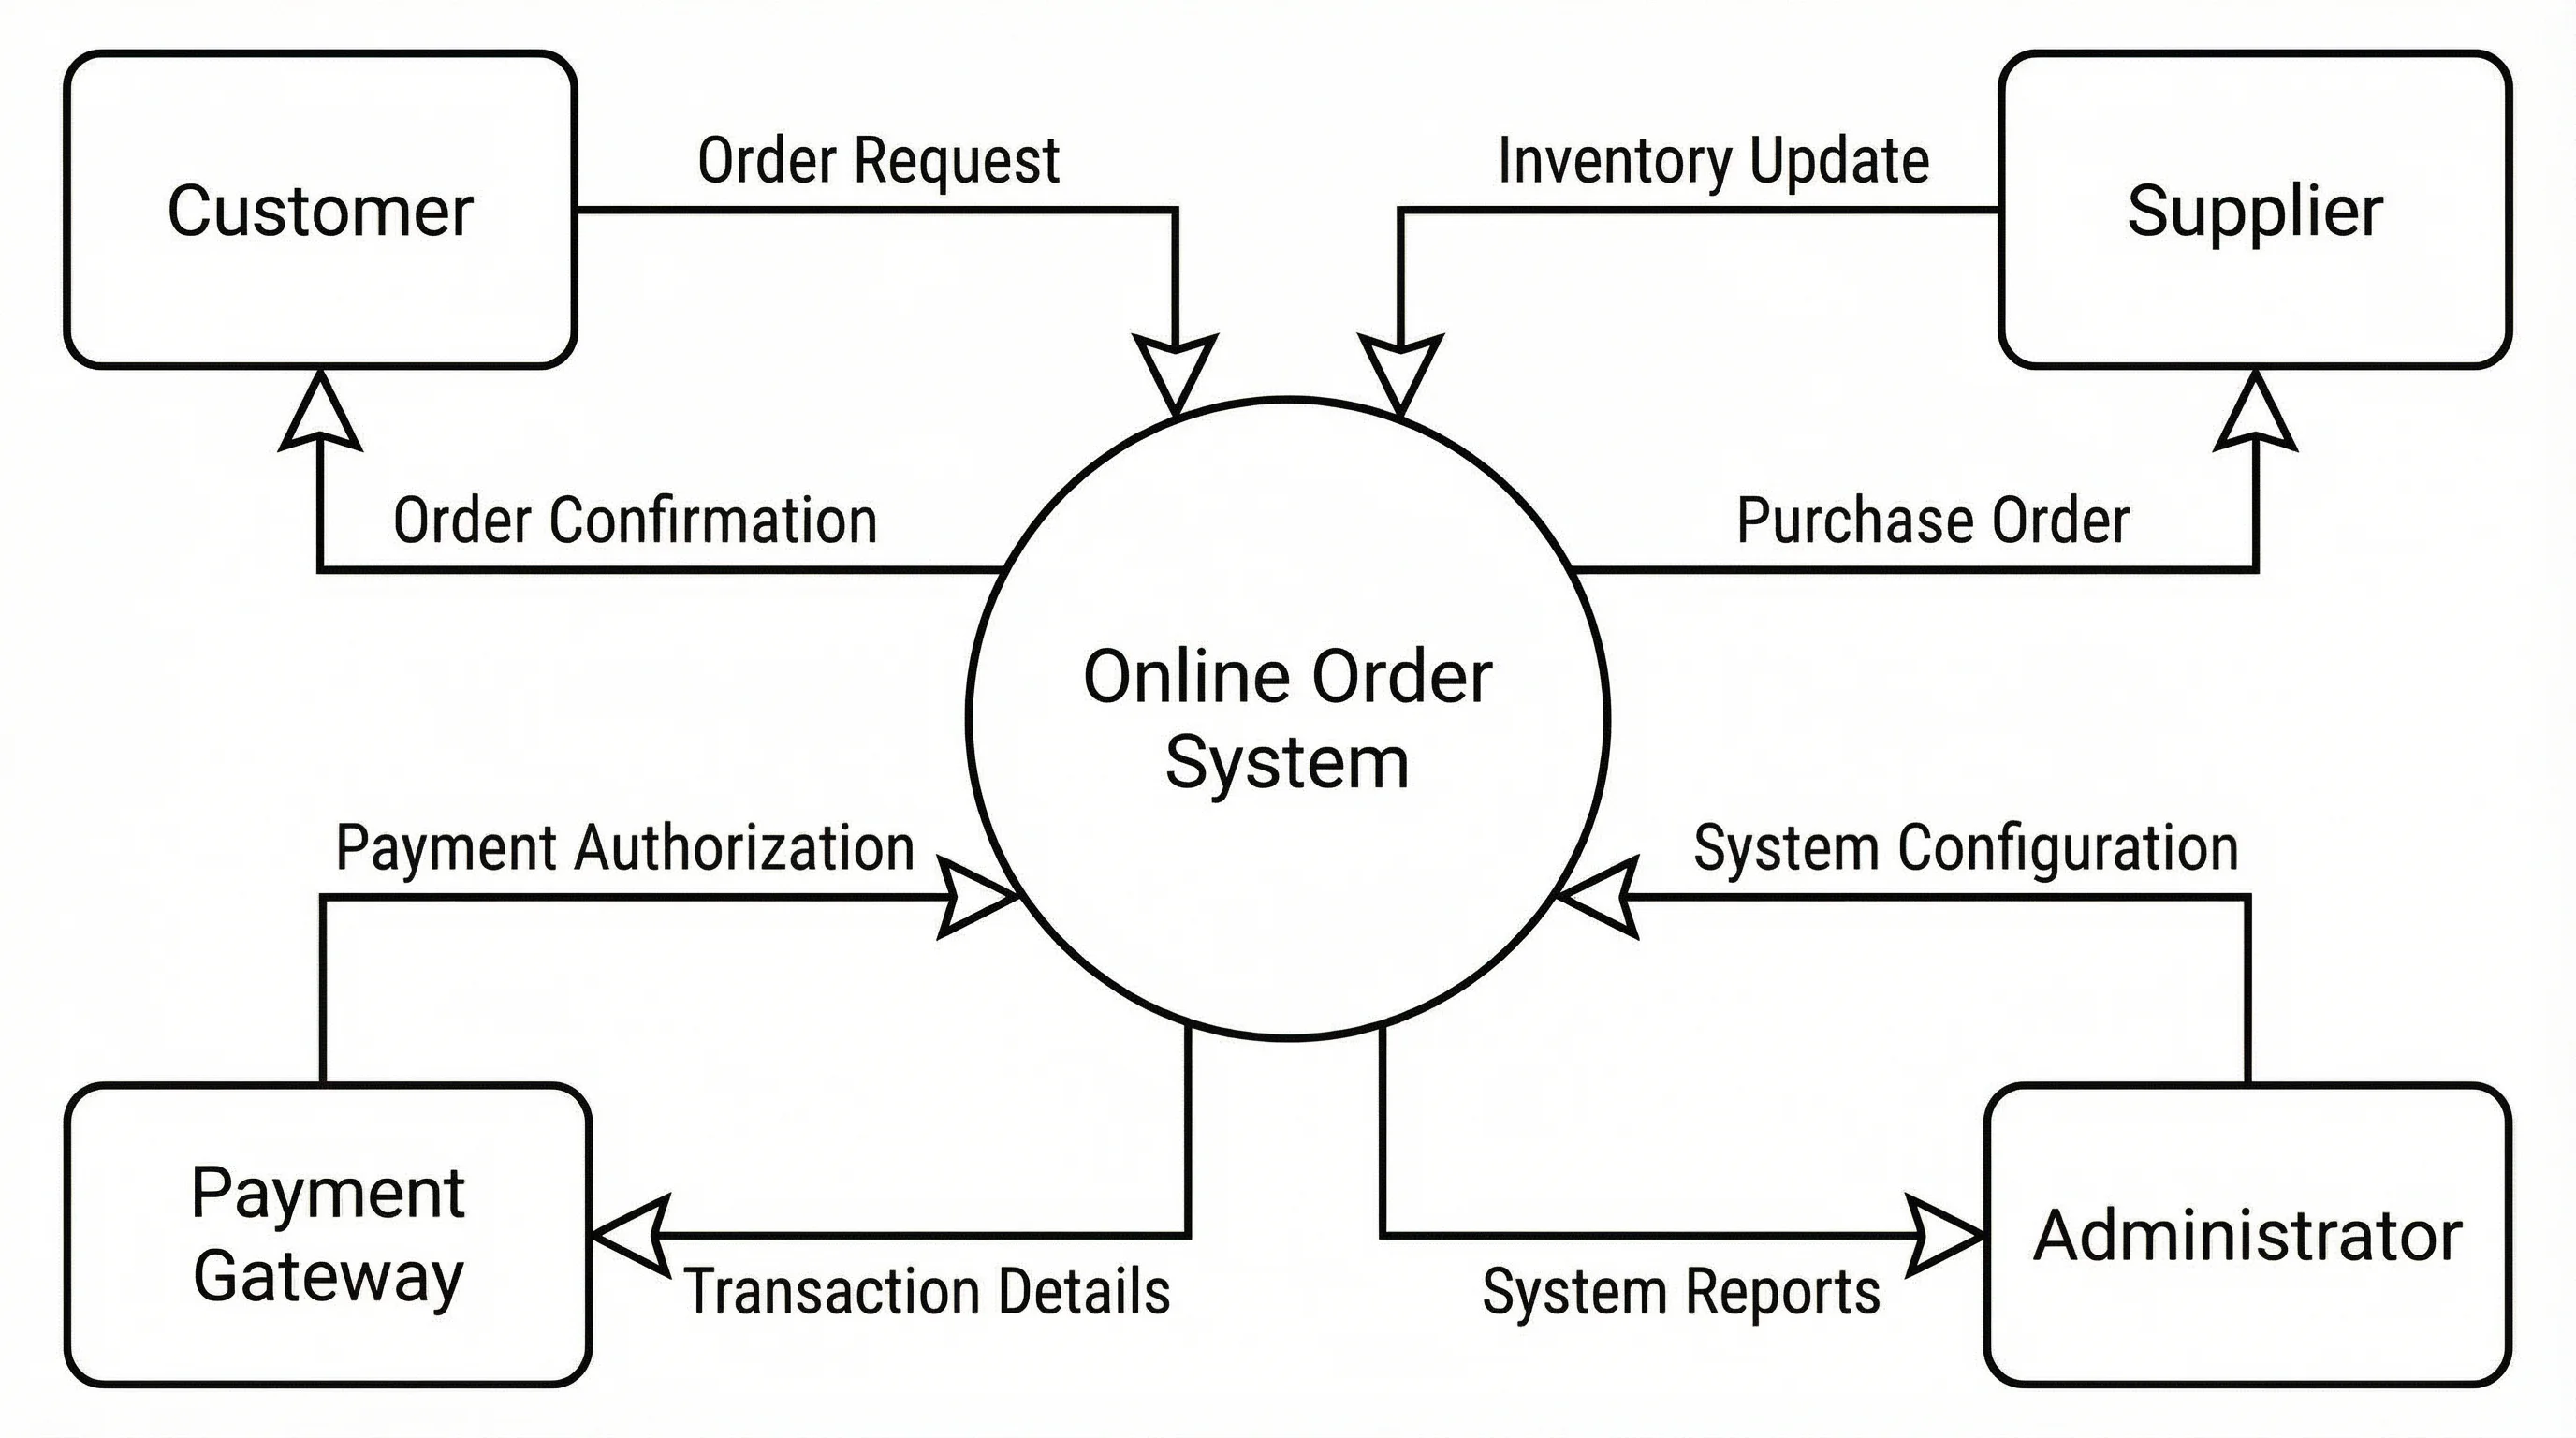
Data Flow Diagram Generator
Create data flow diagrams (DFDs) showing processes, data stores, and flows.