Générateur de Diagramme de Flux de Données Diagrammes de Flux de Données
Décrivez votre système et notre IA créera des diagrammes de flux de données professionnels avec processus, dépôts de données et entités externes. Idéal pour l'analyse système, la conception de bases de données et la documentation logicielle.
Générateur de Diagramme de Flux de Données
By using ConceptViz, you agree not to generate or edit adult, sexual, explicit, unsafe, or policy-violating content. See Content Policy.
Gratuit à essayer ·
Votre diagramme de flux de données apparaîtra ici
Décrivez votre système et cliquez sur Générer
Exemples de Diagrammes de Flux de Données
Parcourez des exemples de DFD ou créez le vôtre ci-dessus
Diagramme de Contexte Niveau 0
Un diagramme de contexte niveau 0 montrant un processus système central entouré d'entités externes (clients, fournisseurs, administrateurs) avec des flux de données étiquetés indiquant les échanges d'informations entre le système et son environnement.
DFD — Système de Commerce en Ligne
Un DFD niveau 1 pour un système de commerce en ligne décomposant le processus principal en traitement des commandes, gestion des paiements, gestion des stocks et exécution des expéditions avec dépôts de données et entités externes.
DFD — Système de Gestion de Bibliothèque
Un DFD niveau 1 pour un système de gestion de bibliothèque avec processus de catalogage des livres, prêts et retours, inscription des membres et calcul des amendes, connectés aux dépôts de données livres, membres et transactions.
DFD — Système d'Inscription Étudiante
Un DFD niveau 1 pour un système d'inscription étudiante avec processus d'inscription, planification des cours, traitement des notes et génération des relevés, reliés aux dépôts étudiants, cours et inscriptions.
DFD — Gestion des Patients en Santé
Un DFD niveau 1 pour un système de gestion des patients en santé avec processus d'enregistrement, planification des rendez-vous, diagnostic et traitement, et facturation, connectés aux dépôts patients, dossiers médicaux et facturation.
DFD — Traitement des Transactions Bancaires
Un DFD niveau 2 décomposant le traitement des transactions bancaires en sous-processus détaillés : validation des transactions, détection des fraudes, autorisation, mise à jour des comptes et règlement, avec dépôts de données et systèmes externes correspondants.
Qu'est-ce qu'un Diagramme de Flux de Données (DFD) ?
Un diagramme de flux de données (DFD) est une représentation graphique montrant comment les données circulent dans un système d'information. Les DFD illustrent les processus qui transforment les données, les dépôts où les informations sont stockées, les entités externes qui interagissent avec le système, et les flux de données qui les relient. Développés à l'origine dans le cadre de l'analyse structurée des systèmes dans les années 1970 par Larry Constantine et Ed Yourdon, les DFD restent l'un des outils les plus utilisés en analyse système et génie logiciel pour comprendre comment un système reçoit, traite, stocke et transmet des informations.
Niveaux de DFD : Contexte, Niveau 1 et Niveau 2
- Niveau 0 (Diagramme de Contexte) : Le plus haut niveau d'abstraction montrant l'ensemble du système comme un seul processus avec les entités externes et leurs flux de données — fournit une vue d'ensemble des frontières et interactions système
- DFD Niveau 1 : Décompose le processus unique du niveau 0 en sous-processus principaux, montrant les dépôts de données et les flux détaillés entre processus, dépôts et entités externes
- DFD Niveau 2 : Décompose davantage les processus individuels de niveau 1 en sous-processus plus détaillés, révélant la logique interne et le traitement des données au sein de chaque fonction principale
- Niveaux Supérieurs (3+) : Continuent à décomposer les processus complexes selon les besoins, bien que la plupart des systèmes soient suffisamment documentés au niveau 2 — les niveaux plus profonds risquent d'ajouter de la complexité sans apporter de clarté supplémentaire
Symboles et Notation Standard des DFD
- Processus (Cercle ou Rectangle Arrondi) : Représente une fonction ou activité qui transforme des données d'entrée en données de sortie — étiqueté avec un groupe verbe-nom comme « Traiter Commande » ou « Valider Paiement »
- Dépôt de Données (Rectangle Ouvert ou Lignes Parallèles) : Représente un référentiel de données au repos, tel qu'une base de données, un fichier ou une table — étiqueté avec un numéro de référence et un nom comme « D1 Dossiers Clients »
- Entité Externe (Carré ou Rectangle) : Représente une source ou destination de données en dehors de la frontière du système — exemples : utilisateurs, autres systèmes ou organisations
- Flux de Données (Flèche) : Représente le mouvement des données entre processus, dépôts et entités — toujours étiqueté avec le nom de la donnée transférée, comme « Détails de Commande » ou « Facture »
Quand Utiliser les Diagrammes de Flux de Données
Les diagrammes de flux de données sont particulièrement précieux lors des phases de collecte des exigences et d'analyse système du développement logiciel, où ils aident analystes et parties prenantes à visualiser comment les informations circulent dans un système proposé ou existant. Les DFD sont essentiels pour la conception de bases de données, car ils révèlent quelles données doivent être stockées et comment elles sont accédées. Ils soutiennent les initiatives d'amélioration des processus en rendant les inefficacités et redondances visibles. Les DFD sont largement utilisés en formation pour enseigner les concepts d'analyse système. Ils sont également précieux pour l'analyse de sécurité, car le suivi des flux de données aide à identifier où les informations sensibles sont exposées et où des contrôles d'accès sont nécessaires.
Questions Fréquentes
Plus d'Outils de Diagramme
 Diagrammes
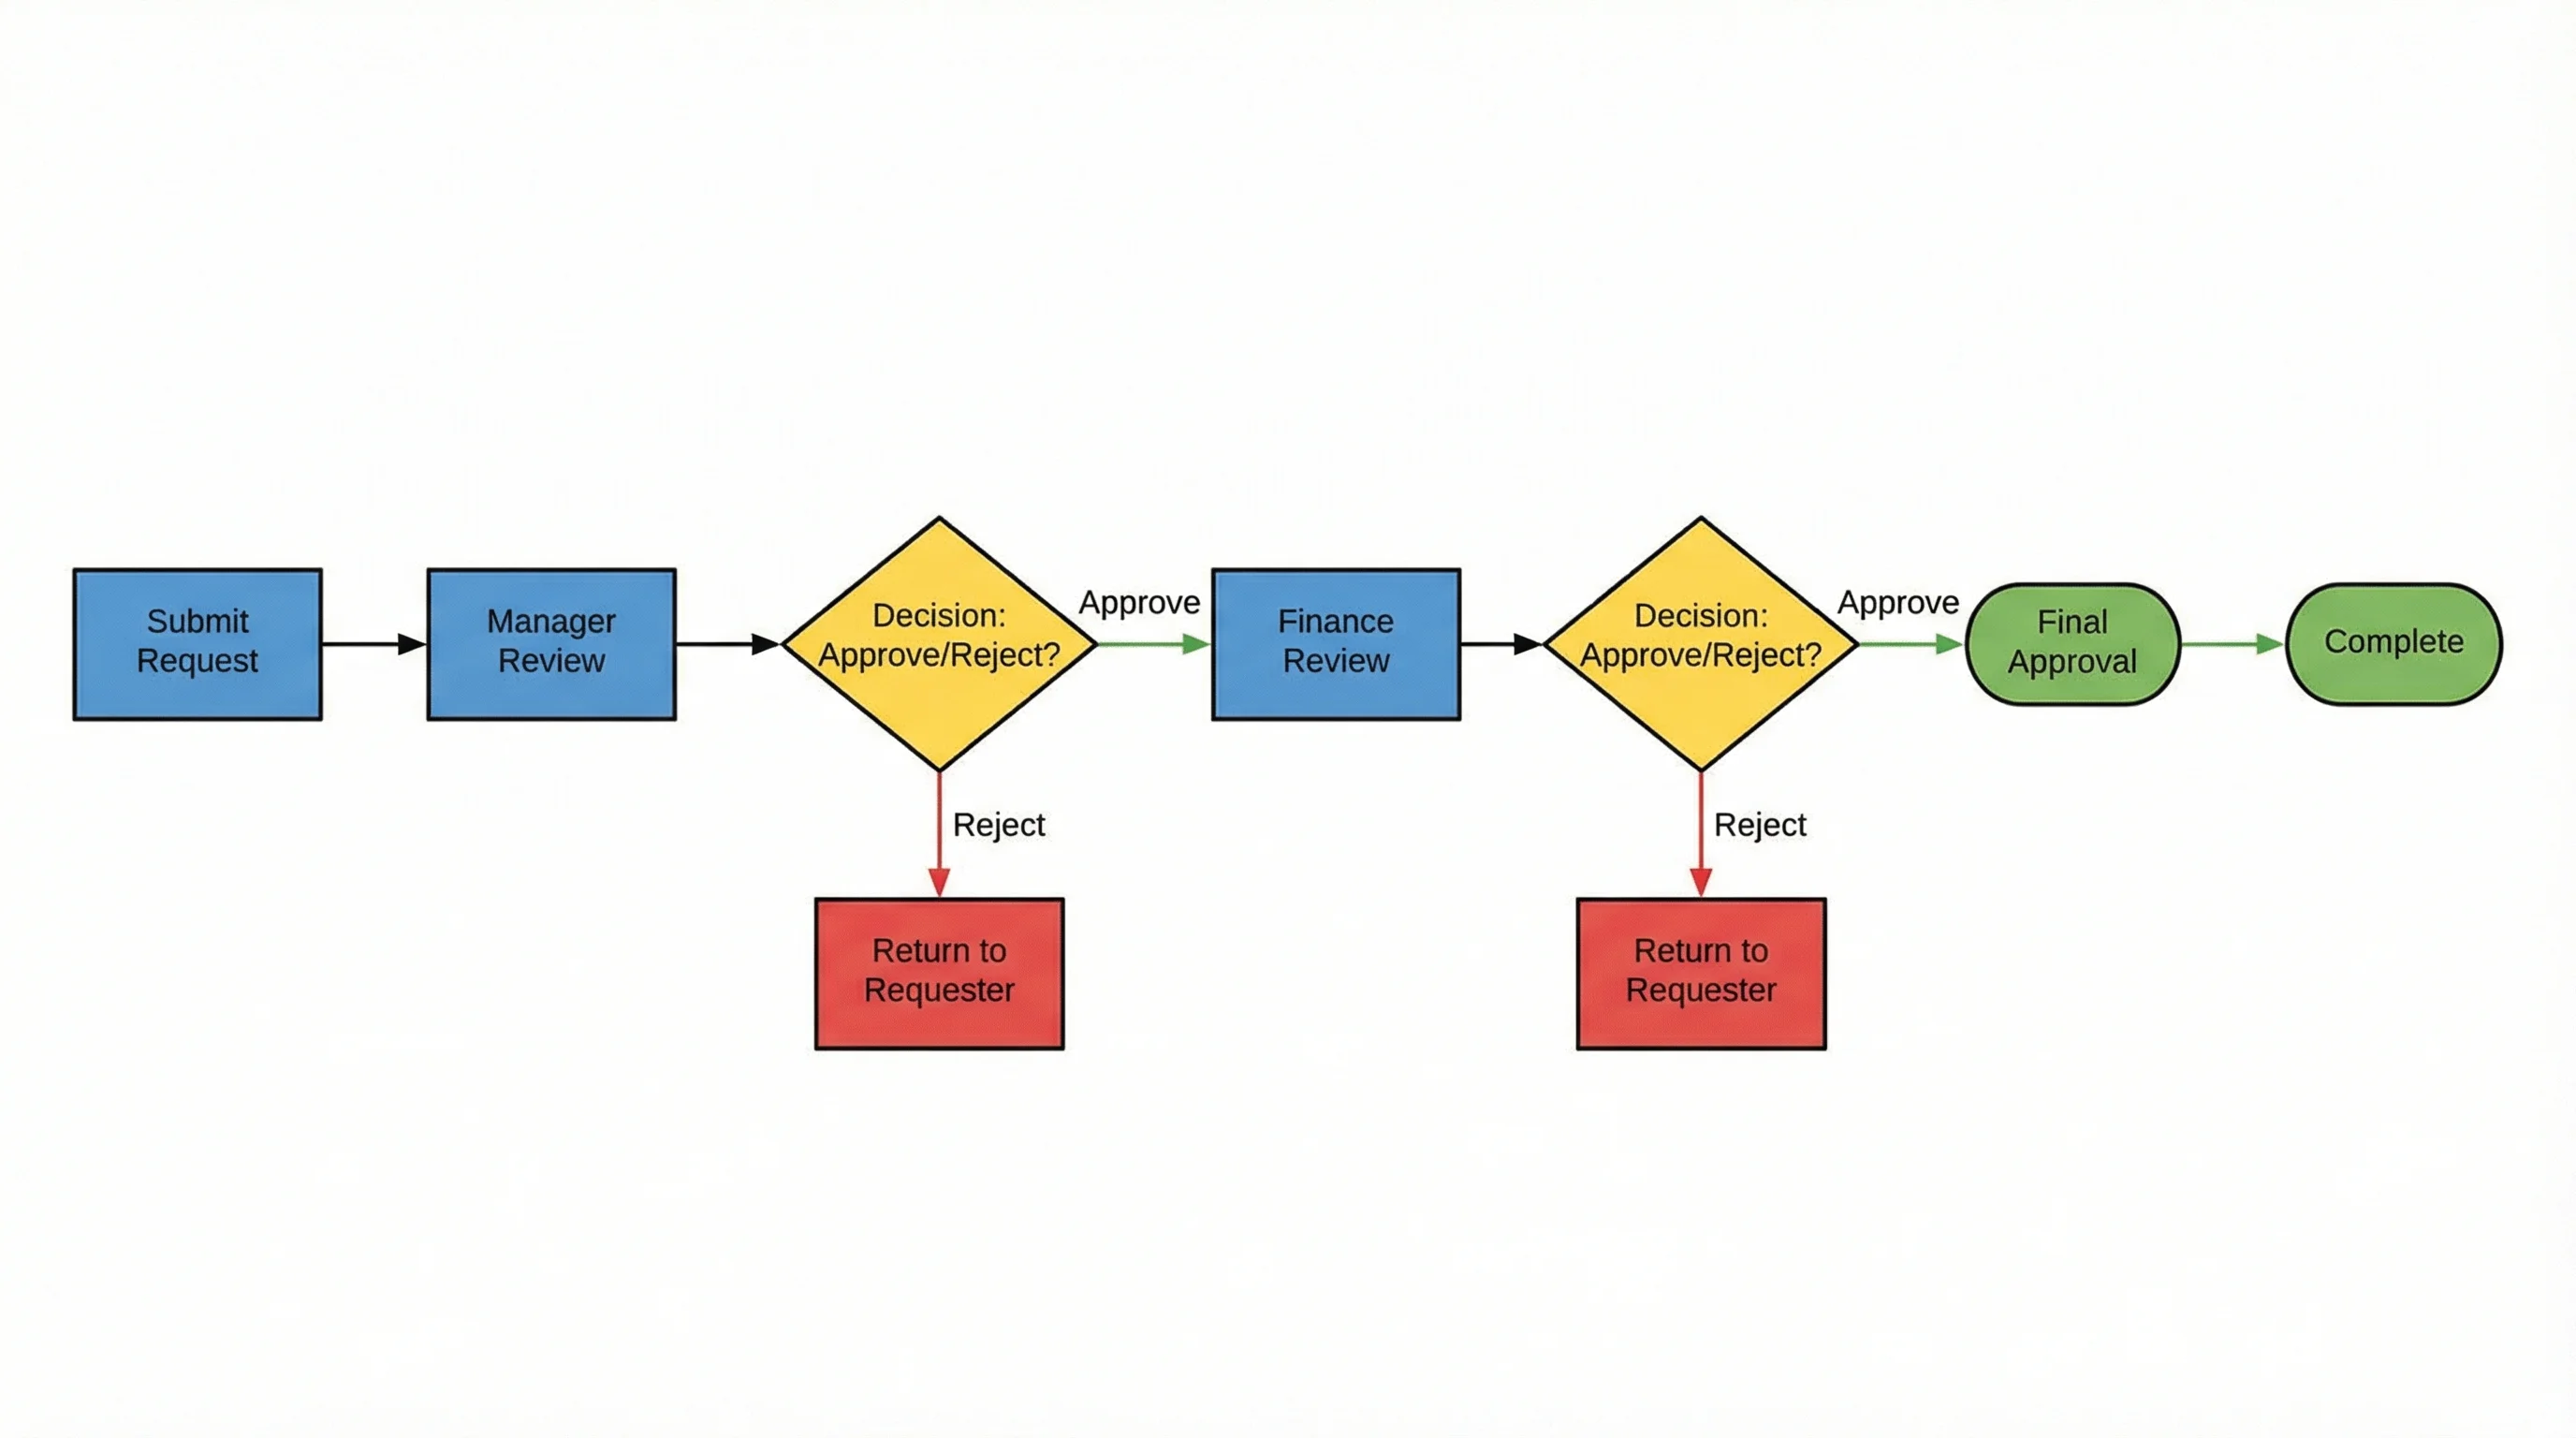
Générateur d'Organigramme IA
Créez des organigrammes professionnels pour les processus métier, flux de travail et arbres de décision avec l'assistance de l'IA.
 Diagrammes
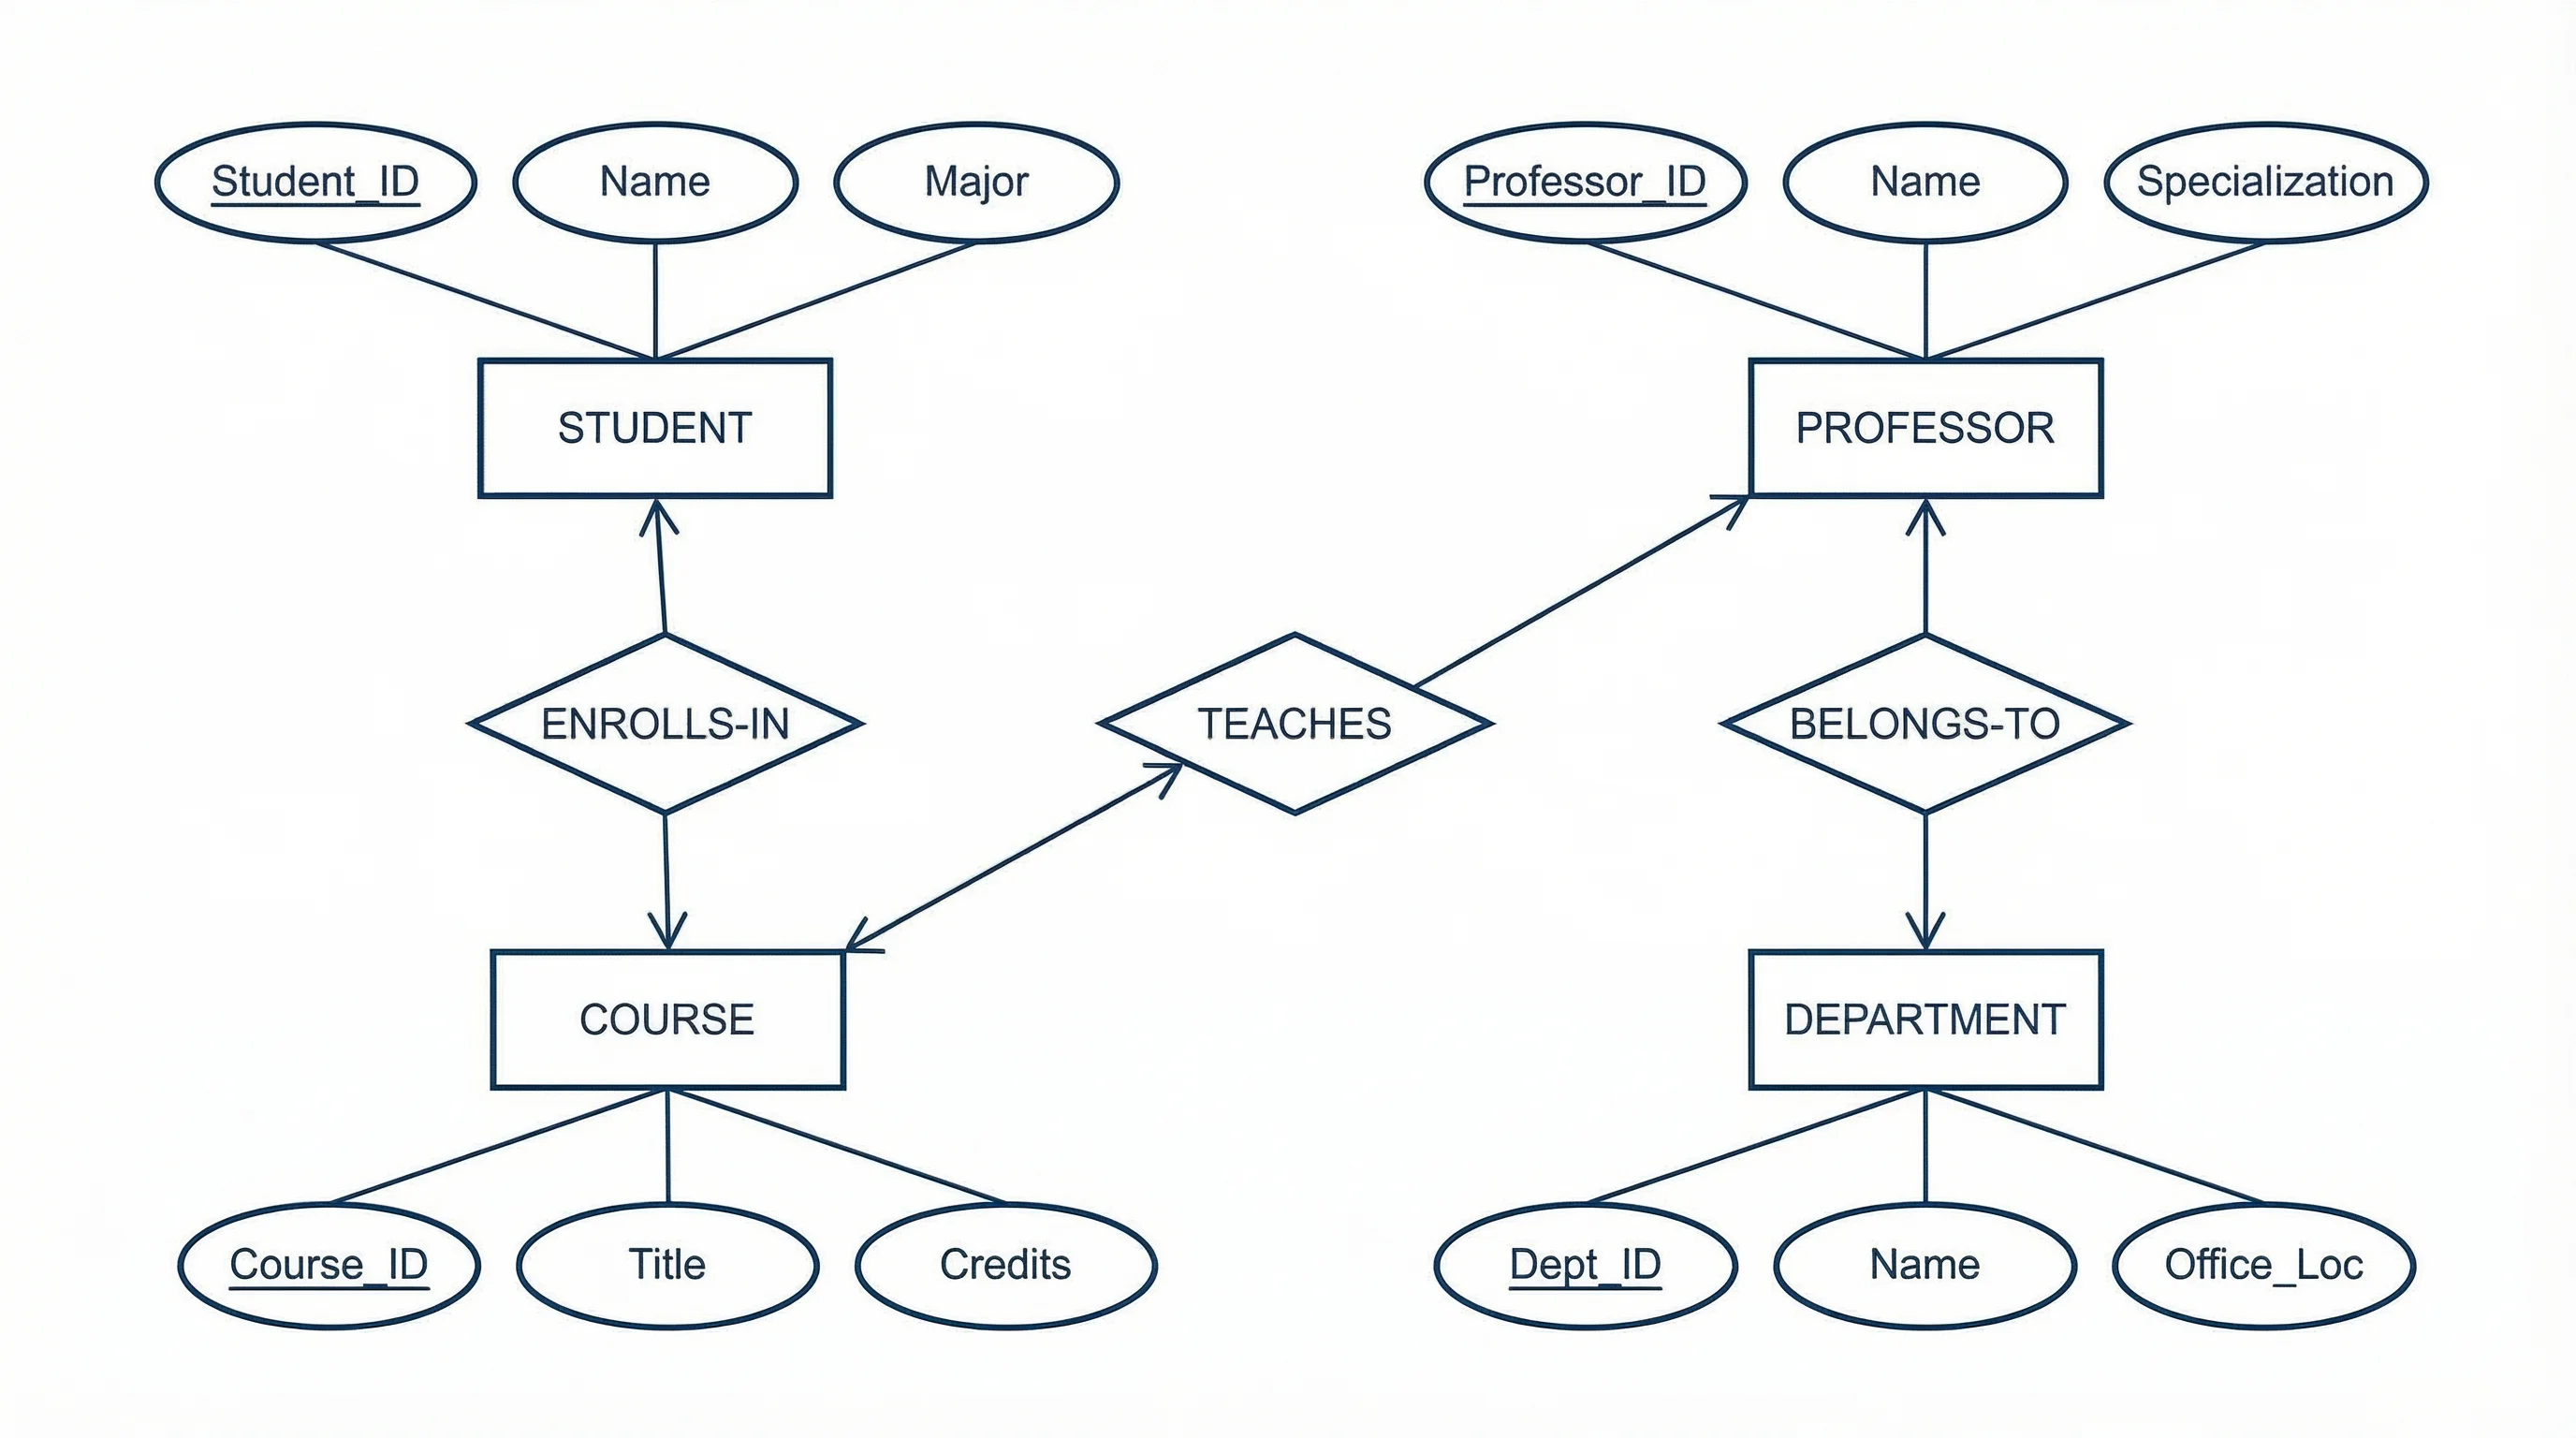
Générateur de Diagramme ER
Générez des diagrammes entité-relation pour la conception de bases de données et la modélisation des données avec visualisation IA.
 Diagrammes
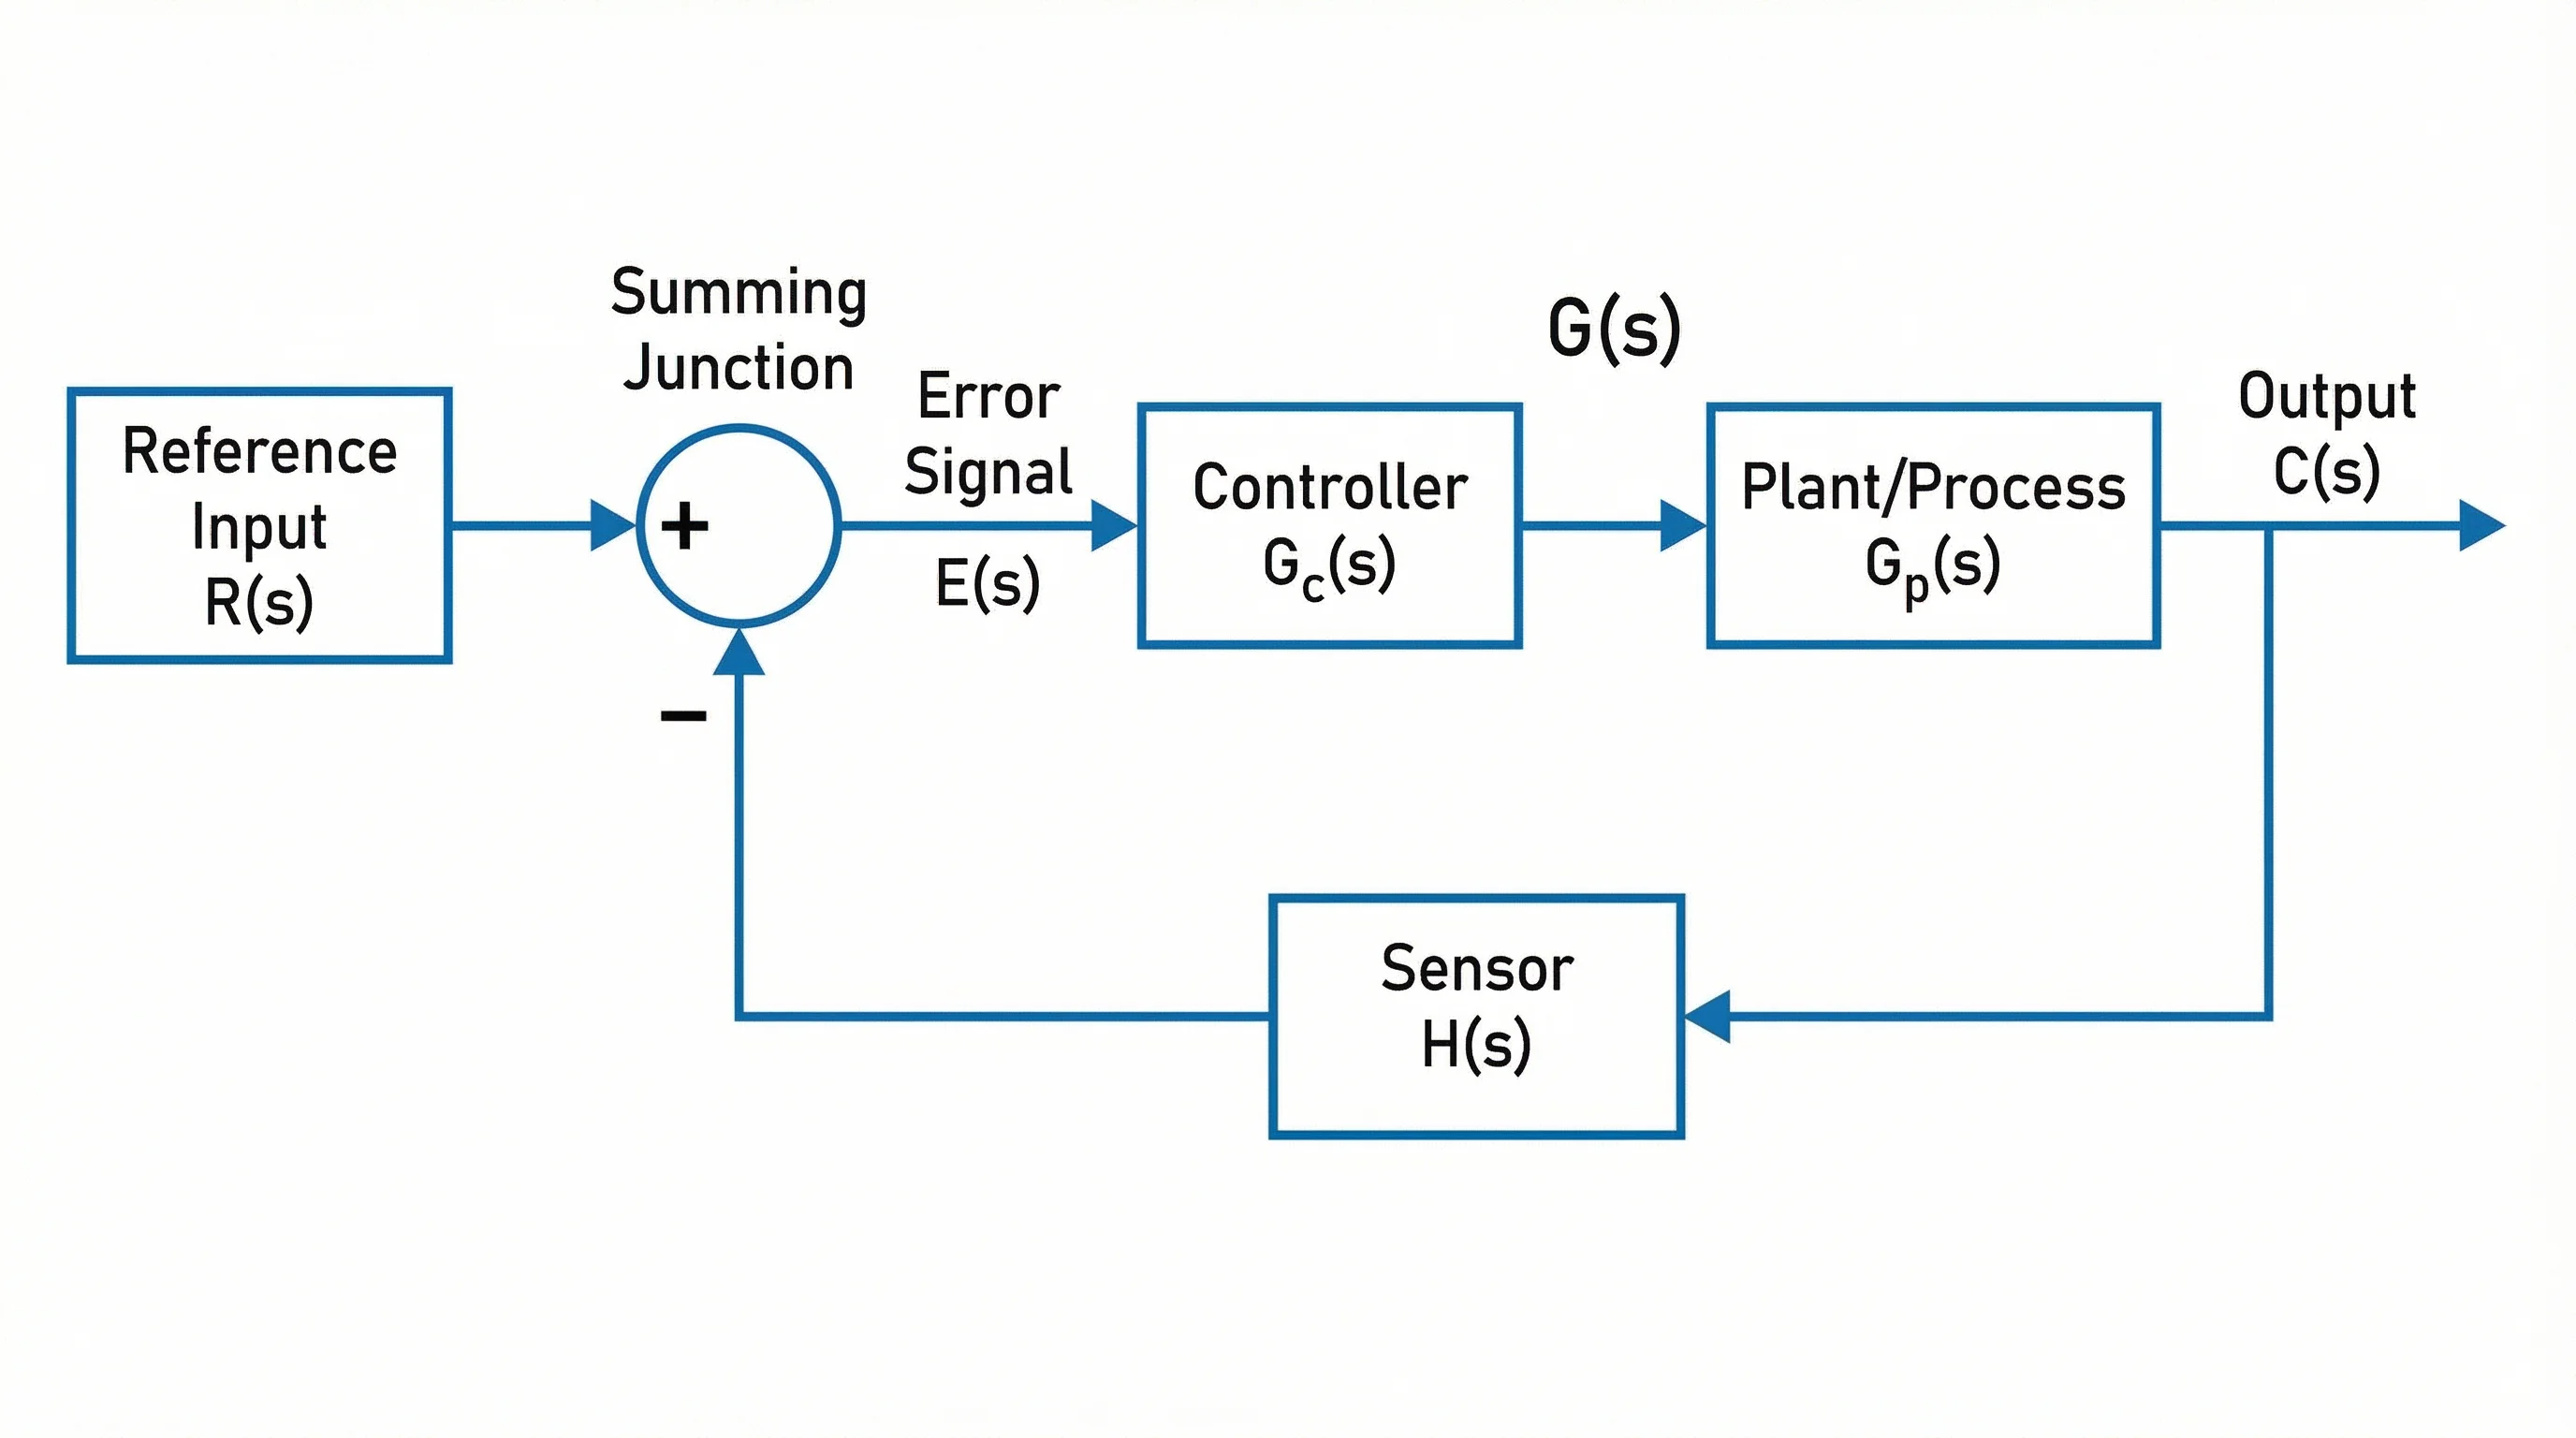
Générateur de Diagramme en Blocs
Créez des diagrammes en blocs pour les vues d'ensemble système, le traitement du signal et la documentation technique.