")
How to Create a Data Flow Diagram: DFD Levels, Symbols & Examples (2026)
Step-by-step guide to creating data flow diagrams (DFDs). Learn Level 0, 1 & 2 DFDs with real examples, standard symbols, and common mistakes to avoid.
Data flow diagrams (DFDs) are one of the most effective ways to visualize how information moves through a system. Unlike flowcharts that focus on control logic and decision branching, DFDs strip away implementation details and concentrate on a single question: where does data come from, where does it go, and what happens to it along the way? Whether you are a systems analyst documenting business requirements, a software engineer designing a new module, or a student learning structured analysis, understanding DFDs gives you a powerful tool for turning complex systems into clear, readable pictures.
This guide walks you through everything you need to create data flow diagrams from scratch--core symbols, notation standards, DFD levels, step-by-step instructions, real-world examples, and the most common mistakes people make.
Data Flow Diagram Generator
Create professional data flow diagrams instantly with AI. Just describe your system and get a publication-ready DFD.
Try it free →What Is a Data Flow Diagram?
A data flow diagram (DFD) is a graphical representation of how data flows through a system. It shows the sources and destinations of data, the processes that transform it, and the stores where it is held. DFDs were introduced in the late 1970s as part of the structured analysis movement and remain widely used in systems engineering, business analysis, and software design.
A Brief History: Two Notation Standards
Two notation systems dominate the DFD world:
-
Yourdon-DeMarco notation (1978) -- Created by Edward Yourdon and Tom DeMarco. This notation uses circles for processes, parallel lines for data stores, and rectangles for external entities. It is the more common notation in academic textbooks and university courses.
-
Gane-Sarson notation (1979) -- Developed by Chris Gane and Trish Sarson. This notation uses rounded rectangles (with a horizontal line separating the process ID from the process name) for processes, open-ended rectangles for data stores, and squares for external entities. It is popular in business and industry settings.
Both notations convey the same information. The choice between them usually depends on your organization's standards or your instructor's preference. The concepts, rules, and decomposition levels are identical regardless of which notation you use.
Why DFDs Still Matter
| Benefit | Description |
|---|---|
| Requirement clarity | Forces you to identify every data input, output, and transformation before writing code |
| Stakeholder communication | Non-technical stakeholders can understand DFDs without learning programming |
| System boundary definition | Clearly separates what is inside the system from what is outside |
| Top-down decomposition | Allows progressive refinement from a high-level overview to detailed sub-processes |
| Documentation | Serves as a living reference for system maintenance and future enhancements |
DFD Symbols and Notation
Every data flow diagram uses exactly four types of symbols. Understanding these is the foundation of reading and creating DFDs.
1. External Entity (Source / Sink)
An external entity is any person, organization, or system that exists outside the system boundary but interacts with it by sending or receiving data.
| Notation | Symbol |
|---|---|
| Yourdon-DeMarco | Rectangle (square box) |
| Gane-Sarson | Square with a shadow or bold border |
Examples: Customer, Bank, Email Server, Government Agency, Supplier
External entities are sometimes called terminators because they represent the endpoints of data flows--places where data originates or ultimately ends up.
2. Process
A process transforms incoming data into outgoing data. Every process must have at least one data flow in and one data flow out. Processes are typically labeled with a verb phrase (e.g., "Validate Order," "Calculate Tax," "Generate Report").
| Notation | Symbol |
|---|---|
| Yourdon-DeMarco | Circle (also called a "bubble") |
| Gane-Sarson | Rounded rectangle divided by a horizontal line (top section holds the process ID, bottom section holds the process name) |
Naming rule: Always use a verb-noun format. Write "Process Payment," not just "Payment."
3. Data Store
A data store is a repository where data is held for later use. It could be a database table, a flat file, a spreadsheet, or even a physical filing cabinet. Data stores are passive--they do not transform data, they only hold it.
| Notation | Symbol |
|---|---|
| Yourdon-DeMarco | Two parallel horizontal lines with the store name between them |
| Gane-Sarson | Open-ended rectangle (right side is open) with an ID section on the left |
Examples: D1 - Customer Database, D2 - Order Records, D3 - Inventory File
4. Data Flow
A data flow is a pipeline through which data travels. It is represented by an arrow in both notations. The arrow's label describes the data being carried (e.g., "Order Details," "Payment Confirmation," "Student Transcript").
Rules for data flows:
- Every flow must be labeled--unnamed arrows are not allowed
- A flow connects two different symbols (you cannot connect a data store directly to another data store without a process in between)
- Data flows are unidirectional--if data moves in both directions between two symbols, draw two separate arrows
DFD Levels Explained
One of the most powerful features of data flow diagrams is leveled decomposition. You start with a single, high-level view and progressively break it down into more detailed diagrams. Each level adds specificity without changing the overall data balance.
Level 0: Context Diagram
The context diagram is the highest level of abstraction. It shows the entire system as a single process surrounded by all external entities that interact with it.
Key characteristics:
- Contains exactly one process (representing the whole system)
- Shows all external entities
- Shows all major data flows between the system and its external entities
- Contains no data stores
A Level 0 context diagram provides the big-picture view of how external actors interact with the system
When to use it: Start every DFD project with a context diagram. It establishes the system boundary and ensures all stakeholders agree on what is inside and outside the system.
Level 1: System Diagram
The Level 1 DFD "explodes" the single process from the context diagram into its major sub-processes. This is where you begin to see the internal workings of the system.
Key characteristics:
- Breaks the single Level 0 process into 3-9 major sub-processes
- Introduces data stores
- All external entities from Level 0 must appear again
- All data flows entering or leaving the system in Level 0 must be accounted for (this is called balancing)
Example: For an online shopping system, the Level 1 DFD might contain processes such as "Manage Catalog," "Process Order," "Handle Payment," and "Ship Order"--each connected by data flows and interacting with data stores like "Product Database" and "Order Records."
Level 2: Detailed Diagram
A Level 2 DFD further decomposes one or more Level 1 processes into finer sub-processes. Not every Level 1 process needs a Level 2 diagram--only the ones that are complex enough to warrant further detail.
Key characteristics:
- Decomposes a single Level 1 process into its sub-steps
- Must remain balanced with the parent process (same inputs and outputs)
- May introduce additional data stores
- Typically the lowest level needed for most systems
Example: The "Process Order" process from Level 1 might decompose into "Validate Order," "Check Inventory," "Calculate Total," and "Confirm Order" at Level 2.
How deep should you go? Most practitioners stop at Level 2 or Level 3. If a process can be described in a single paragraph of plain language, it probably does not need further decomposition. The goal is clarity, not exhaustive detail.
How to Create a Data Flow Diagram: Step-by-Step
Follow these six steps to build a DFD from scratch for any system.
Step 1: Identify the System and Its Purpose
Start by writing a one-sentence description of what the system does. This sentence should name the system and describe its primary function.
Example: "The Student Registration System allows students to browse courses, register for classes, and receive enrollment confirmations."
This sentence immediately tells you who the users are (students), what the system does (registration), and what outputs to expect (enrollment confirmations).
Step 2: Define the System Boundary and External Entities
List every person, organization, or external system that sends data to or receives data from your system. These become your external entities.
Ask these questions:
- Who provides input data to the system?
- Who receives output from the system?
- Are there any external systems that exchange data with this system?
For the Student Registration System: Student, Instructor, Registrar's Office, Billing System.
Step 3: Create the Level 0 Context Diagram
Draw the entire system as a single process in the center. Place all external entities around it. Draw labeled arrows showing the major data flows.
Checklist:
- One process bubble representing the entire system
- All external entities identified in Step 2
- Every data flow labeled with the name of the data it carries
- No data stores at this level
Step 4: Decompose into Level 1
Break the single system process into its major functional areas. Each becomes a separate process in your Level 1 diagram.
For the Student Registration System:
- Browse Course Catalog
- Register for Courses
- Manage Waitlists
- Generate Enrollment Records
- Process Tuition Charges
Add data stores to represent persistent data: D1 - Course Catalog, D2 - Student Records, D3 - Enrollment Database.
Connect everything with labeled data flows. Verify balancing: every data flow that crossed the system boundary in Level 0 must appear in Level 1.
Step 5: Add Detail with Level 2 (If Needed)
Select any Level 1 process that is too complex to understand at a glance and decompose it further. The "Register for Courses" process, for example, might break into:
- 2.1 Verify Prerequisites
- 2.2 Check Seat Availability
- 2.3 Enroll Student
- 2.4 Send Confirmation
Step 6: Validate and Review
Walk through the completed DFD with these validation checks:
- Balancing: Do the data flows at each level match the parent level?
- No black holes: Does every process have at least one output? (A process that consumes data but produces nothing is a black hole.)
- No miracles: Does every process have at least one input? (A process that produces data from nothing is a miracle.)
- Naming: Are all processes labeled with verb-noun phrases? Are all data flows labeled?
- Data store access: Is every data store connected to at least one process via a read or write flow?
- No direct entity-to-entity flows: External entities should never exchange data directly on a DFD--all data must pass through a process.
Data Flow Diagram Examples
Example 1: E-Commerce Order Processing System
Context: An online store where customers browse products, place orders, make payments, and receive shipments.
External Entities: Customer, Payment Gateway, Shipping Carrier, Warehouse
Level 1 Processes:
- Browse Products -- Customer sends search queries, system returns product listings from the Product Catalog (D1)
- Place Order -- Customer submits order details, system validates against Inventory (D2) and creates an Order Record (D3)
- Process Payment -- Order total is sent to Payment Gateway, confirmation is stored in Payment Records (D4)
- Fulfill Order -- Shipping instructions are sent to Warehouse and Shipping Carrier, tracking info flows back to Customer
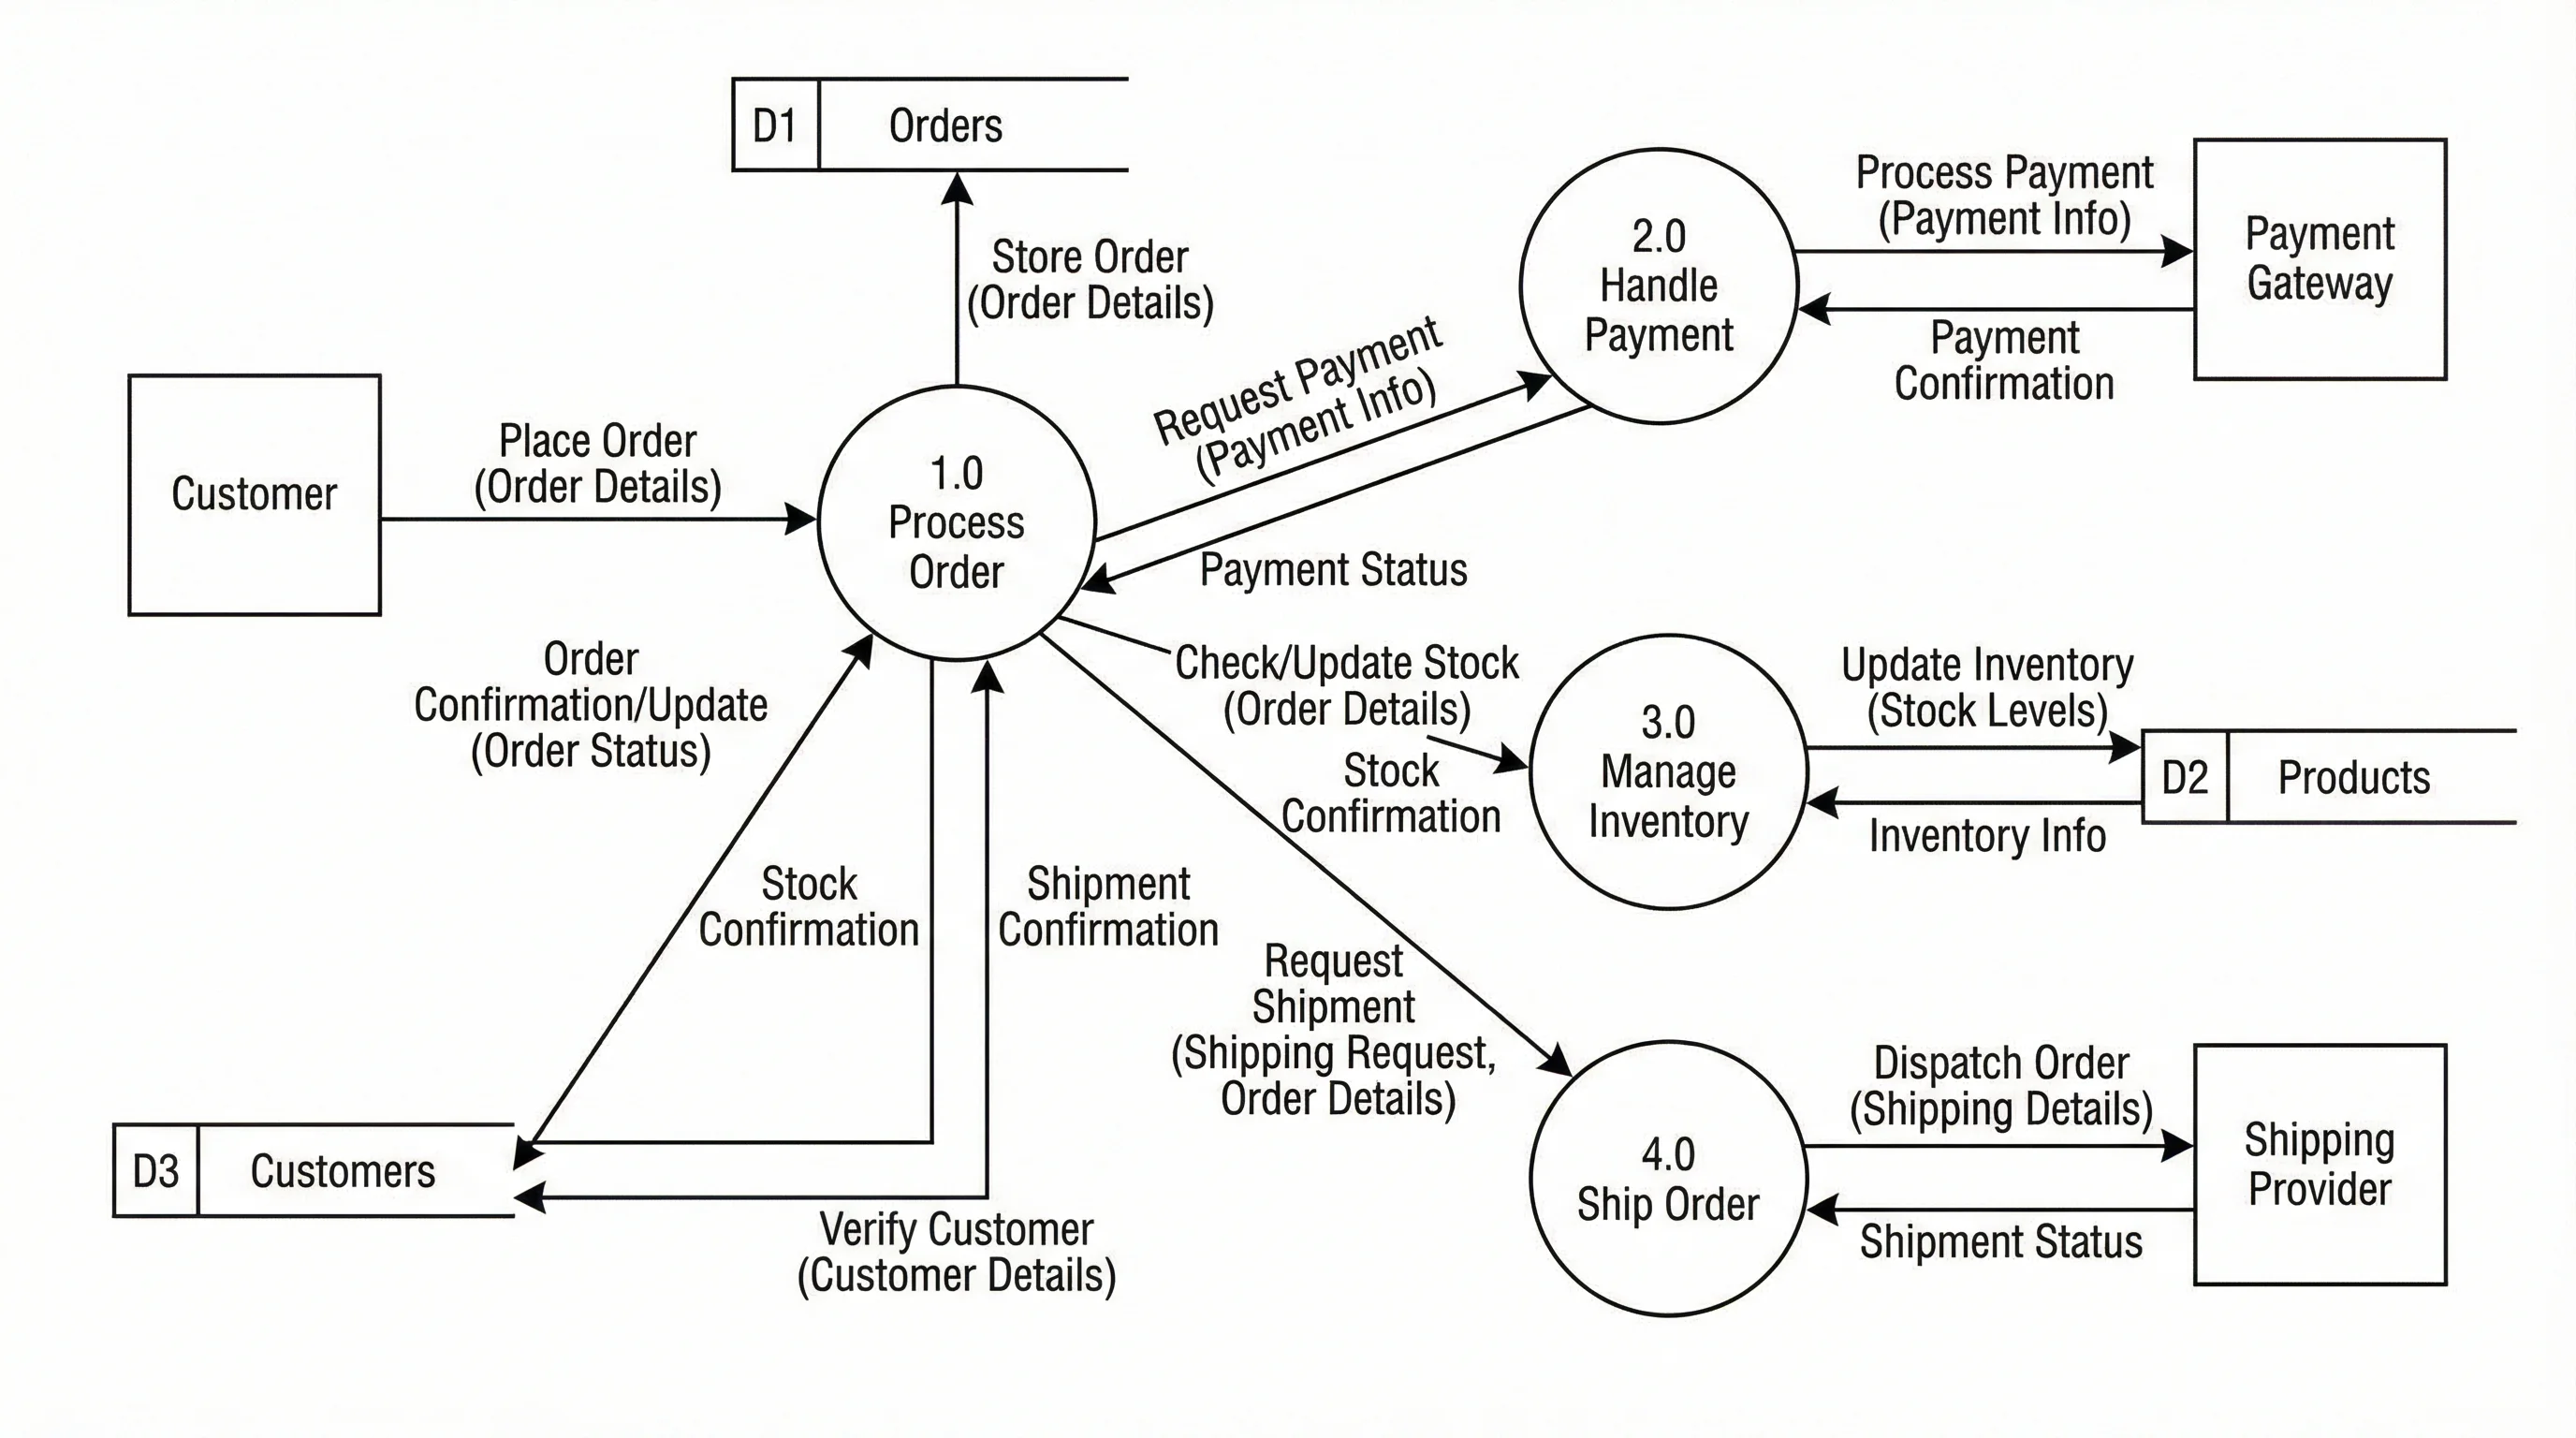
A data flow diagram for an e-commerce system showing how customer orders flow through processing, payment, and fulfillment
Example 2: Student Registration System
Context: A university system that manages course enrollment.
External Entities: Student, Instructor, Registrar, Billing System
Level 1 Processes:
- Manage Course Catalog -- Instructors submit course info, Registrar approves, data stored in Course Database (D1)
- Process Registration -- Student selects courses, system checks prerequisites against Student Records (D2), enrolls student in Enrollment Database (D3)
- Handle Waitlist -- If a course is full, student is added to Waitlist (D4); when a seat opens, next student is auto-enrolled
- Generate Billing -- Enrollment triggers tuition calculation, charges sent to Billing System
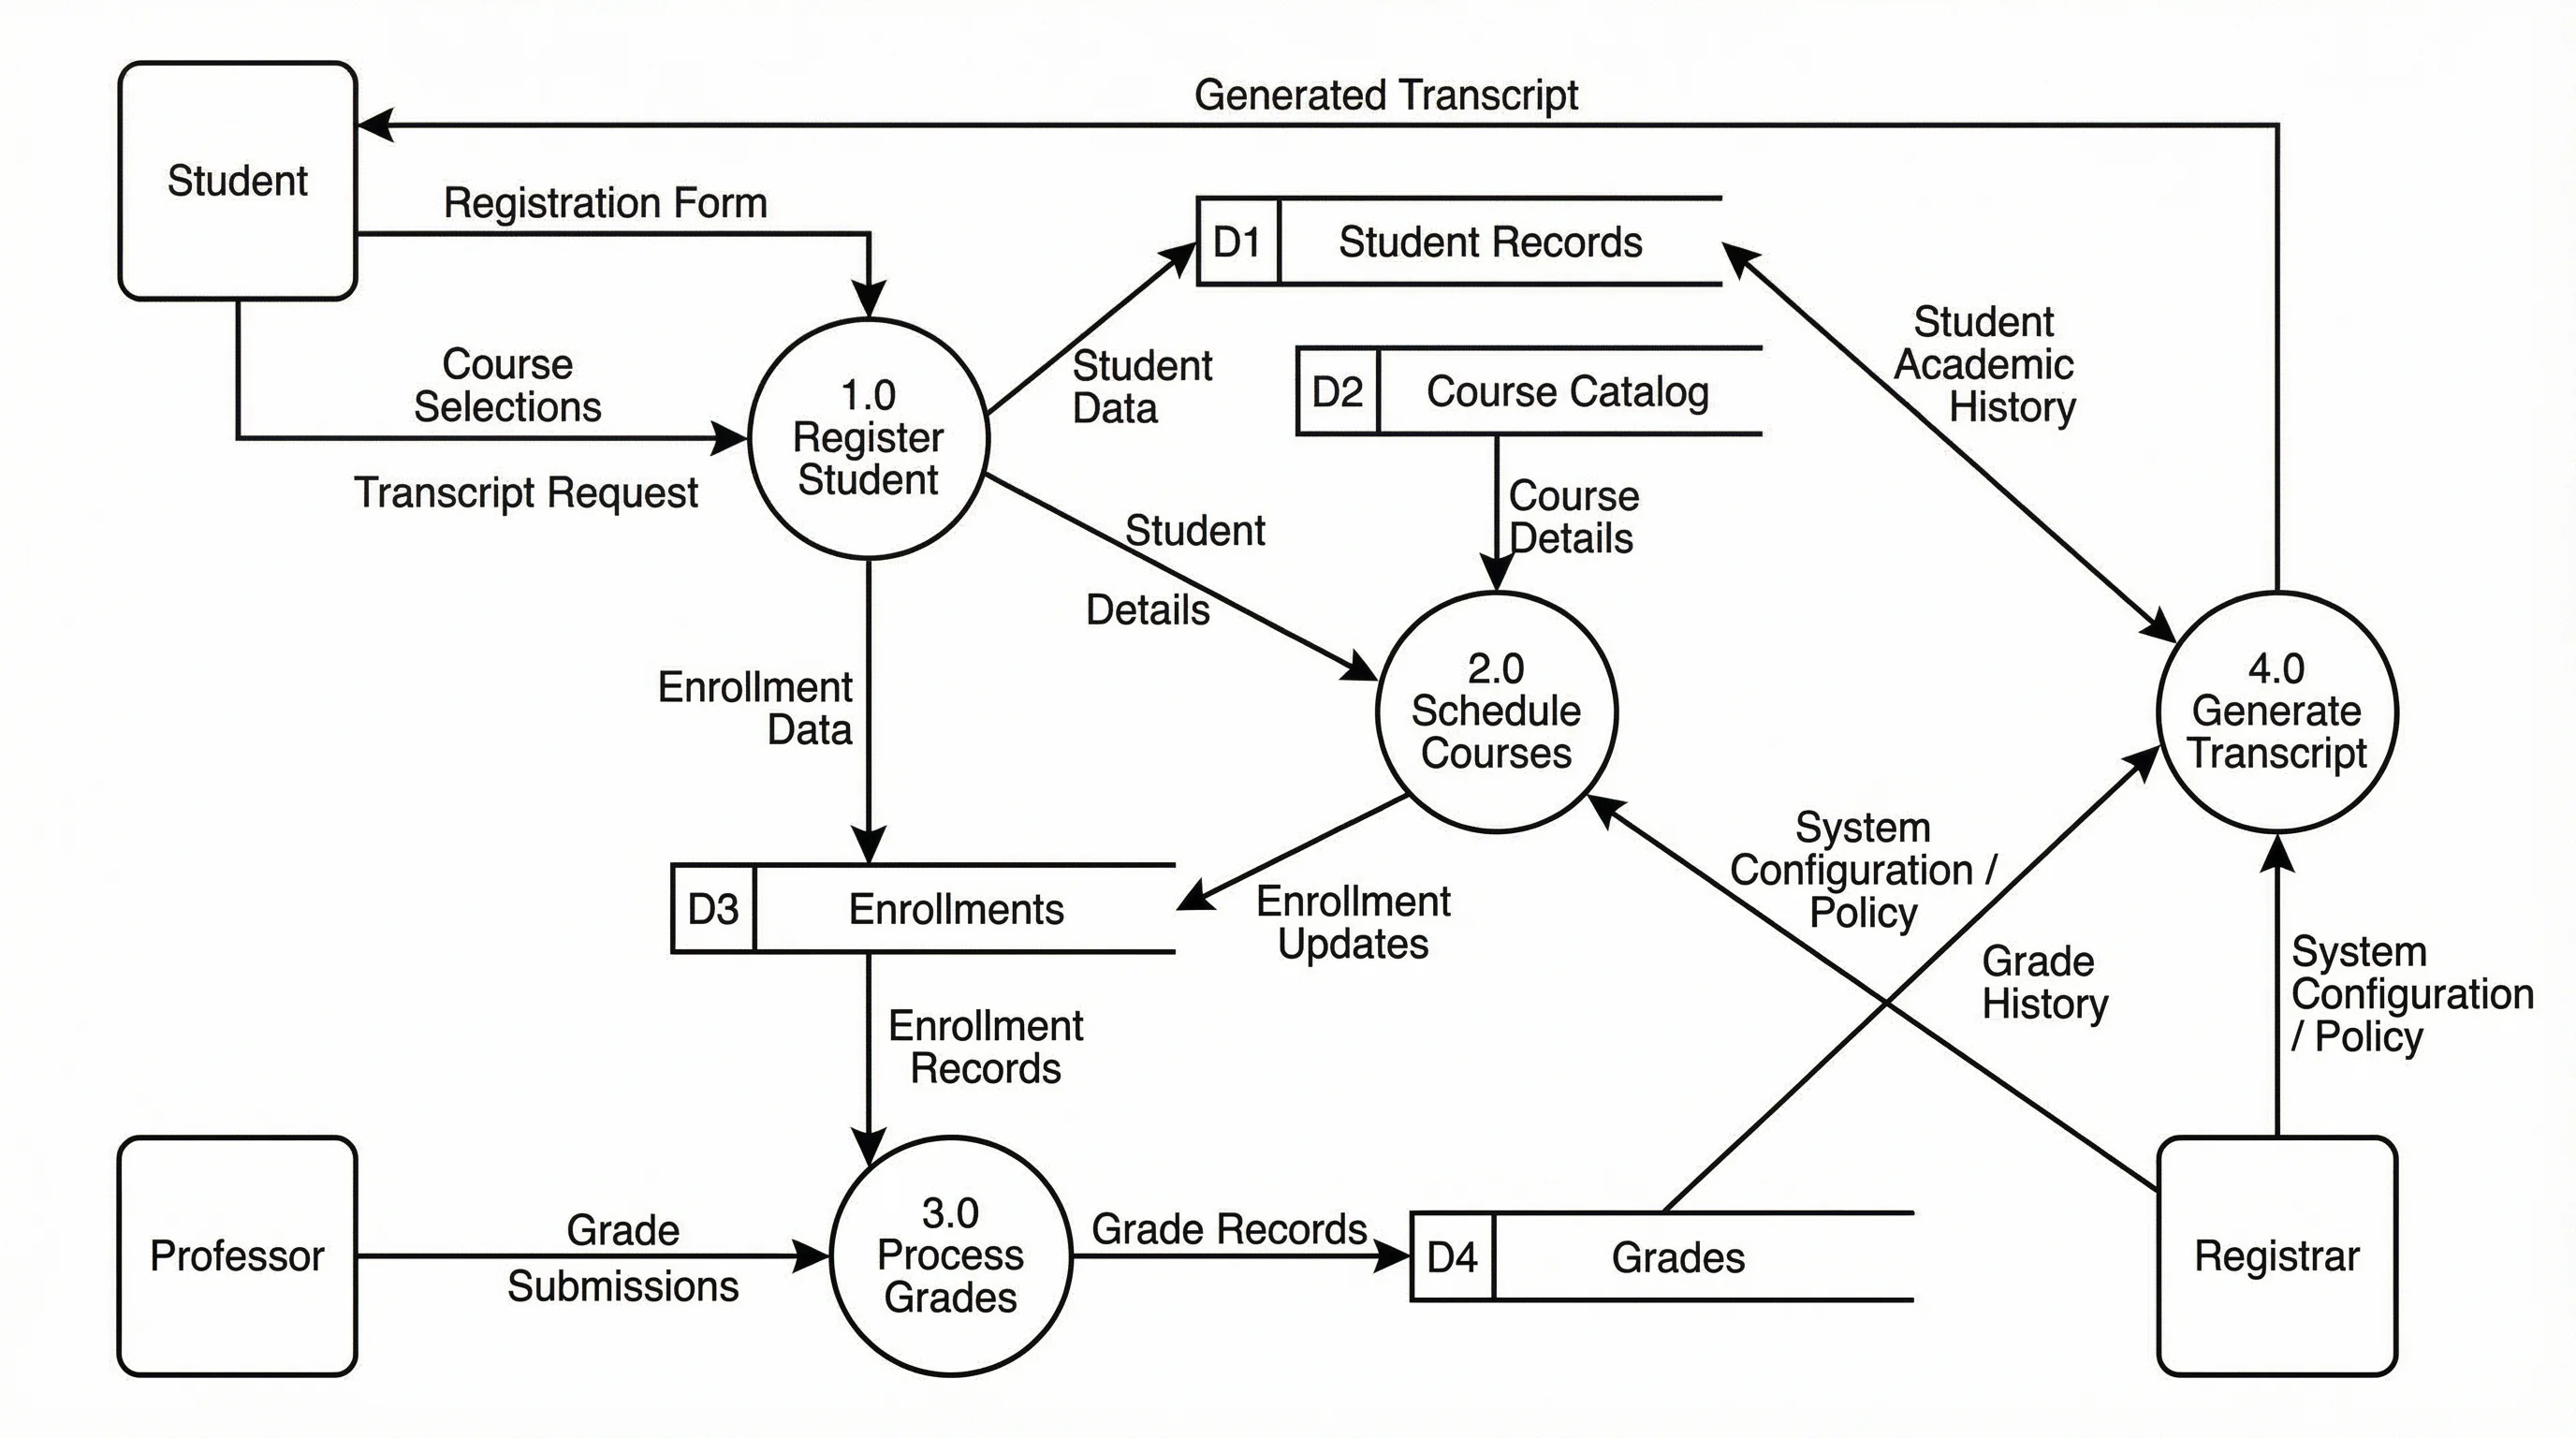
A Level 1 DFD for a student registration system showing data flows between students, courses, and billing
Example 3: Library Management System
Context: A public library system managing book loans, returns, and member accounts.
External Entities: Library Member, Librarian, Book Supplier
Level 1 Processes:
- Manage Membership -- New members register, system stores info in Member Database (D1)
- Search Catalog -- Members search for books, system queries Book Catalog (D2)
- Process Loan -- Member borrows a book, system checks availability, updates Loan Records (D3)
- Process Return -- Member returns a book, system updates Loan Records (D3), calculates any late fees
- Manage Inventory -- Librarian adds new books from Book Supplier, updates Book Catalog (D2)
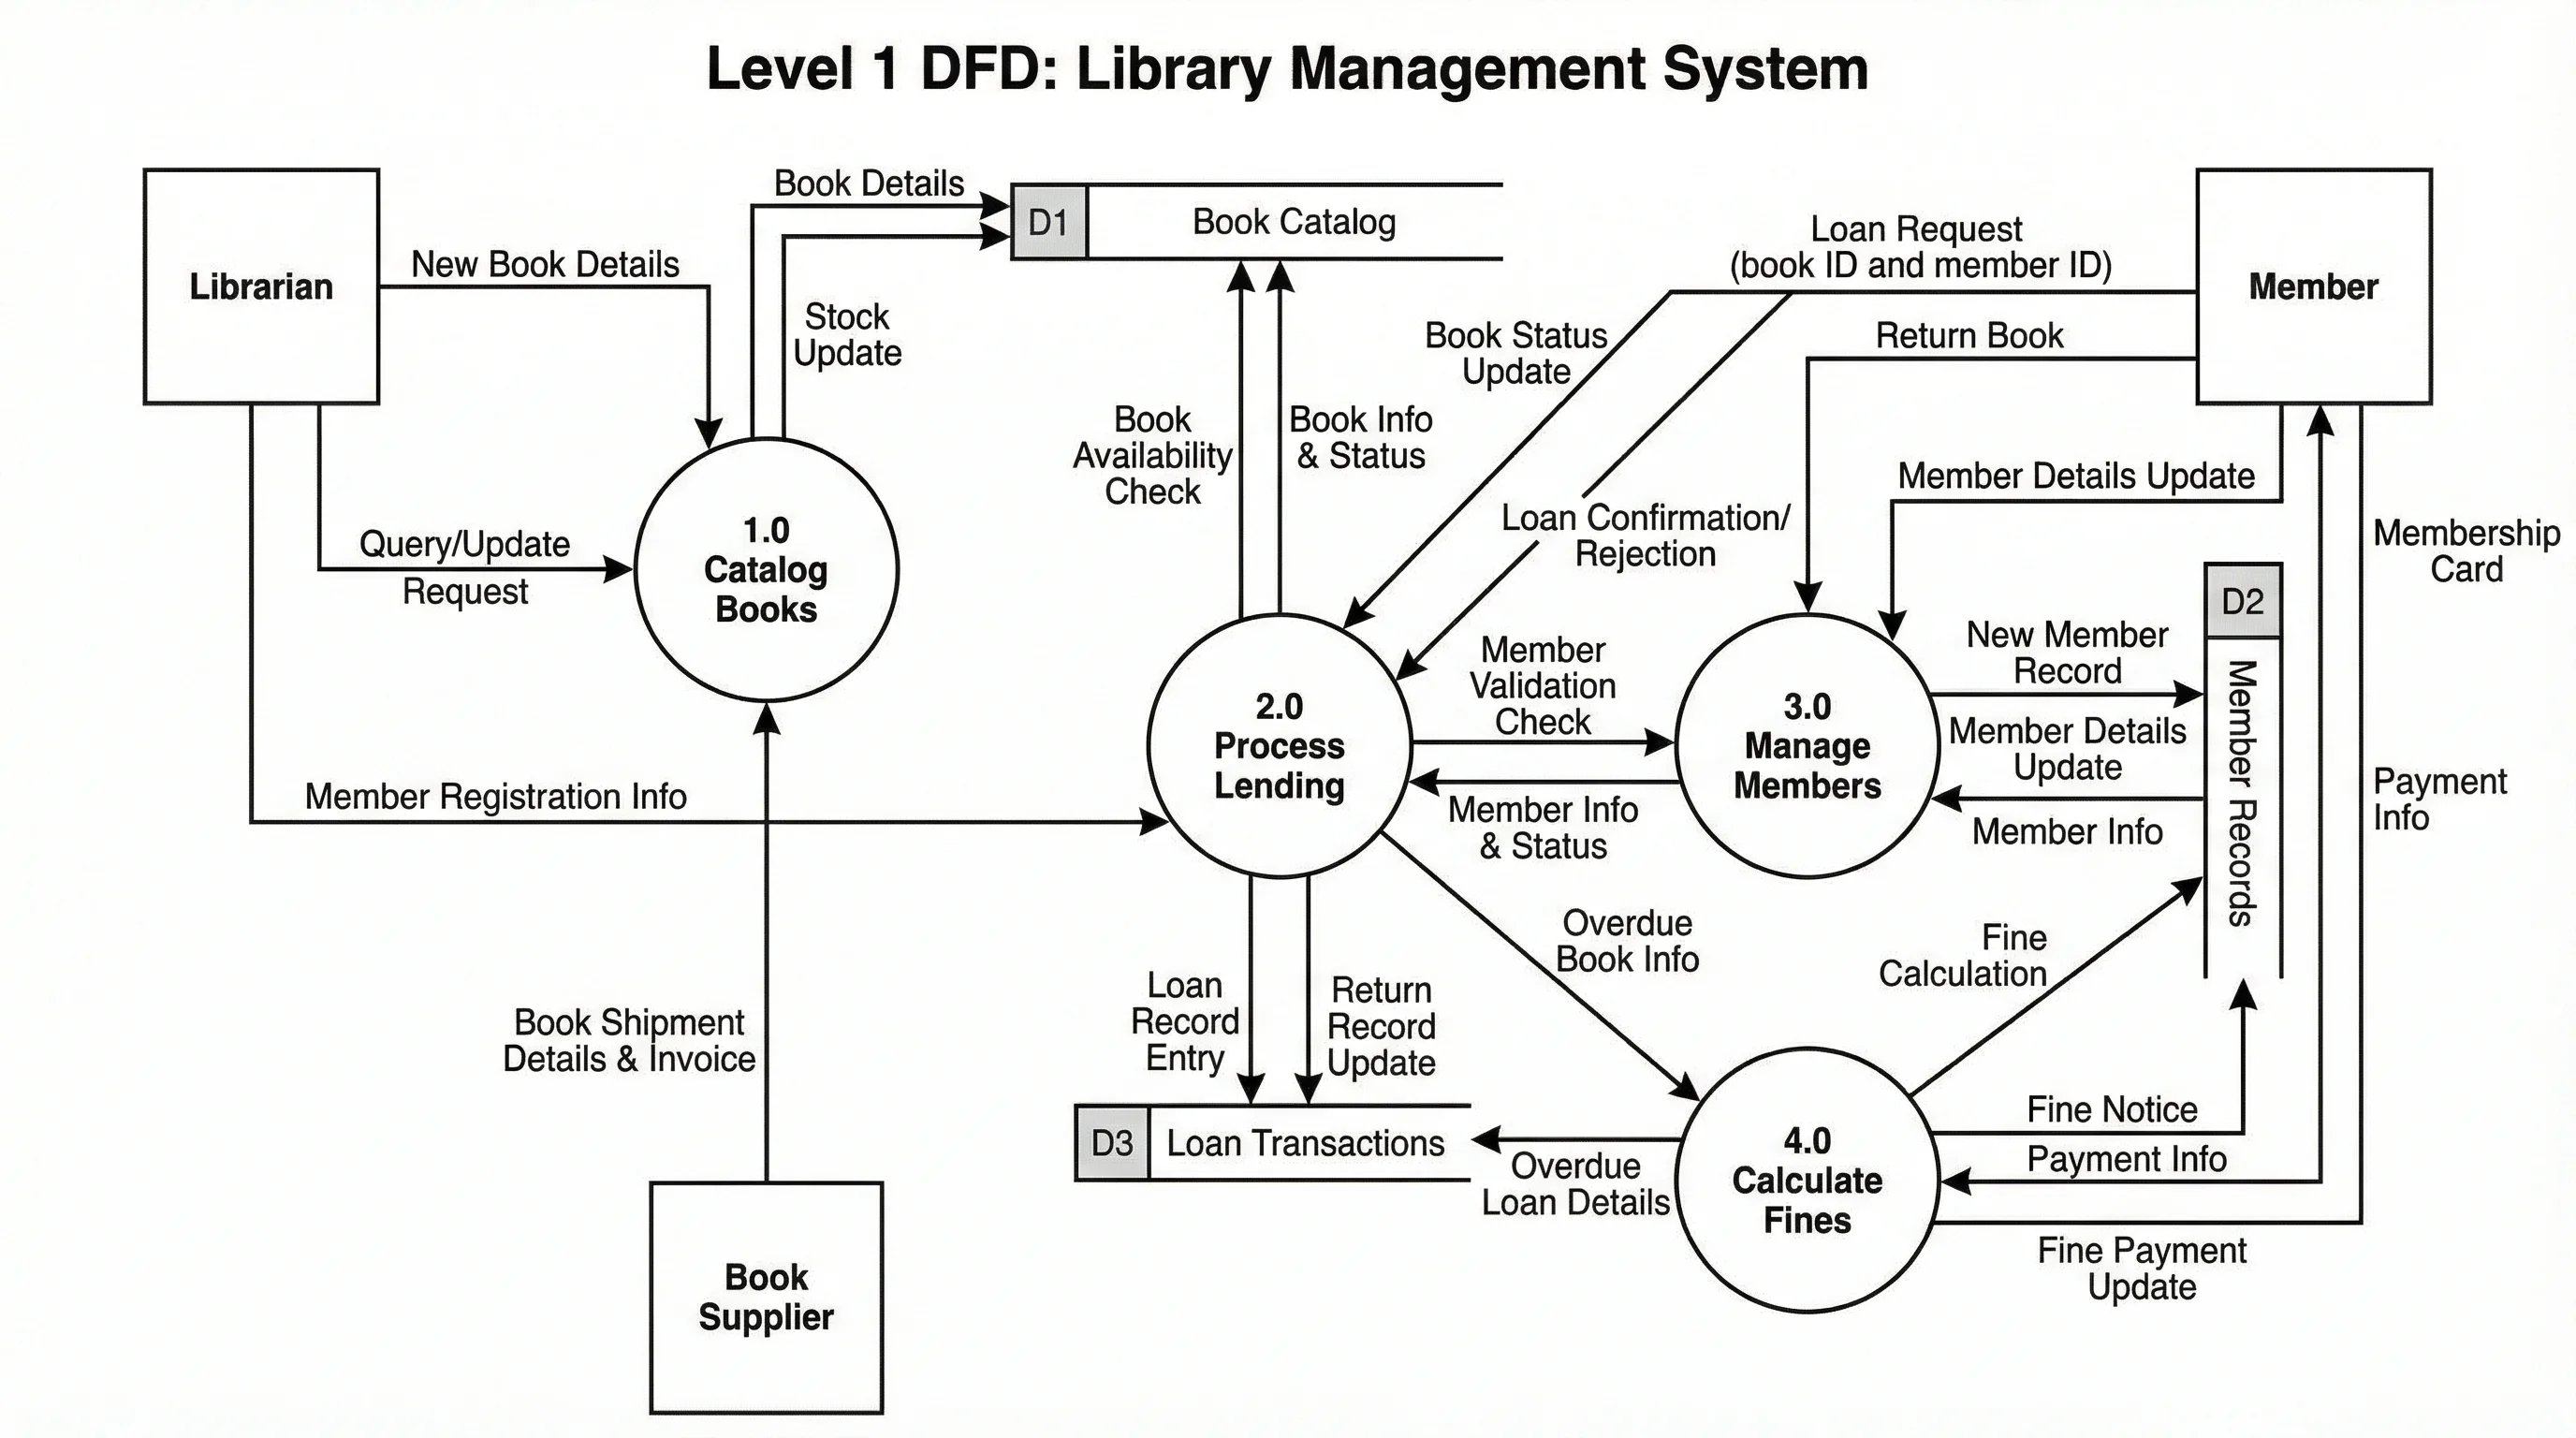
A data flow diagram for a library management system covering membership, loans, returns, and inventory
Common DFD Mistakes to Avoid
Even experienced analysts make these errors. Check your diagrams against this list before sharing them.
1. Unlabeled Data Flows
Every arrow on a DFD must carry a label describing the data it represents. An unlabeled arrow is meaningless--the reader cannot tell whether it carries "Customer Name," "Order Total," or "Error Message." Fix: Label every single flow with a descriptive noun phrase.
2. Processes Without Outputs (Black Holes)
A process that receives data but never sends any data out is called a black hole. This usually means you forgot an output or the process is not actually needed. Fix: Trace the logic--what does this process produce? Where does the result go?
3. Processes Without Inputs (Miracles)
A process that produces data without receiving any input is called a miracle. Real processes cannot create data from nothing. Fix: Identify what data feeds this process. It must come from an external entity, another process, or a data store.
4. Direct Data Store-to-Data Store Flows
Data stores are passive--they cannot send data to each other. Data must always flow through a process. If you need to move data between two stores, insert a process between them that reads from one and writes to the other.
5. Unbalanced Levels
When you decompose a process from Level 0 to Level 1, the child diagram must account for every data flow that enters or leaves the parent process. Missing or extra flows at a lower level indicate a balancing error. Fix: Place the parent diagram and child diagram side by side and verify every boundary flow is present.
6. Too Many Processes on One Diagram
A DFD with 15 or 20 processes on a single diagram is unreadable. The recommended limit is 3 to 9 processes per level. If you have more, decompose further into sub-levels instead of cramming everything onto one page.
When to Use DFDs vs Other Diagrams
DFDs are not the right tool for every situation. Here is how they compare with other common diagram types.
| Feature | DFD | Flowchart | UML Activity Diagram | BPMN |
|---|---|---|---|---|
| Primary focus | Data movement | Control flow and decisions | Object behavior and concurrency | Business process orchestration |
| Shows decisions? | No | Yes (diamond shapes) | Yes (decision nodes) | Yes (gateways) |
| Shows data stores? | Yes | No | No (uses object nodes) | Yes (data objects) |
| Shows parallel processing? | No | Limited | Yes (fork/join bars) | Yes (parallel gateways) |
| Leveled decomposition? | Yes (Levels 0, 1, 2...) | No | No | Yes (sub-processes) |
| Best for | System analysis, requirements | Algorithm logic, procedures | Software behavior modeling | Business process modeling |
Use a DFD when you need to understand what data enters a system, how it is transformed, and where it ends up. DFDs are ideal for the analysis phase before design begins.
Use a flowchart when you need to document step-by-step procedures with decision points and branching logic.
Use a UML activity diagram when you need to model concurrent workflows, swimlane responsibilities, or object state changes within a software system.
Use BPMN when you need to model end-to-end business processes with events, gateways, and role-based swim lanes.
For a broader overview of diagramming tools that support these formats, see our guide to the best free diagram software.
Frequently Asked Questions
What are the 4 components of a data flow diagram?
The four components are: (1) External entities (sources and sinks of data outside the system), (2) Processes (activities that transform data), (3) Data stores (repositories where data is held), and (4) Data flows (arrows showing the movement of data between components). These four symbols are used in every DFD regardless of notation style.
What is the difference between a DFD and a flowchart?
A DFD focuses on data movement--where data originates, how it is transformed, and where it is stored. A flowchart focuses on control flow--the sequence of steps, decisions, and branches in a process. DFDs do not show decision logic (if/else), loops, or timing. Flowcharts do not show data stores or distinguish between internal and external data sources. They answer different questions about a system.
How many levels does a DFD have?
Theoretically, a DFD can have unlimited levels, but in practice most systems are fully described in 3 to 4 levels (Level 0 through Level 3). Level 0 is the context diagram showing the entire system as one process. Level 1 breaks that into major sub-processes. Level 2 and Level 3 decompose individual processes further. If you go beyond Level 3, consider whether you are over-documenting.
Can DFDs model databases?
DFDs include data stores that represent databases, files, and other repositories, but they do not model database structure (tables, columns, relationships). For database modeling, use an entity-relationship diagram (ERD). DFDs show what data is stored and which processes access it, while ERDs show how that data is organized internally.
Is the data flow diagram still relevant in 2026?
Yes. While newer modeling techniques like BPMN and UML have gained popularity, DFDs remain highly relevant for systems analysis and requirements gathering. They are simpler to learn than UML, more focused on data than BPMN, and uniquely effective at identifying all data inputs, outputs, and transformations in a system. Many regulatory frameworks and government agencies still require DFDs as part of their documentation standards. In an era of complex data pipelines and microservice architectures, understanding data flow is more important than ever.
Start Creating Data Flow Diagrams
Data flow diagrams give you a structured, visual approach to understanding any system. Start with a context diagram to establish boundaries, decompose into levels to reveal detail, and validate each level to catch errors early. Whether you are analyzing a legacy system or designing a new application, DFDs keep the focus on what matters most--how data moves through your system.
Data Flow Diagram Generator
Generate DFDs from text descriptions — no drag-and-drop needed.
Catégories
Plus d'articles

Use Case Diagram Generator Guide: Create UML Use Cases from Text
Learn how to use a use case diagram generator, define actors and system boundaries, write better prompts, and avoid common UML notation mistakes.

Infographic Design Styles & Trends: Flat, Isometric, Hand-Drawn and Minimalist
Compare infographic design styles and trends: flat, isometric, hand-drawn, minimalist, 3D and editorial layouts, with examples and selection rules.

How to Create a Workflow Diagram: Step-by-Step Guide with Examples
Learn how to create a workflow diagram for research, business processes, and team projects. Step-by-step guide with symbols, types, best practices, and free tools.