Energy Level Diagram Generator for Atoms & Electron Transitions
Make an atomic energy level diagram in seconds. Plot hydrogen energy levels (E = −13.6/n² eV) with electron transitions and the Lyman, Balmer, and Paschen series, showing emission wavelengths — then export SVG or PNG, free.
Energy Level Diagram Examples
Hydrogen levels and spectral series rendered by the exact engine
Hydrogen Energy Levels
Hydrogen levels at E = −13.6/n² eV — they correctly bunch up toward 0 eV (ionization).
Balmer Series (Visible)
Transitions down to n=2 emit visible light — Hα 656 nm, Hβ 486 nm, and more.
Lyman Series (UV)
Transitions down to n=1 are higher energy — ultraviolet emission.
Paschen Series (IR)
Transitions down to n=3 are lower energy — infrared emission.
Electron Transitions
Each downward jump emits a photon; the arrow shows the transition and wavelength.
Generic Energy Levels
Evenly spaced levels for a generic atom when you do not need hydrogen values.
What is an energy level diagram?
An energy level diagram shows the allowed energies an electron can have in an atom as a set of horizontal lines, with energy increasing upward. Electrons occupy these levels, and they can jump between them by absorbing or emitting a photon whose energy equals the gap between the two levels. Energy level diagrams are central to atomic structure, spectroscopy, and explaining line spectra.
The hydrogen energy level diagram
For the hydrogen atom the energy of level n is E = −13.6/n² eV. The ground state n=1 sits at −13.6 eV, n=2 at −3.4 eV, n=3 at −1.51 eV, and so on, approaching 0 eV (ionization) as n → ∞. Because the energies get closer together at higher n, the levels visibly bunch up toward the top of the diagram — this generator draws that spacing exactly, which is the detail AI images usually get wrong.
Electron transitions: absorption and emission
- Absorption: an electron jumps up to a higher level by absorbing a photon (drawn as an upward arrow).
- Emission: an electron drops to a lower level and emits a photon (a downward arrow).
- The photon energy equals the energy gap: ΔE = E_high − E_low. Its wavelength is λ = 1240 / ΔE (with ΔE in eV and λ in nm).
- The bigger the jump in energy, the higher the photon energy and the shorter the wavelength.
The hydrogen spectral series: Lyman, Balmer, Paschen
Transitions that end on the same final level form a spectral series. The Lyman series ends at n=1 and lies in the ultraviolet; the Balmer series ends at n=2 and produces the visible hydrogen lines (Hα at 656 nm, Hβ at 486 nm, …); the Paschen series ends at n=3 and lies in the infrared. Pick a series in this tool to draw its transitions with the emitted wavelengths labeled.
How to read wavelengths from the diagram
Each transition arrow corresponds to one spectral line. The energy released is the gap between the two levels, and the wavelength follows from λ = 1240/ΔE nm. The Balmer series, ending at n=2, falls in the visible range, which is why hydrogen gas glows pink-red — dominated by the 656 nm Hα line. This generator calculates and labels each wavelength for you.
When to use the AI illustration mode
Use the exact Energy levels mode for correctly-spaced atomic energy levels and transitions. Switch to AI illustration for richer scenes: an atom with orbiting electrons beside its levels, a molecular-orbital (MO) energy diagram, or an emission line spectrum aligned with the transitions.
常見問題
Related Chemistry Tools
 Chemistry
Bohr Model Maker
Create Bohr model atomic diagrams showing electron shells for any element.
 Chemistry
Particle Diagram Generator
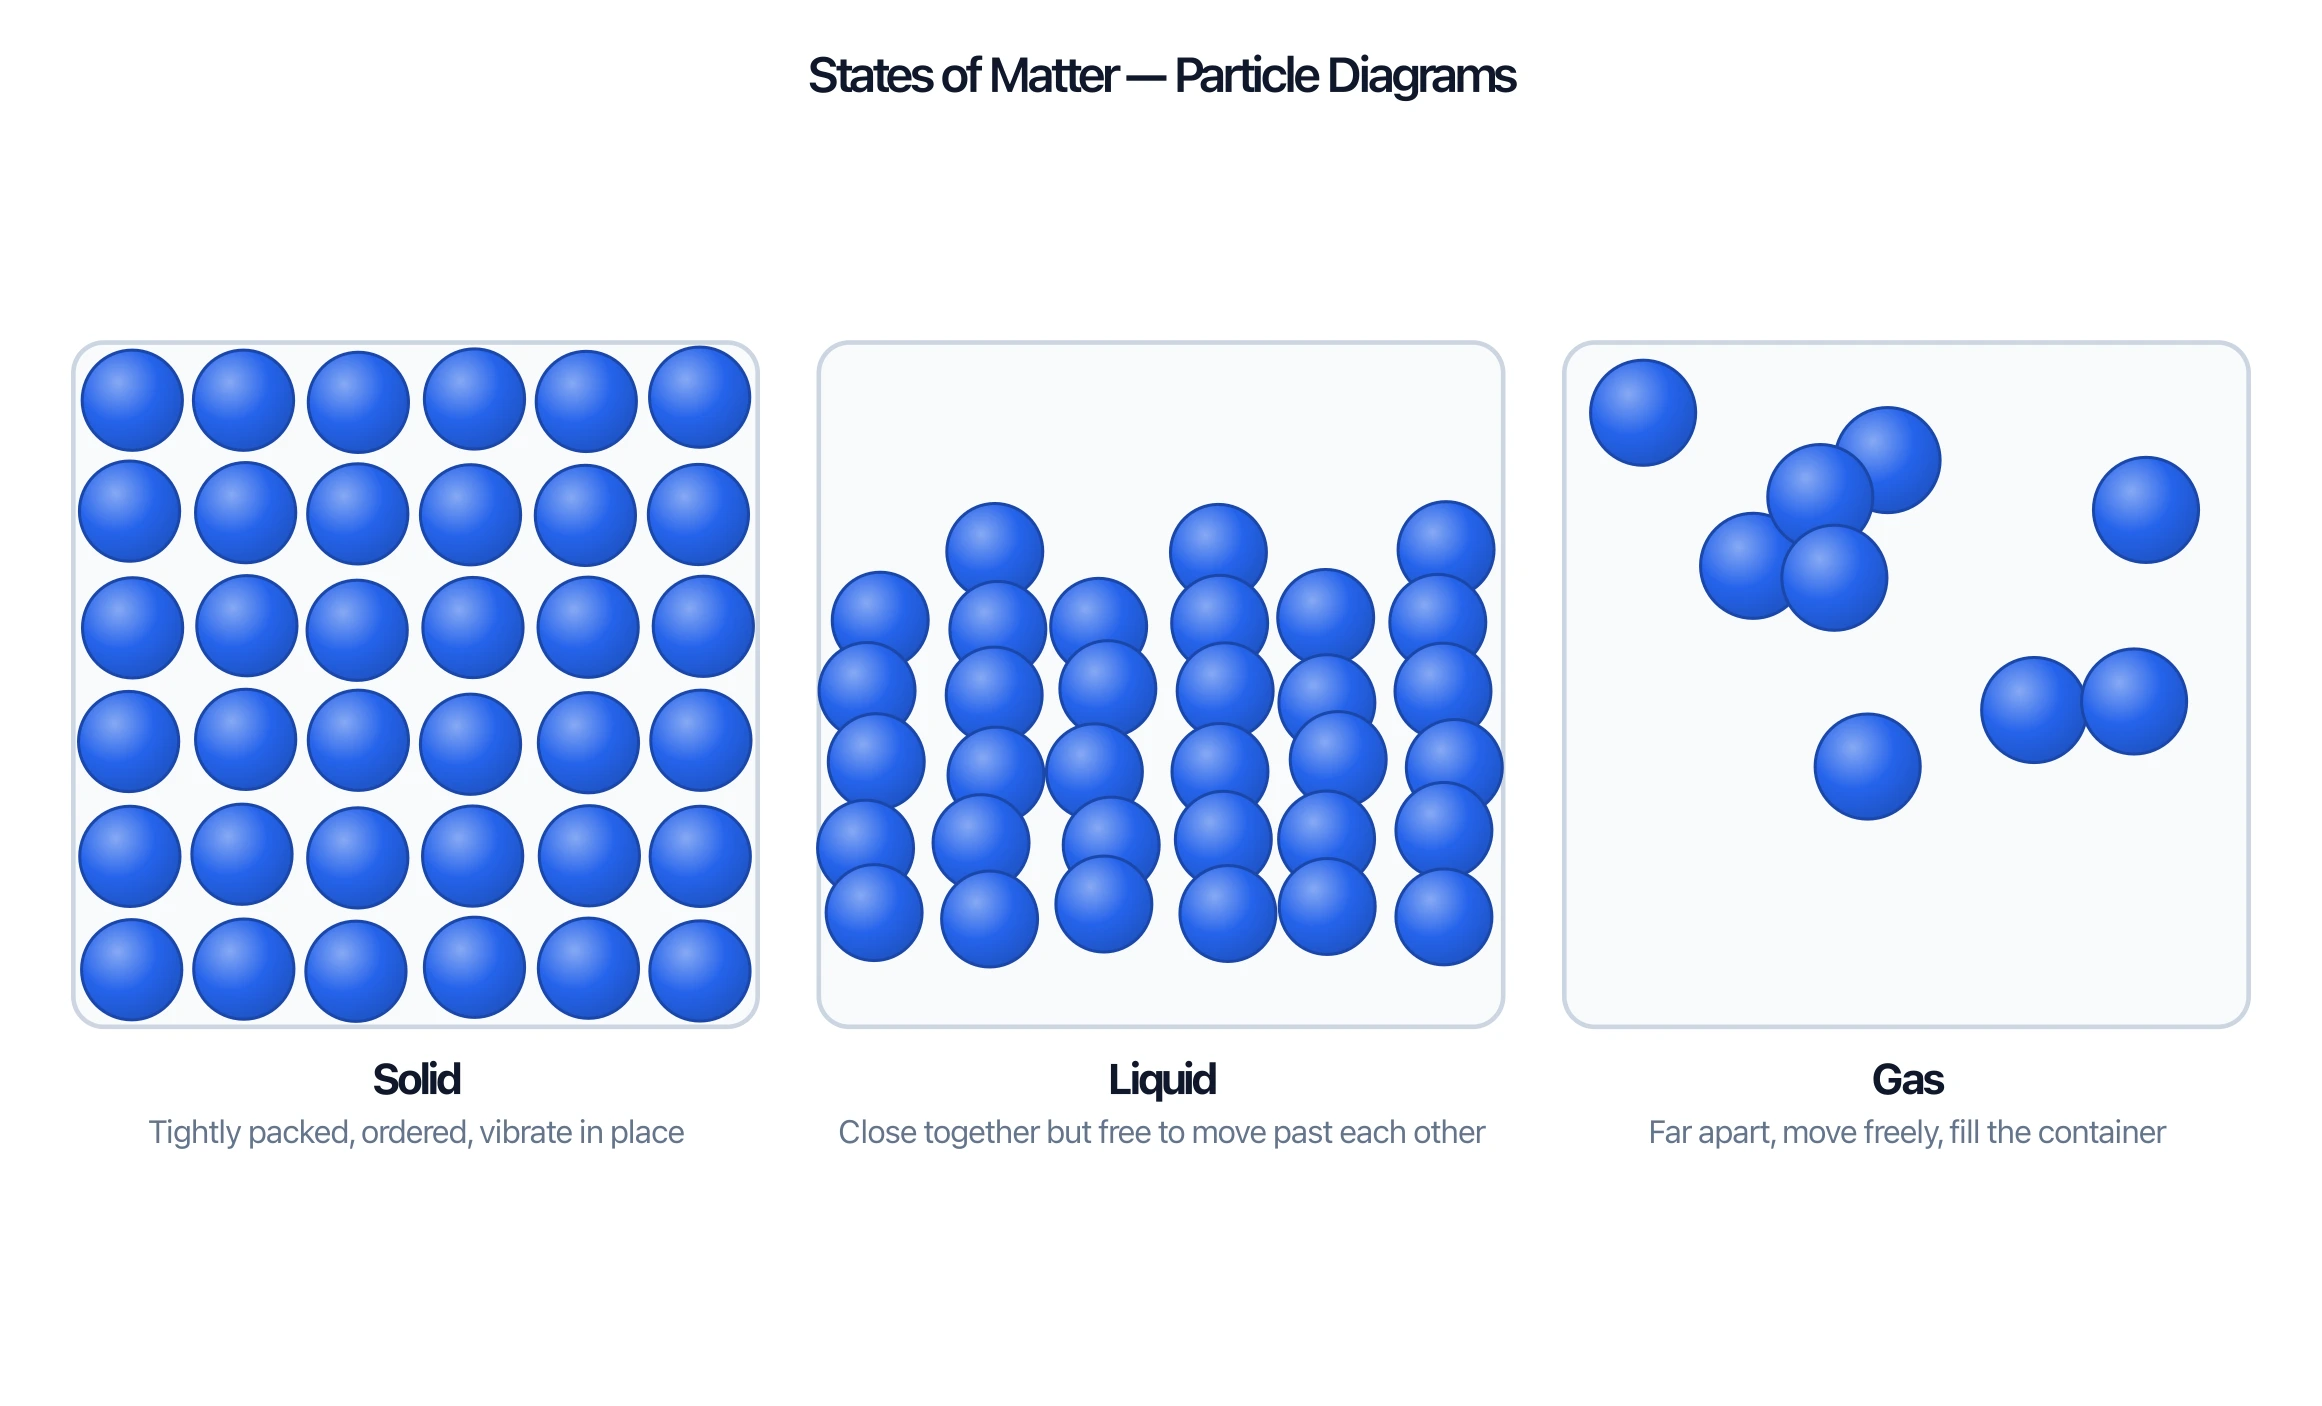
Make particle diagrams for states of matter and element/compound/mixture.
 Chemistry
Chemistry Structure Generator
Draw molecules, mechanisms, and chemical structures with clean bonds and labels.