
Vector Diagram Physics Guide: How to Draw and Read Vector Diagrams
Learn how to draw vector diagrams in physics, add vectors head-to-tail, resolve components, find resultants, and avoid common diagram mistakes.
A vector diagram is a physics drawing that uses arrows to show quantities with both magnitude and direction. Forces, displacement, velocity, acceleration, momentum, and electric field are all vector quantities, so they need more than a number. A vector diagram shows how large the quantity is, which way it points, and how several vectors combine.
This guide explains how to draw vector diagrams in physics, how to use the head-to-tail method, how to find a resultant vector, when to resolve a vector into components, and how vector diagrams differ from free body diagrams.
Vector Diagram Physics Maker
Create precise vector component, head-to-tail, and resultant diagrams from magnitudes and angles.
Make a vector diagram ->Quick Answer: How Do You Draw a Vector Diagram in Physics?
To draw a vector diagram:
- Identify the vector quantity, such as force, displacement, velocity, or acceleration.
- Choose a scale if the diagram needs measurement, such as 1 cm = 10 N.
- Draw an arrow in the correct direction.
- Make the arrow length proportional to the magnitude.
- Label the vector with its symbol, magnitude, and unit.
- For vector addition, place arrows head-to-tail.
- Draw the resultant from the tail of the first vector to the head of the last vector.
- For angled vectors, resolve them into x- and y-components if exact calculation is needed.
The two rules that matter most are: the arrow direction shows direction, and the arrow length represents magnitude.
A useful vector diagram makes direction, magnitude, and the resultant visible at a glance.
What Is a Vector Diagram in Physics?
A vector diagram represents a physical vector as an arrow. The arrow's length represents magnitude. The arrow's direction represents the direction of the quantity.
Physics LibreTexts explains vectors as quantities that require both magnitude and direction; displacement, velocity, and acceleration are common examples. That is why a vector diagram is not just decoration. It is part of the reasoning.
| Quantity | Vector or scalar? | Why |
|---|---|---|
| Distance | Scalar | Only size matters |
| Displacement | Vector | Size and direction matter |
| Speed | Scalar | Only how fast |
| Velocity | Vector | Speed plus direction |
| Mass | Scalar | No direction |
| Force | Vector | Magnitude and direction |
| Acceleration | Vector | Change in velocity has direction |
For example, "10 m" is a distance. "10 m east" is a displacement vector. "5 N" is incomplete if you are drawing forces; "5 N to the right" is a force vector.
Vector Diagram vs Free Body Diagram
Vector diagrams and free body diagrams overlap, but they are not the same.
| Diagram type | Main purpose | What the arrows represent |
|---|---|---|
| Vector diagram | Add, subtract, compare, or resolve vectors | Any vector quantity: force, displacement, velocity, acceleration |
| Free body diagram | Show all forces acting on one object | Force vectors only |
| Motion diagram | Show position snapshots over time | Position dots, velocity arrows, acceleration arrows |
A free body diagram is a specialized force diagram for one object. It usually draws all force arrows from the object's center of mass. A vector diagram can be more general: it may show displacement legs in a walk, velocity components, resultant force, or the x- and y-components of an angled vector.
If the problem asks "what forces act on the box?", start with a free body diagram. If it asks "what is the resultant of these vectors?", draw a vector addition diagram.
Free Body Diagram Generator
Create labeled force diagrams for ramps, friction, tension, equilibrium, pulleys, and circular motion.
The Parts of a Good Vector Diagram
Every useful vector diagram has four parts.
1. Arrow tail
The tail is the starting point of the vector. In a coordinate diagram, the tail may begin at the origin. In a head-to-tail addition diagram, the tail of each new vector starts at the head of the previous vector.
2. Arrow head
The arrow head shows the direction. A force to the right, a displacement north, or a velocity downward should all point in the correct direction. Direction errors are more damaging than small style errors because they change the physics.
3. Arrow length
Arrow length represents magnitude. If one force is twice as large as another, its arrow should be about twice as long in a scale diagram. If the diagram is only qualitative, the arrow lengths should still show relative size.
4. Label
A label should identify the vector clearly:
F = 20 N right
v = 12 m/s north
A = 5 km east
R = resultant
Use units for physical quantities. If you are using a scale, write it on the diagram.
Head-to-Tail Vector Addition
The head-to-tail method is the most common graphical method for adding vectors. You draw the first vector, move the second vector so its tail begins at the head of the first, then draw the resultant from the start to the final endpoint.
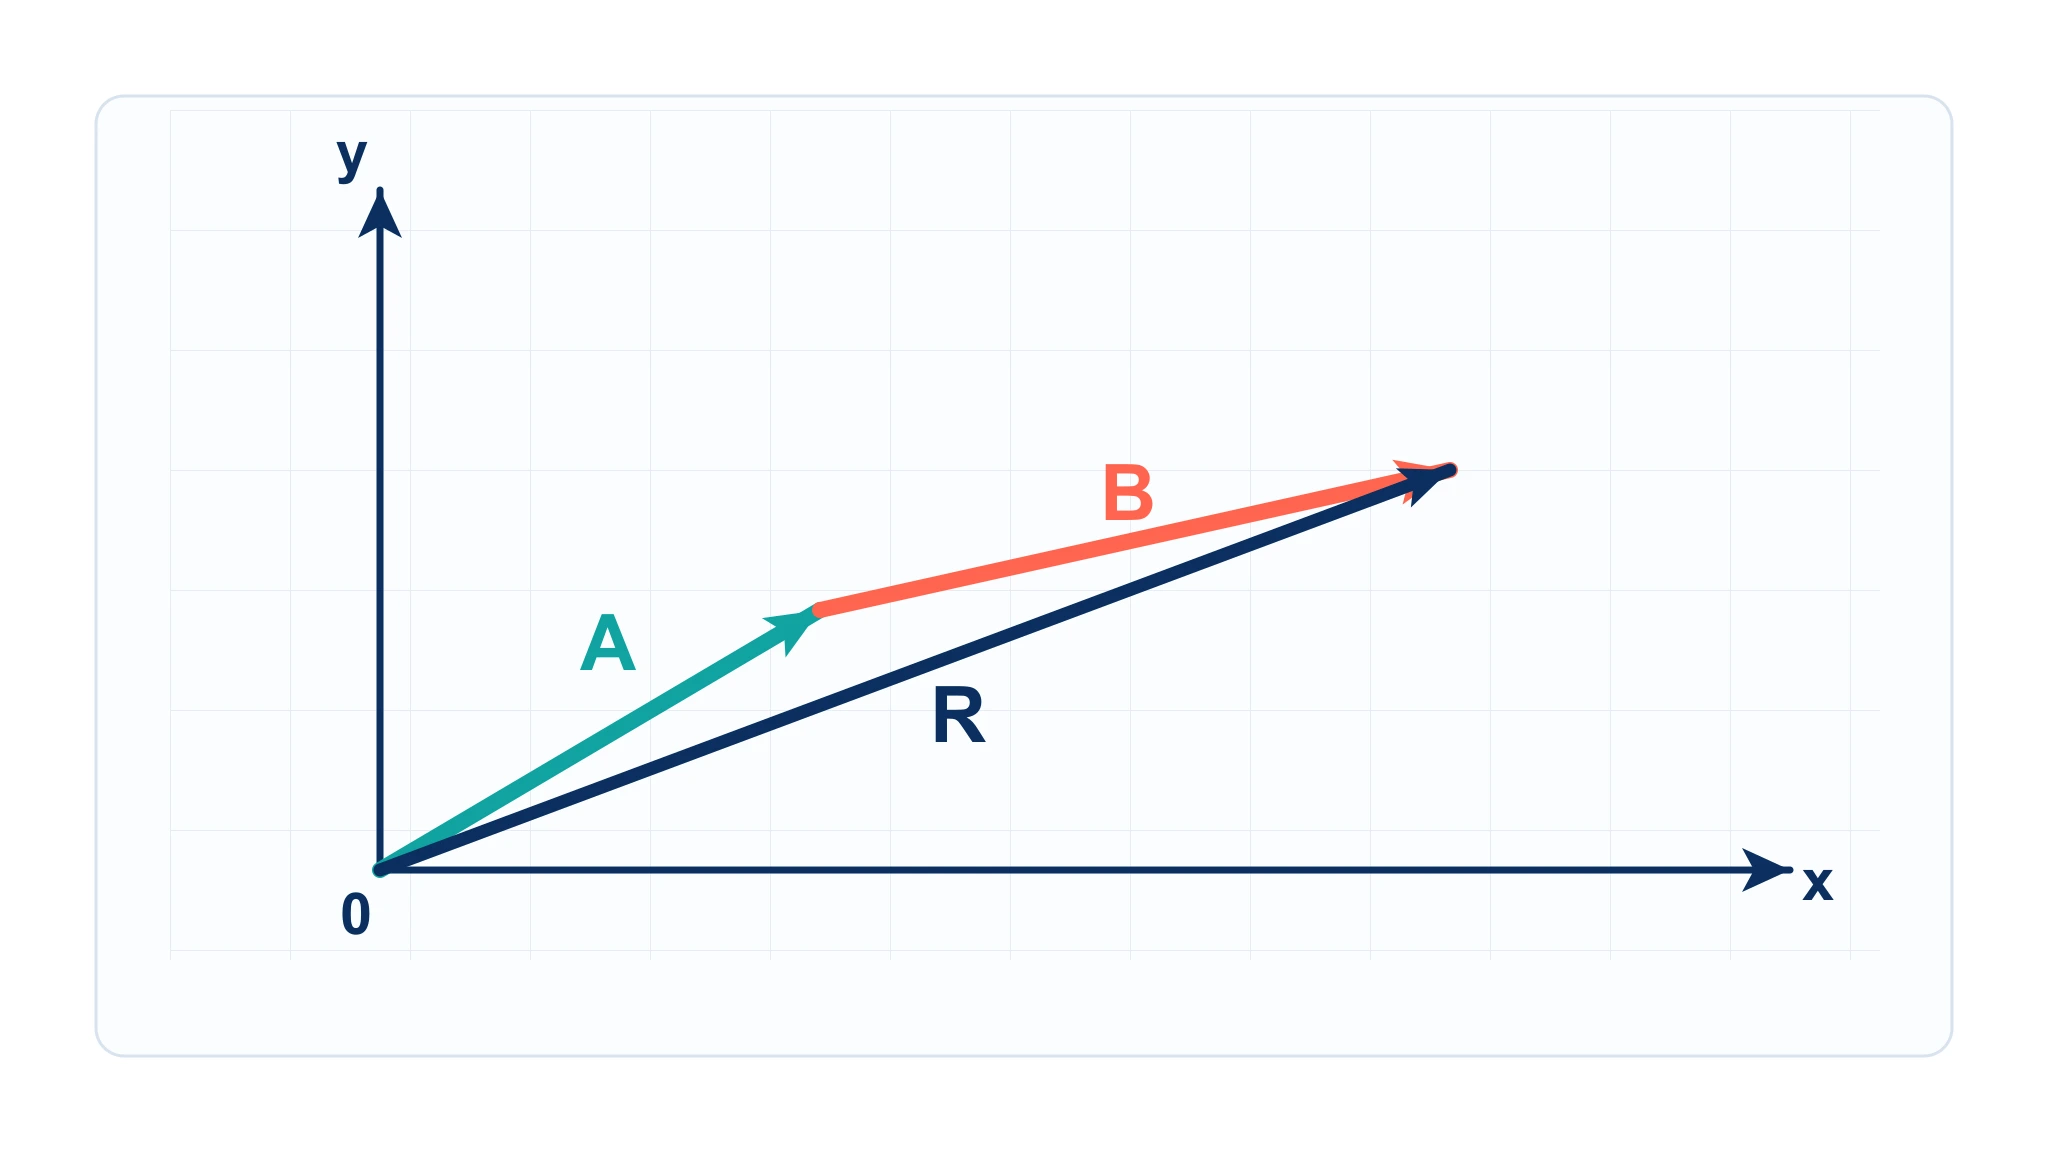
The resultant vector runs from the tail of the first vector to the head of the last vector.
Physics LibreTexts describes graphical vector addition as placing vectors end to end on axes. The final arrow from the original starting point to the final arrow head is the vector sum.
Use the method this way:
- Draw vector A to scale and in the correct direction.
- Draw vector B with its tail at the head of A.
- If there are more vectors, continue the chain.
- Draw R from the tail of A to the head of the final vector.
- Measure R if using a scale drawing.
- State both magnitude and direction.
The order does not change the final resultant for addition, but the diagram is usually easier to read if the vectors are arranged in the same order as the problem statement.
Scale Vector Diagrams
A scale vector diagram lets you measure a resultant with a ruler and protractor. This is common in GCSE, IGCSE, and introductory physics problems.
For example:
Scale: 1 cm = 2 N
Force A: 6 N east -> draw 3 cm east
Force B: 8 N north -> draw 4 cm north from the head of A
Resultant R: measure the diagonal
Save My Exams' GCSE physics notes on scale drawings and vector diagrams emphasize the same classroom workflow: choose a suitable scale, draw vectors top-to-tail, draw the resultant, then convert the measured length back into physical units.
| Step | What to do | Common mistake |
|---|---|---|
| Choose scale | Make the drawing large enough to measure | Scale too small |
| Draw first vector | Use ruler and protractor | Rough sketch only |
| Add next vector | Tail starts at previous head | Vectors left tail-to-tail |
| Draw resultant | Tail of first to head of last | Resultant drawn between wrong points |
| Convert length | Use the original scale | Reporting cm instead of N, m, or km |
Scale diagrams are good for visual understanding. For high-precision answers, components and trigonometry are usually better.
Resolving a Vector into Components
Resolving a vector means splitting it into perpendicular parts, usually horizontal and vertical components. This is useful because components along the same axis can be added like signed numbers.
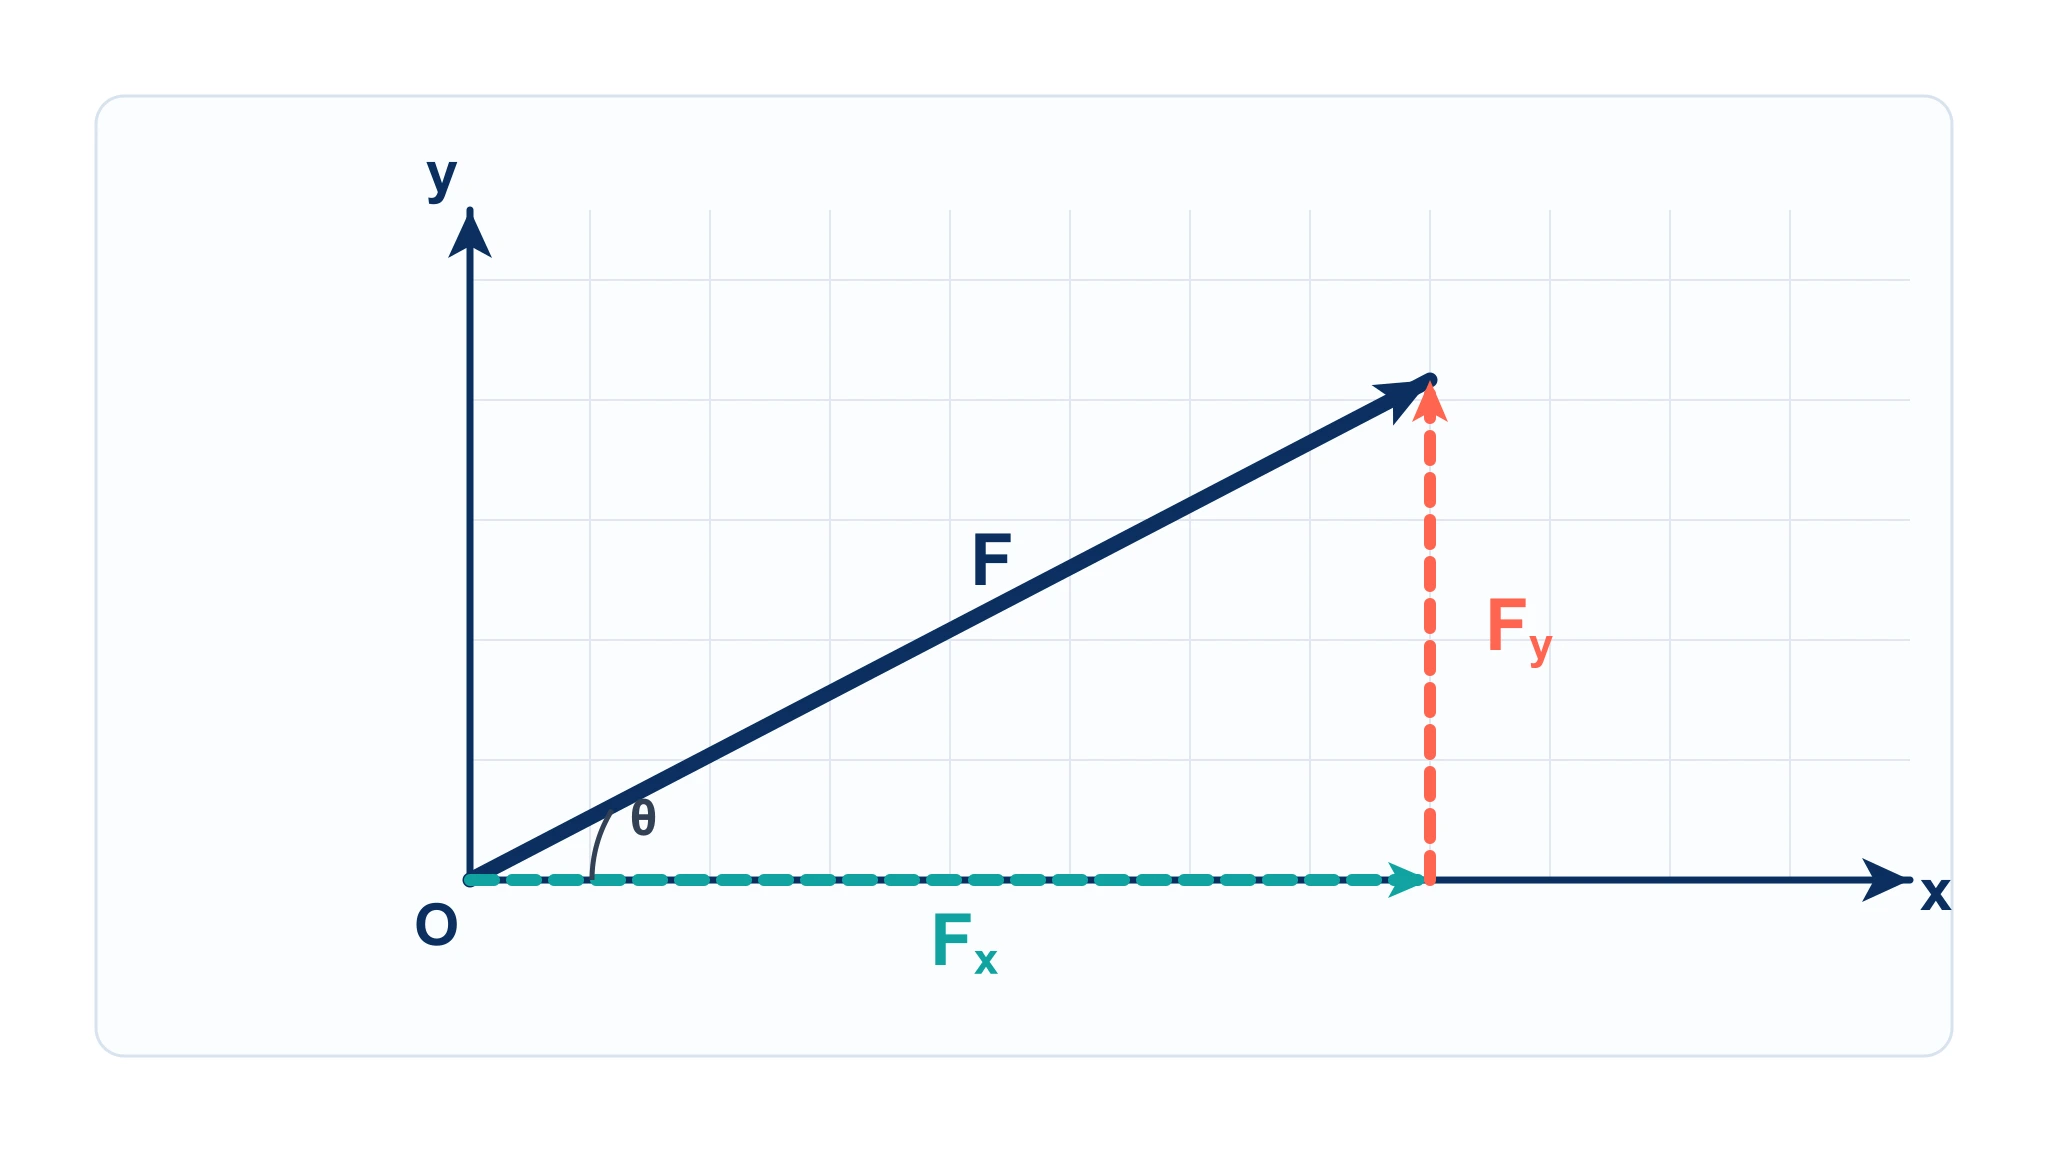
A vector can be represented as the sum of its x-component and y-component.
OpenStax University Physics describes the x- and y-components as projections of the vector onto the coordinate axes. In a diagram, the original vector is the diagonal, and its components form the sides of a right triangle.
For a vector F at angle theta above the positive x-axis:
Fx = F cos(theta)
Fy = F sin(theta)
F = sqrt(Fx^2 + Fy^2)
theta = tan^-1(Fy / Fx)
The formulas depend on how the angle is measured. If the angle is measured from the y-axis instead of the x-axis, sine and cosine switch roles. That is one reason a clear diagram matters.
Worked Example: Resultant of Two Perpendicular Forces
Suppose two forces act on an object:
6 N east
8 N north
Draw the 6 N vector to the right. From its head, draw the 8 N vector upward. The resultant R runs from the original starting point to the final endpoint.
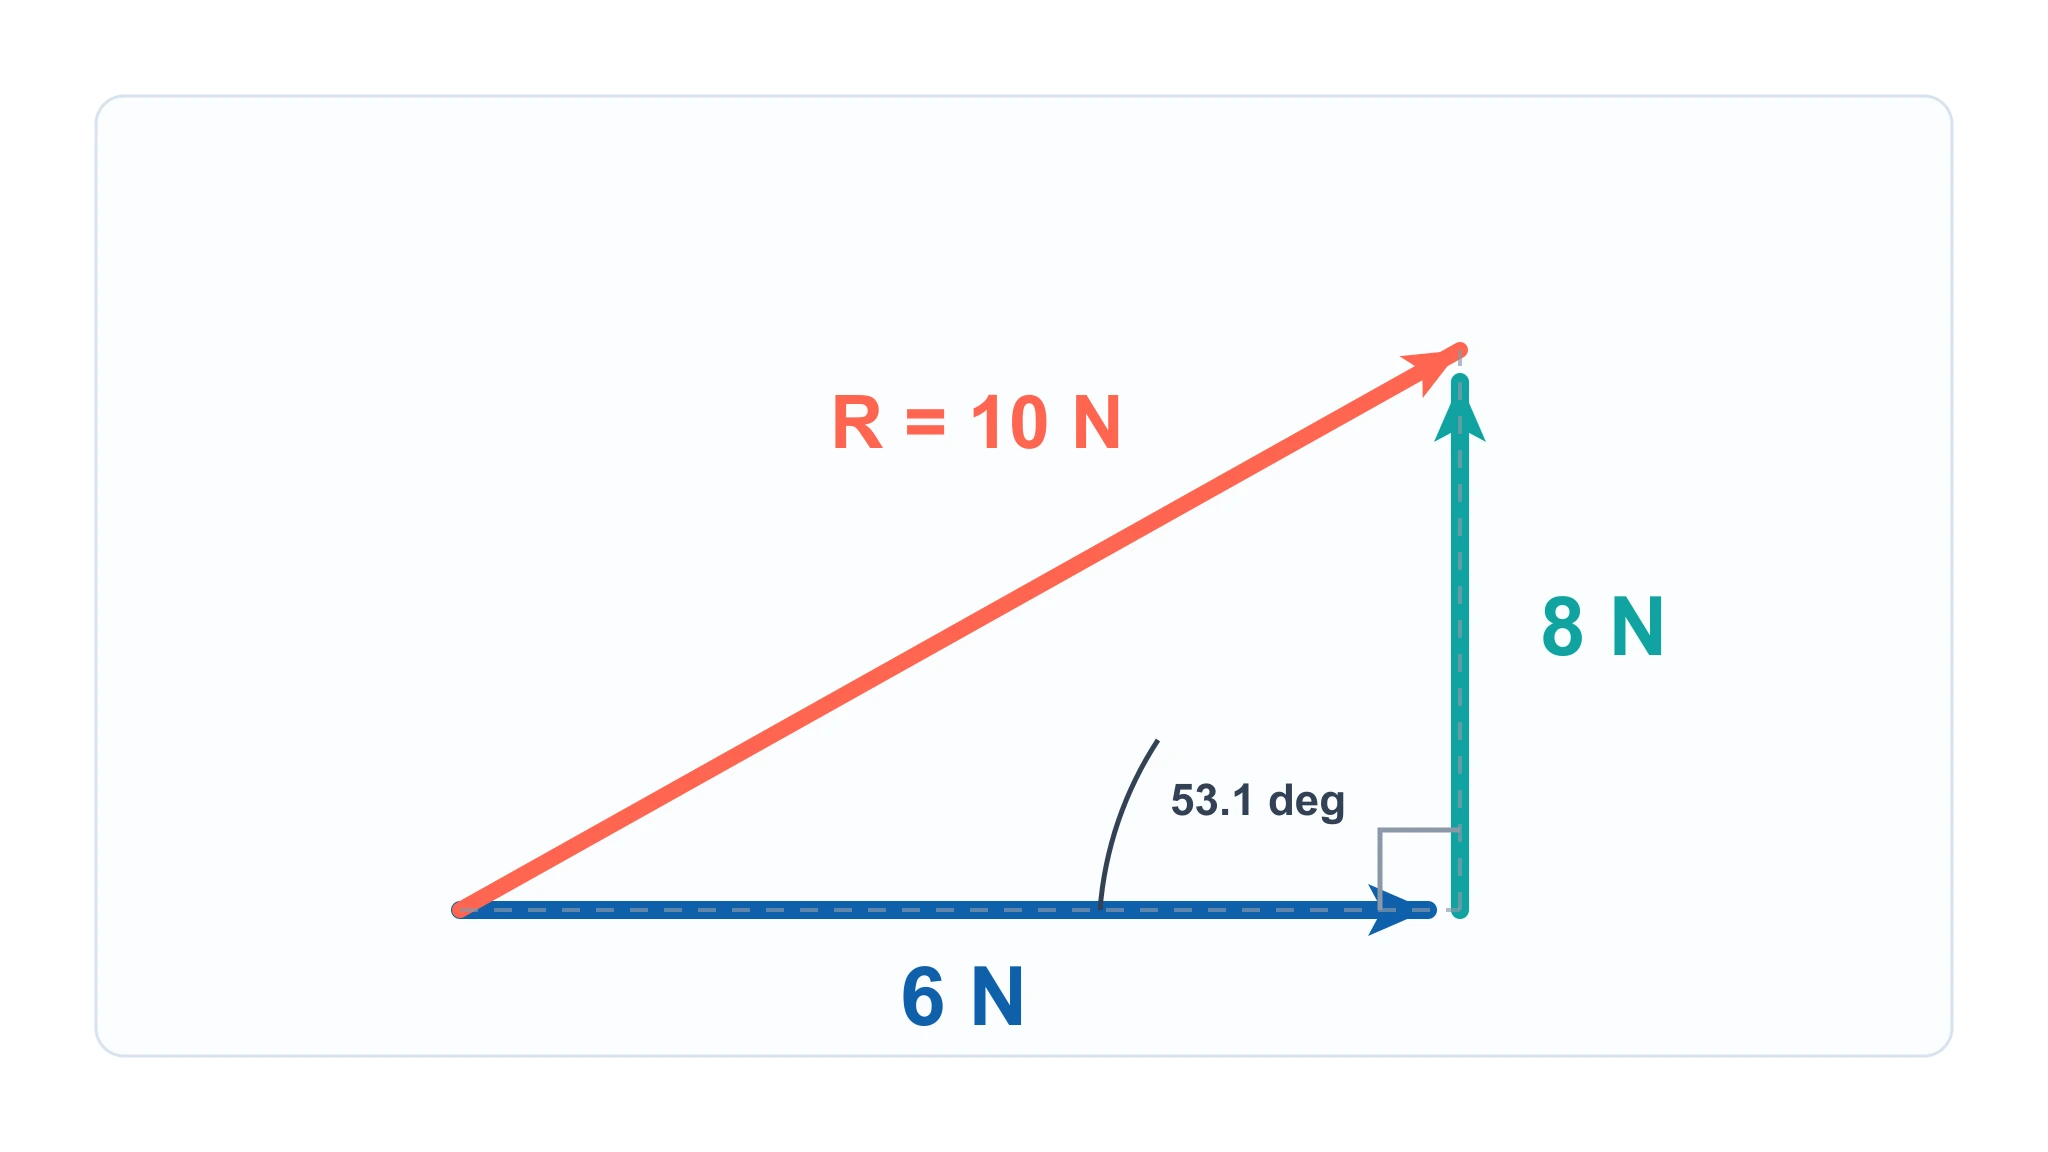
For perpendicular vectors, the resultant forms the hypotenuse of a right triangle.
Because the two vectors are perpendicular, use the Pythagorean theorem:
R = sqrt(6^2 + 8^2)
R = sqrt(36 + 64)
R = 10 N
The direction angle from east is:
theta = tan^-1(8 / 6)
theta = 53.1 degrees north of east
So the resultant is:
10 N at 53.1 degrees north of eastThis example is simple, but it shows the full structure: draw the diagram first, identify the right triangle, then calculate magnitude and direction.
Adding Vectors with Components
When vectors are not perpendicular, or when there are more than two, components are often the cleanest method. OpenStax College Physics describes analytical vector addition as resolving each vector into horizontal and vertical components, adding components by axis, then calculating the resultant magnitude and direction.
Use this workflow:
- Choose x and y axes.
- Resolve every vector into x and y components.
- Add all x-components to get Rx.
- Add all y-components to get Ry.
- Calculate the resultant magnitude.
- Calculate the direction angle.
- Check whether the direction matches the original diagram.
In compact form:
Rx = Ax + Bx + Cx + ...
Ry = Ay + By + Cy + ...
R = sqrt(Rx^2 + Ry^2)
theta = tan^-1(Ry / Rx)
Always keep signs. A leftward component is negative if right is positive. A downward component is negative if up is positive.
Parallelogram Method
The parallelogram method is another graphical way to add two vectors that start from the same point.
Use it when two vectors are drawn tail-to-tail:
- Draw vector A and vector B from the same starting point.
- Copy A from the head of B.
- Copy B from the head of A.
- The two copied vectors form a parallelogram.
- Draw the diagonal from the shared tail to the opposite corner.
- That diagonal is the resultant.
The parallelogram method and head-to-tail method give the same resultant. The head-to-tail method is usually simpler for multiple vectors. The parallelogram method is useful when a problem already shows two forces acting from the same point.
When to Use Which Vector Diagram Method
| Situation | Best method | Why |
|---|---|---|
| Two perpendicular vectors | Right triangle | Fast magnitude and angle |
| Several vectors in sequence | Head-to-tail diagram | Shows total displacement or resultant clearly |
| Two vectors from one point | Parallelogram method | Matches the original force picture |
| Angled forces with numbers | Components | More accurate than ruler measurement |
| Qualitative physics explanation | Simple arrow diagram | Focuses on direction and relative size |
| Force analysis on one object | Free body diagram first | Identifies all forces before adding |
Students often try to calculate before drawing. For vector problems, the diagram is not extra work. It prevents sign errors, direction errors, and wrong-angle errors.
Common Mistakes in Vector Diagrams
Mistake 1: Adding magnitudes without direction
You cannot simply add 6 N and 8 N to get 14 N if the forces point in different directions. Magnitudes add directly only when vectors point along the same line in the same direction.
Mistake 2: Drawing vectors tail-to-tail when using head-to-tail addition
For head-to-tail addition, the second vector's tail must start at the first vector's head. If two vectors are drawn from the same origin, use the parallelogram method or redraw one vector head-to-tail.
Mistake 3: Forgetting the scale
If 1 cm = 5 N, a measured 4 cm resultant means 20 N, not 4 N. Write the scale on the page.
Mistake 4: Using sine and cosine with the wrong angle
If theta is measured from the x-axis, use:
Fx = F cos(theta)
Fy = F sin(theta)
If theta is measured from the y-axis, the component next to the angle changes. Sketch the right triangle before choosing sine or cosine.
Mistake 5: Ignoring negative components
Left and down are not automatically "bad"; they are just negative if your positive axes point right and up. The signs tell you the quadrant of the resultant.
Mistake 6: Mixing vector diagrams with motion diagrams
A velocity arrow in a motion diagram is not the same as a force arrow in a free body diagram. Label what each arrow represents.
Motion Diagram Physics Maker
Create position-dot diagrams with velocity and acceleration arrows when the task is kinematics, not vector addition.
Vector Diagram Checklist
Before submitting a vector diagram, check:
- The vector quantity is named.
- Each arrow has a clear direction.
- Arrow lengths match relative magnitudes.
- The scale is written if measurement is required.
- The resultant starts at the first tail and ends at the final head.
- Components are perpendicular to the chosen axes.
- Units are included.
- Negative components match the chosen coordinate system.
- The answer includes both magnitude and direction.
- The diagram is not confused with a free body diagram or motion diagram.
Practice Prompts
Use these prompts to test whether you can draw vector diagrams correctly.
| Prompt | Diagram type to use |
|---|---|
| A student walks 4 m east, then 3 m north. Find displacement. | Head-to-tail and right triangle |
| A force of 20 N acts 30 degrees above horizontal. Find components. | Component diagram |
| Two forces of 12 N and 9 N act at right angles. Find resultant. | Right triangle resultant |
| Three displacement vectors are given with angles. Find total displacement. | Component method |
| A box rests on a ramp with gravity, normal force, and friction. | Free body diagram first |
| Two ropes pull a hanging sign at angles. Is it in equilibrium? | Force vector triangle |
If a prompt gives angles and magnitudes, draw first and calculate second. If a prompt gives a physical object with forces acting on it, draw the free body diagram before adding vectors.
FAQ
What is a vector diagram in physics?
A vector diagram is a physics drawing that represents a vector quantity with an arrow. The arrow length represents magnitude, and the arrow direction represents the direction of the quantity.
How do you draw a resultant vector?
For head-to-tail addition, place each vector so the next tail begins at the previous head. Draw the resultant from the tail of the first vector to the head of the last vector.
What is the difference between a vector diagram and a free body diagram?
A vector diagram can show any vector quantity, including displacement, velocity, acceleration, or force. A free body diagram is specifically a force diagram showing all forces acting on one object.
When should I use vector components?
Use components when vectors are angled, when there are multiple vectors, or when you need a more accurate answer than a ruler-and-protractor scale drawing can provide.
What does head-to-tail mean in vector diagrams?
Head-to-tail means the tail of each new vector is placed at the arrow head of the previous vector. The resultant then connects the first tail to the final head.
Can vectors be moved in a diagram?
Yes, for vector addition you can move a vector parallel to itself without changing its magnitude or direction. Do not rotate it or change its length unless the physics problem says the vector changed.
How do you find the magnitude of a resultant vector?
If the components are perpendicular, use the Pythagorean theorem: R = sqrt(Rx^2 + Ry^2). If using a scale drawing, measure the resultant length and convert using the scale.
Why do students get vector diagrams wrong?
Common errors include adding magnitudes like scalars, forgetting direction, using the wrong angle for sine and cosine, leaving vectors tail-to-tail when using head-to-tail addition, and omitting units or scale.
Create Physics Diagrams Faster
For homework notes, drawing by hand is fine. For worksheets, slides, blog posts, or classroom handouts, a clean digital diagram is usually easier to read. Start with a prompt like:
Create a vector diagram showing a 6 N force to the right, an 8 N force upward from its head, and the resultant vector from the starting point to the final point. Label the forces and show the right triangle.Then check the output against the physics: direction, length, labels, units, scale, and resultant placement. A good vector diagram should make the solution easier to see, not harder.
Related Guides
- Ray Diagram: Lenses and Mirrors Explained — another essential physics diagram, this one tracing how light bends through lenses and reflects off mirrors.
分類
更多文章
")
15 Illustration and Infographic Design Styles Explained (2026)
Explore 15 illustration and infographic design styles with examples: flat, isometric, 3D, hand-drawn, minimalist, vector, cartoon, line art and more.
")
How to Create Scatter Plots in Excel: Step-by-Step Guide (2026)
Learn how to make scatter plots in Excel with trend lines, labels, and formatting. Complete guide with screenshots and tips for research data visualization.

Best AI Scientific Illustration Tools in 2026: Complete Guide
Compare the best AI-powered scientific illustration tools for researchers in 2026. From BioRender to ConceptViz, find the right tool for publication-quality scientific figures.