部落格
教學提示、工具比較和STEM教育工作者的科學圖表指南。用AI驅動的圖表生成建立更好的課堂材料。

AI Conceptual Framework for Thesis: Prompts, Examples, and Chapter 1 Workflow
Create an AI conceptual framework for thesis work with prompts, examples, variable tables, Chapter 1 writing tips, and validation checks.
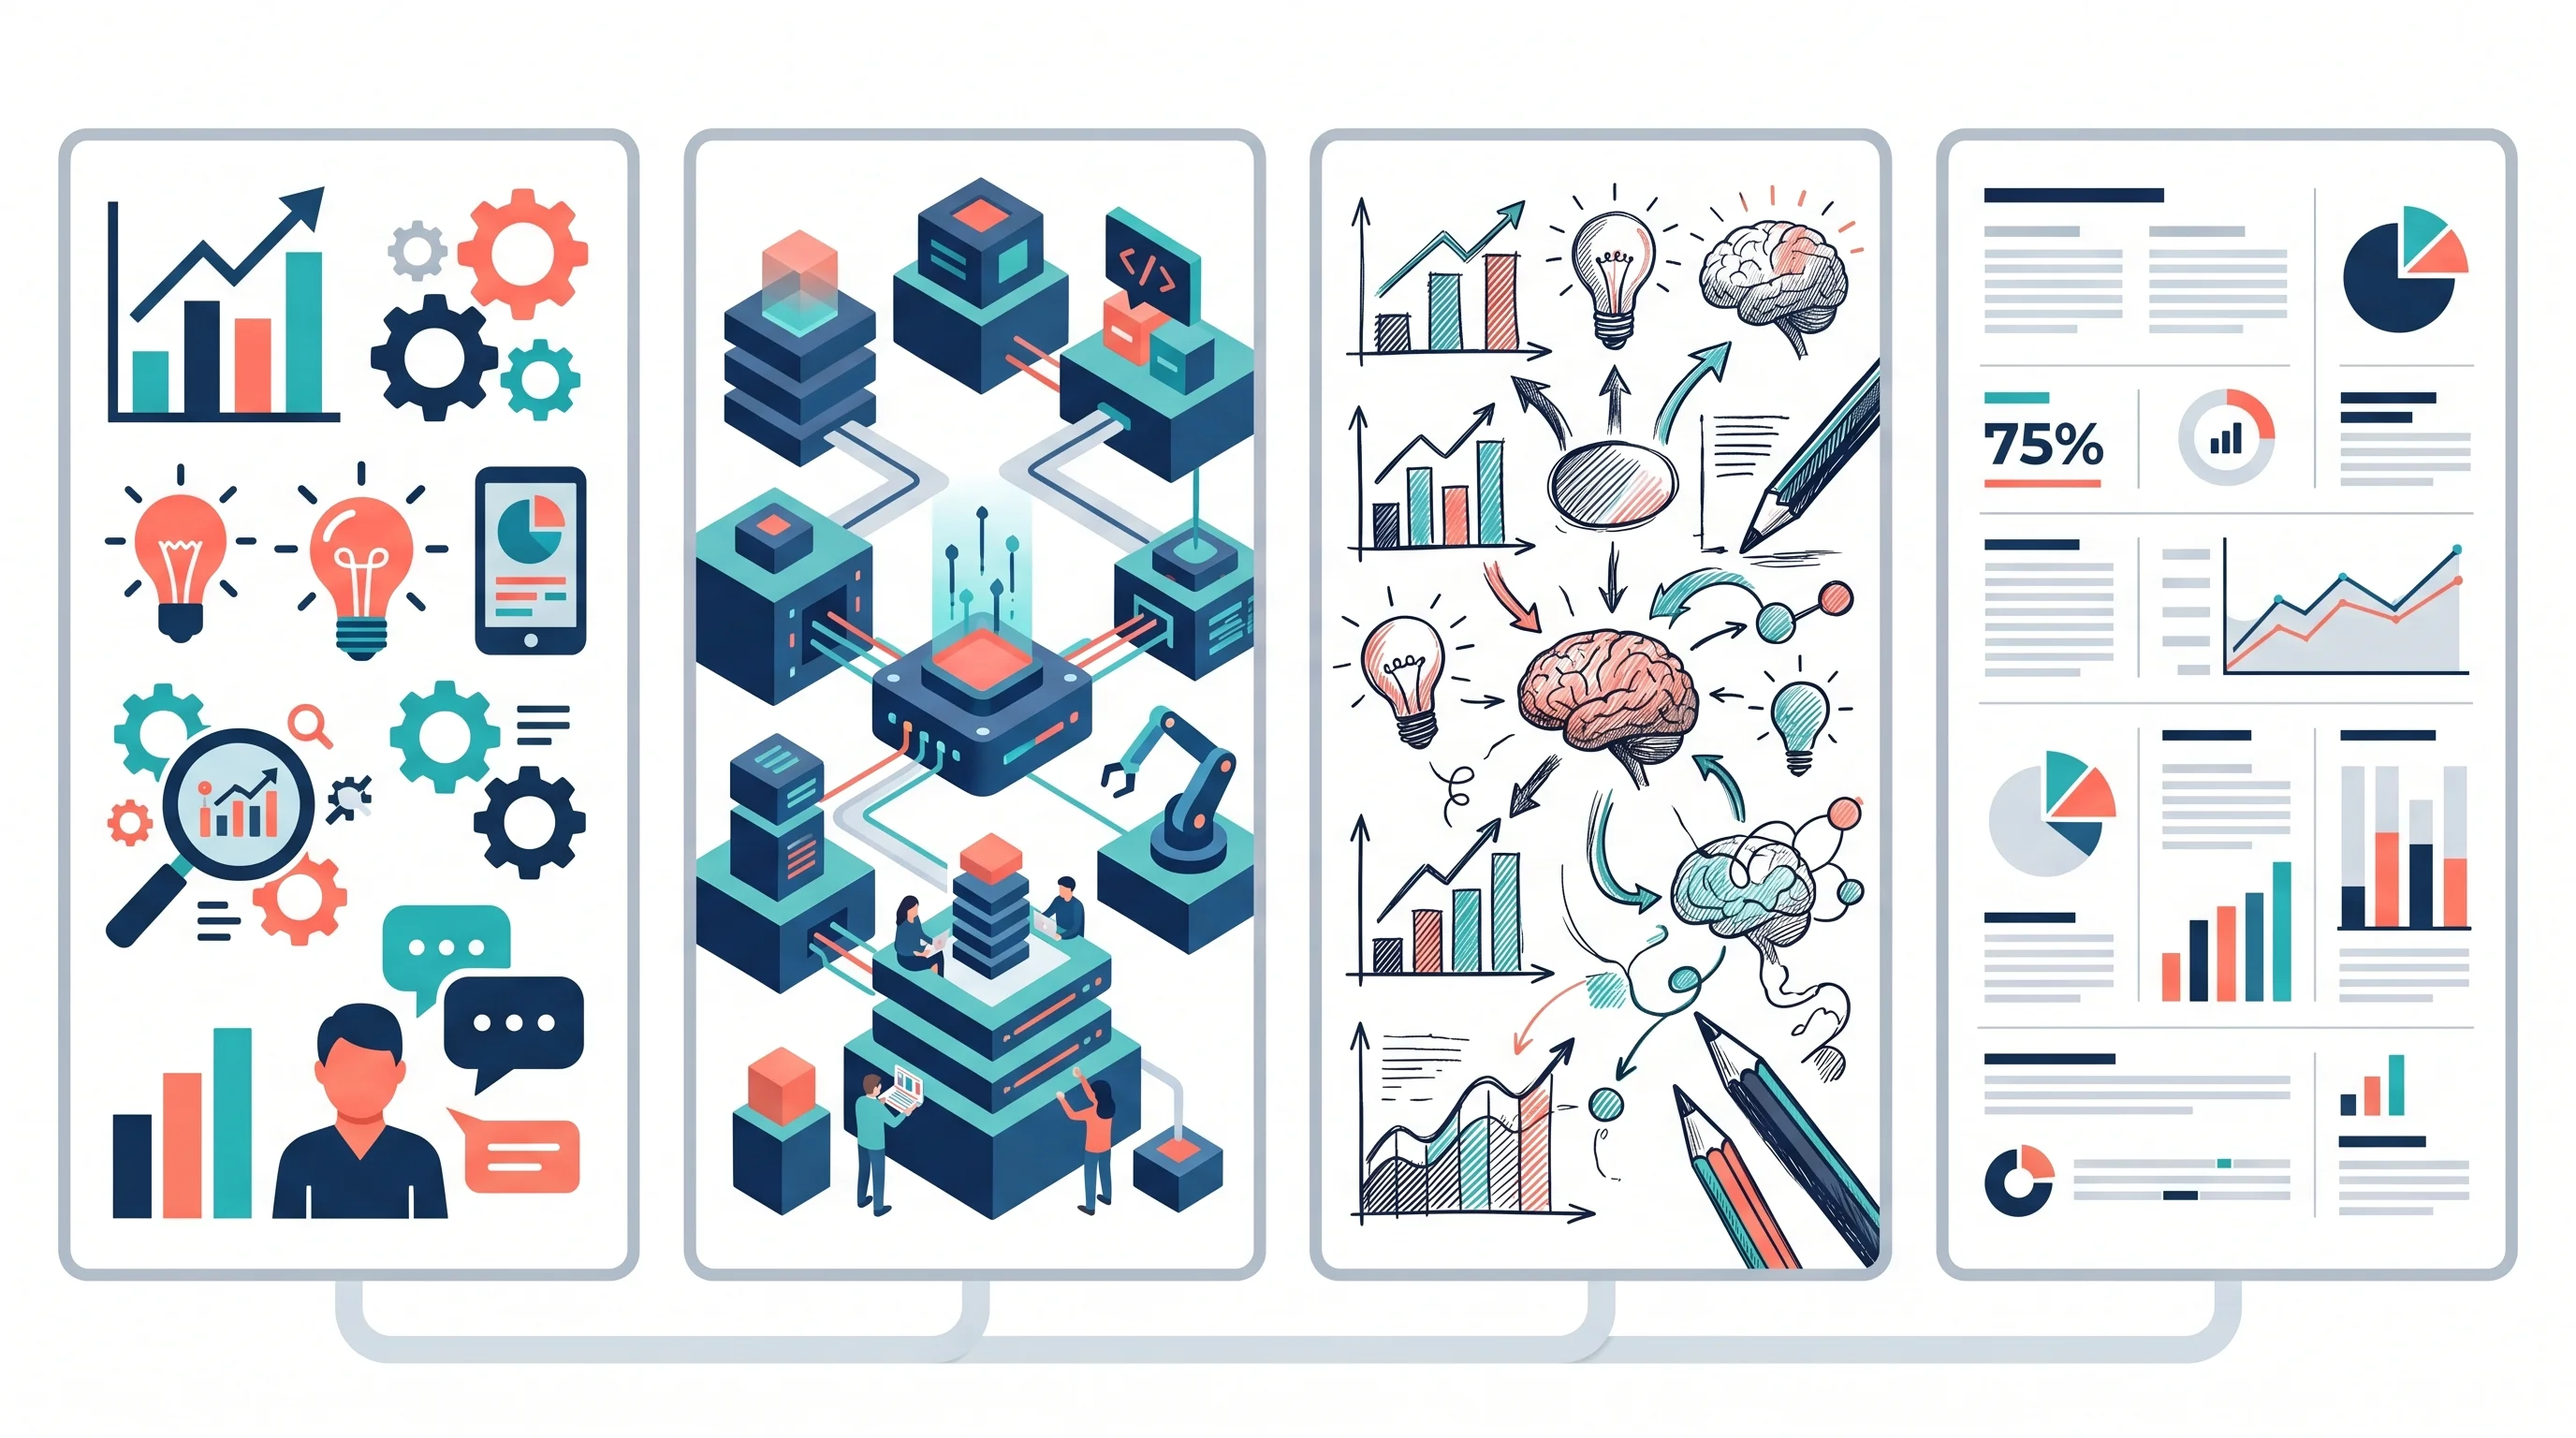
Infographic Design Styles & Trends: Flat, Isometric, Hand-Drawn and Minimalist
Compare infographic design styles and trends: flat, isometric, hand-drawn, minimalist, 3D and editorial layouts, with examples and selection rules.
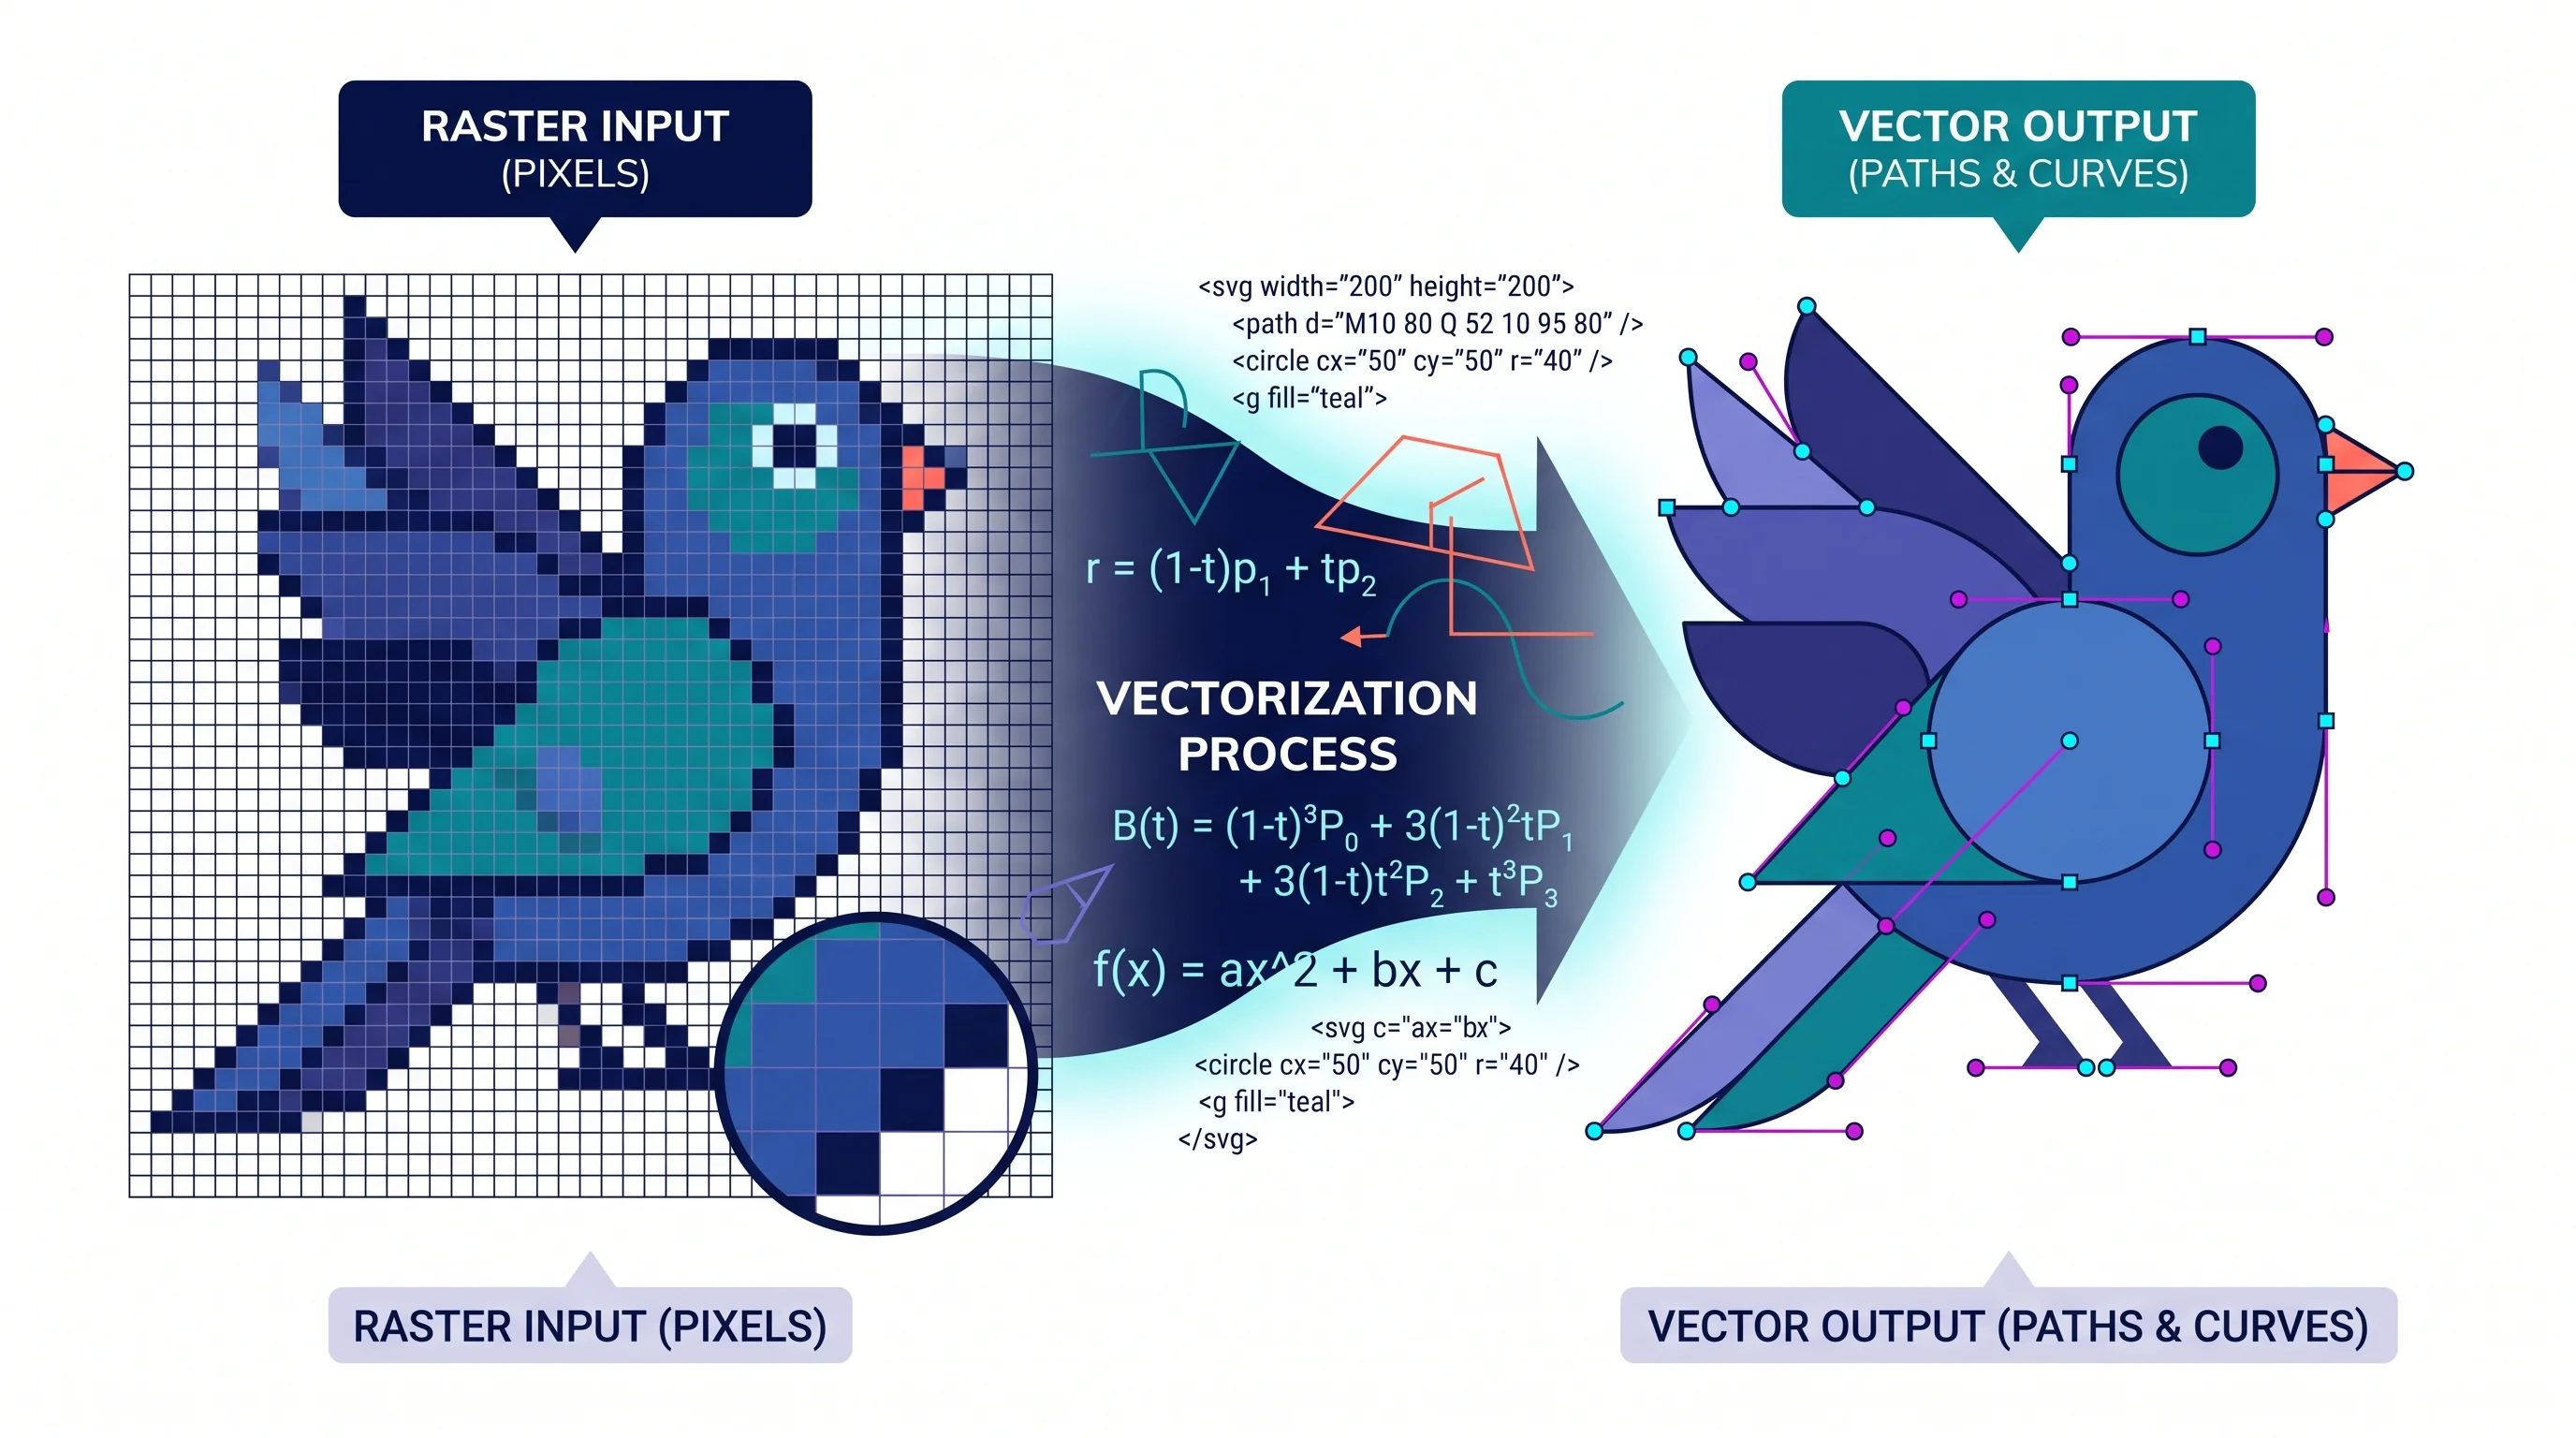
How to Create a Vector Image: A Complete Guide for Beginners and Researchers
Learn how to create vector images using Inkscape, Illustrator, and AI tools. Covers the SVG format, tracing raster images, and best practices for illustration.
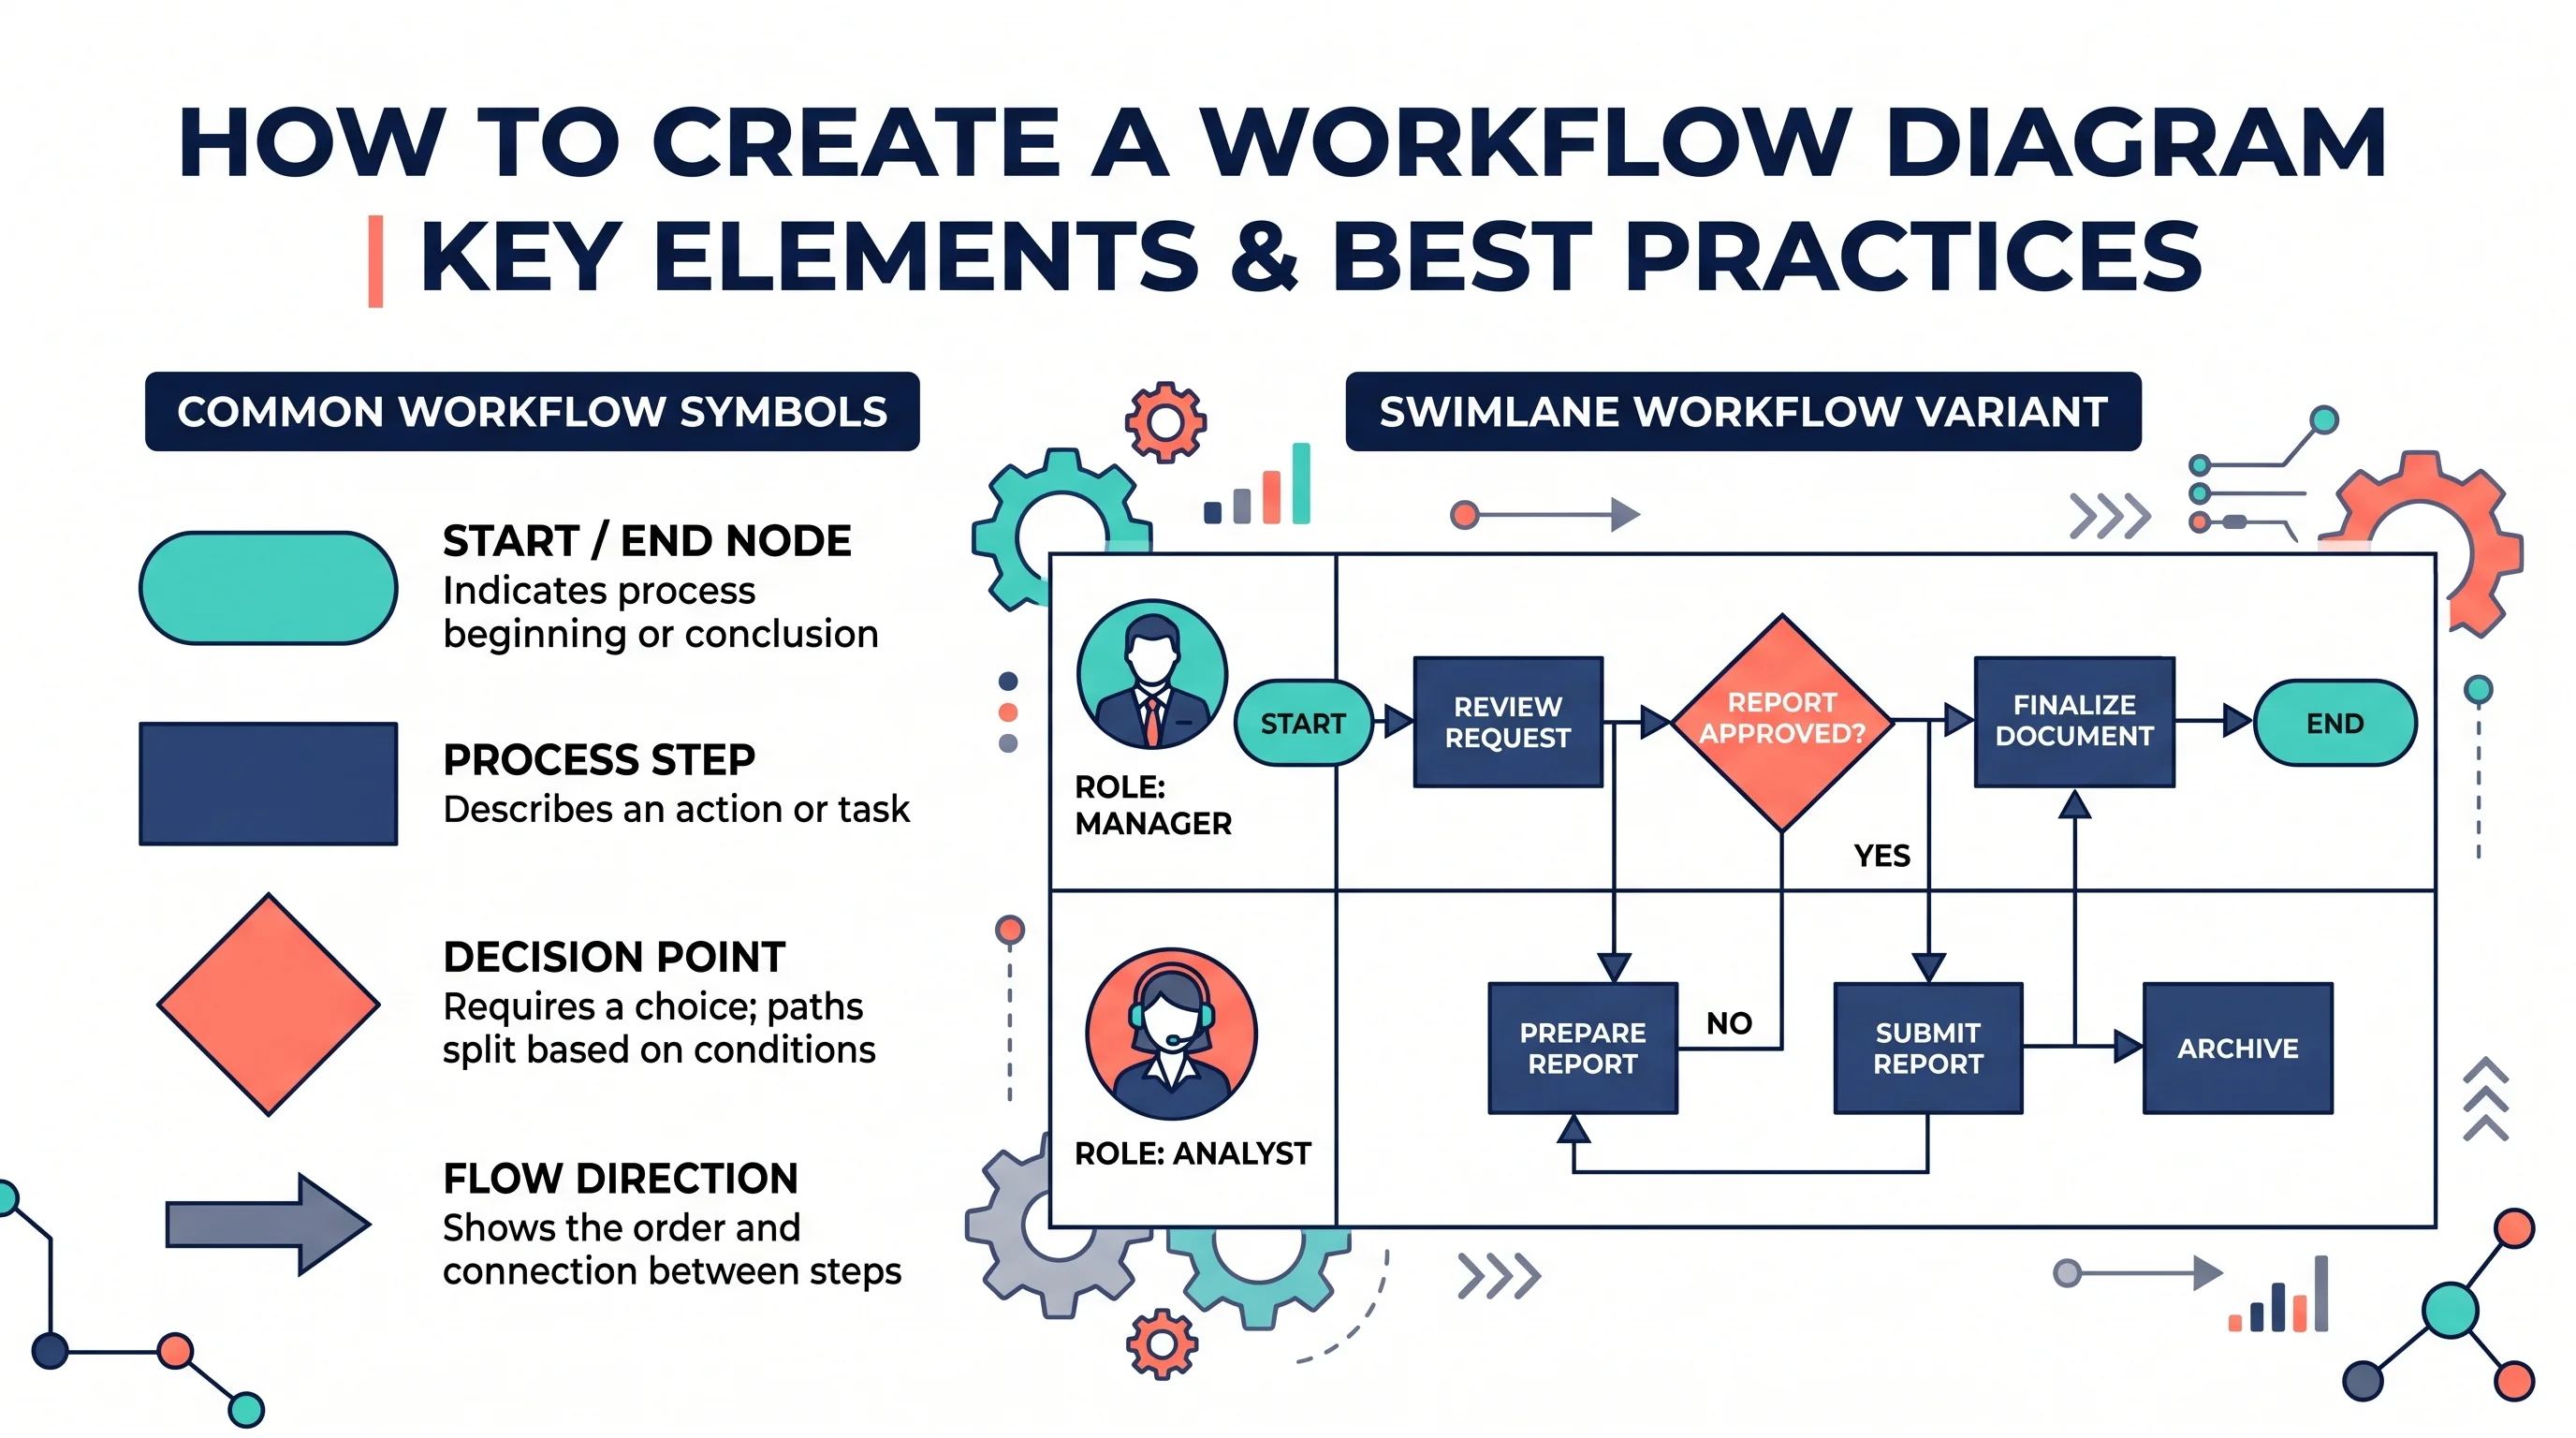
How to Create a Workflow Diagram: Step-by-Step Guide with Examples
Learn how to create a workflow diagram for research, business processes, and team projects, with symbols, types, best practices, and free tools.
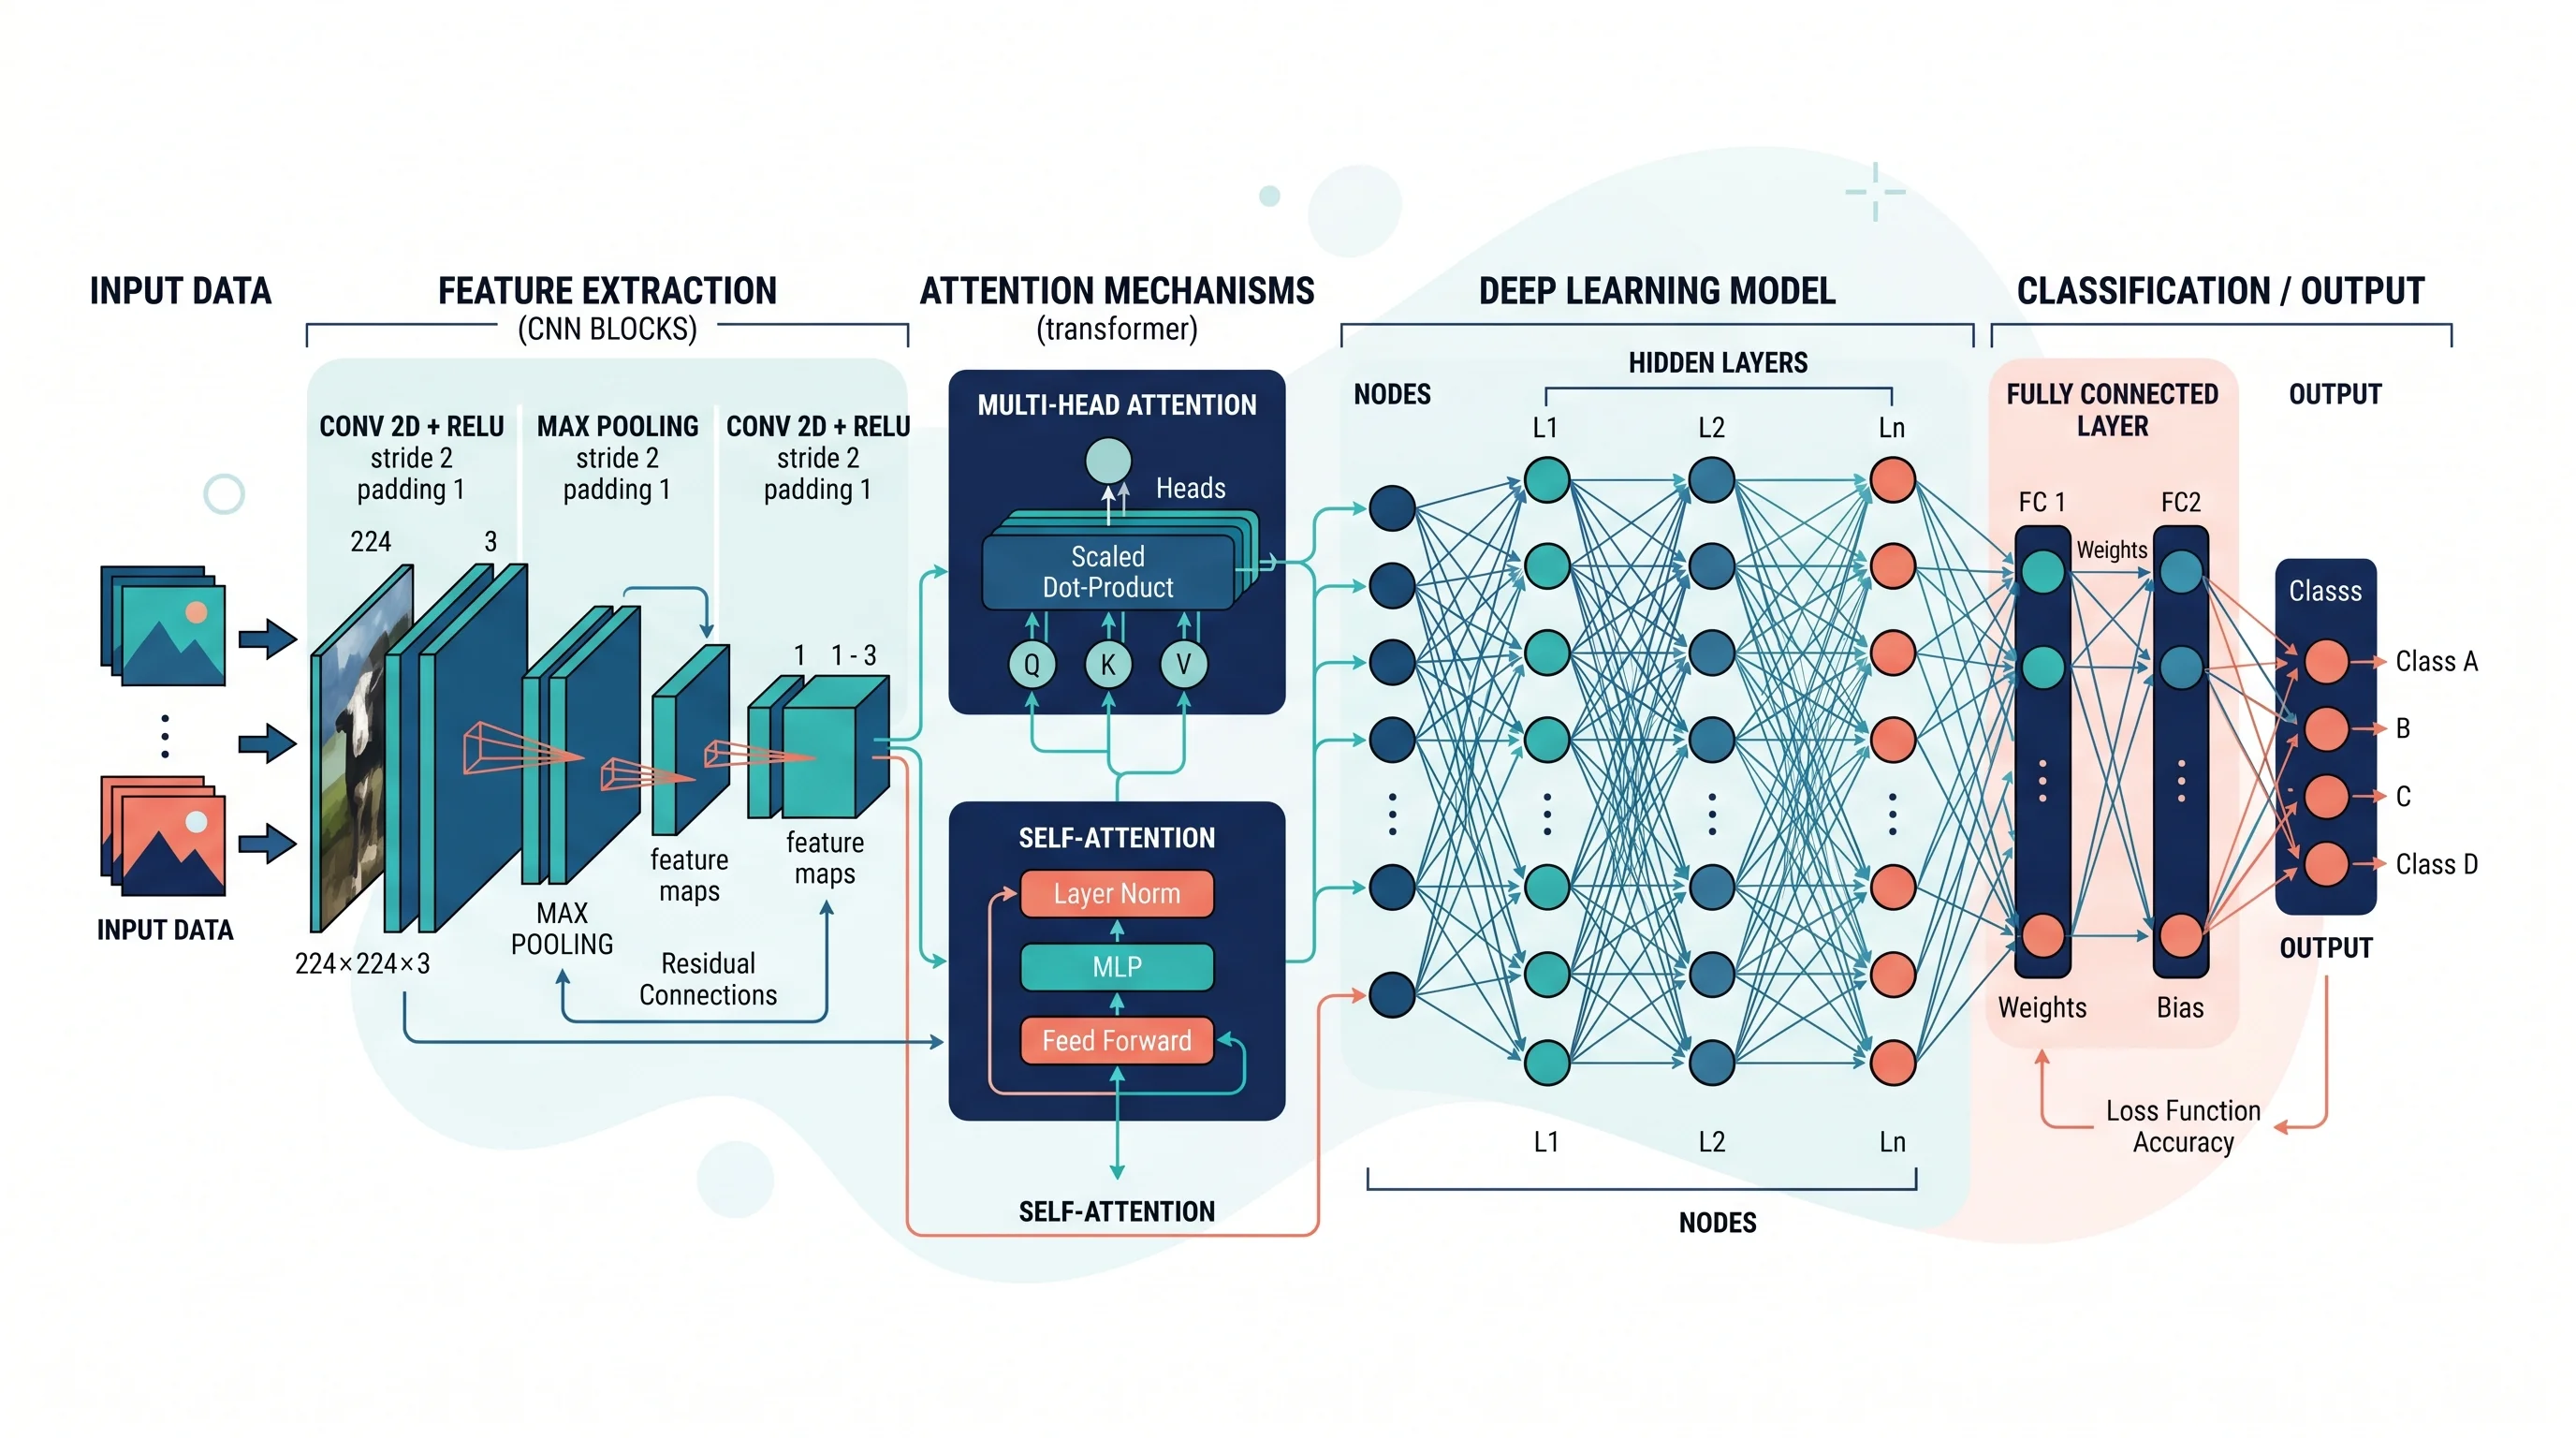
How to Draw a Neural Network Architecture Diagram: A Complete Guide
Learn how to draw neural network architecture diagrams for CNNs, RNNs, Transformers, and more. A step-by-step guide with tools, examples, and best practices.
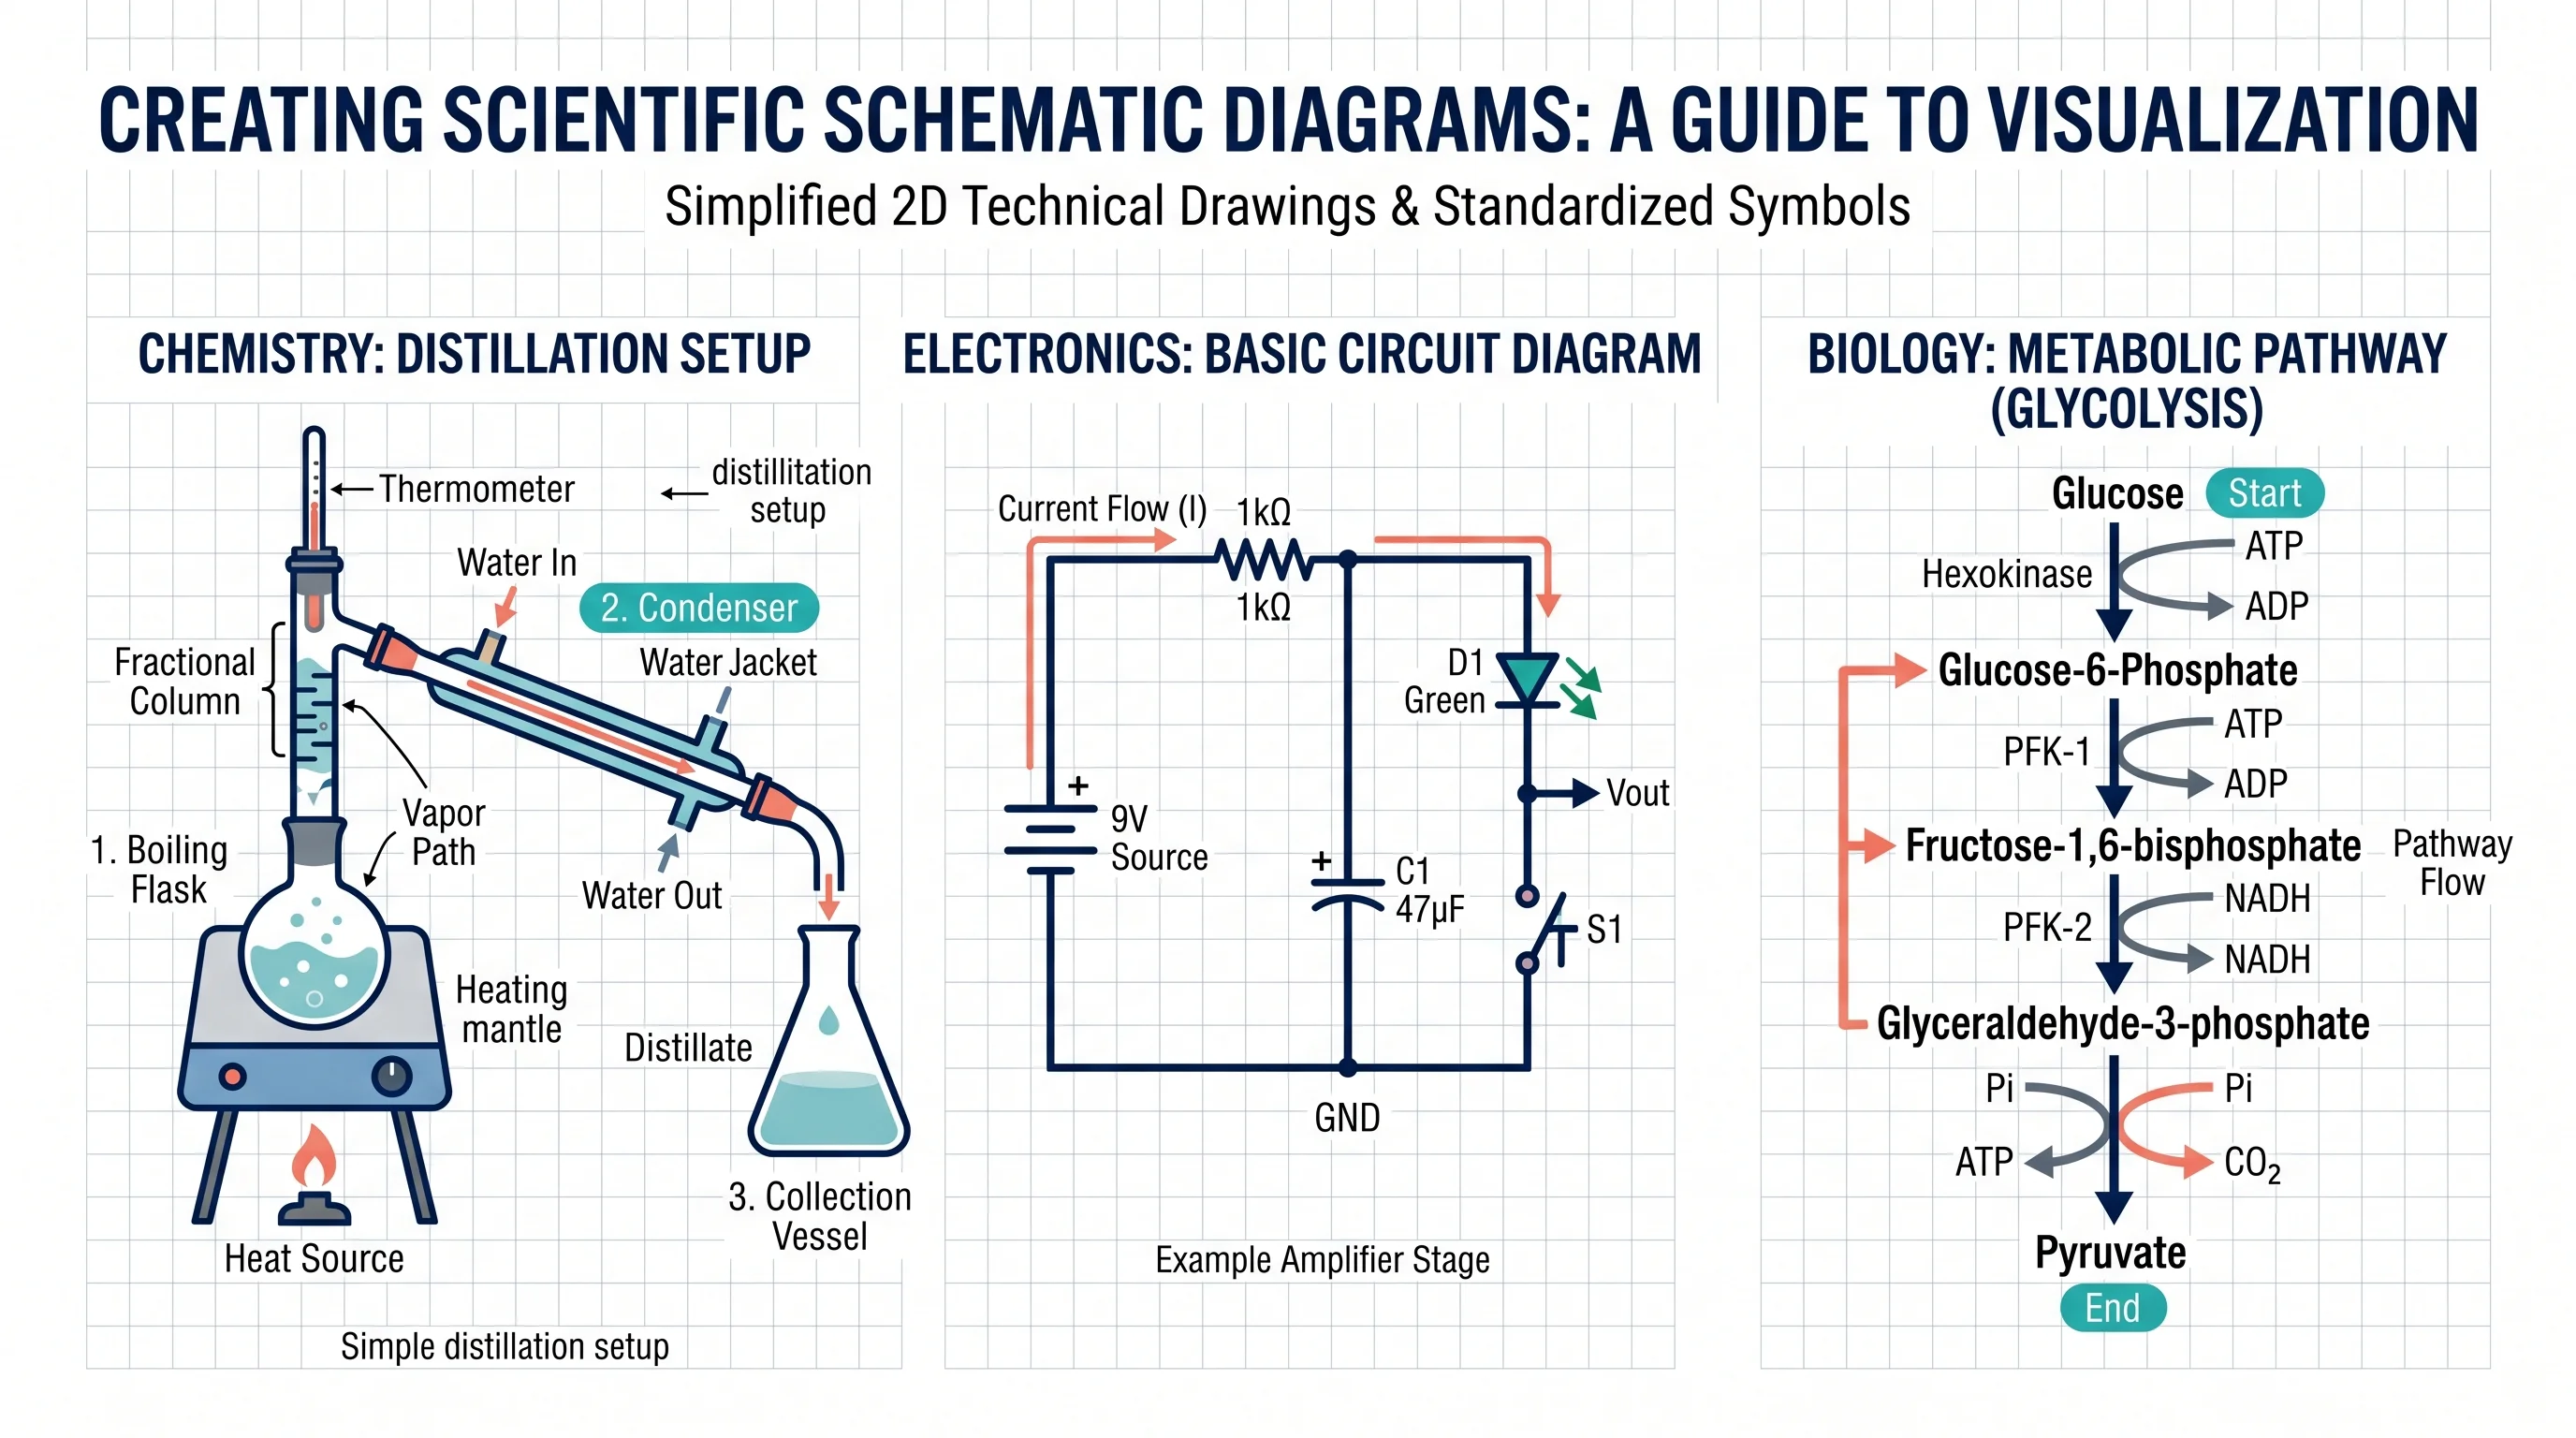
Schematic Diagram: Definition, Examples, How to Make One
What is a schematic diagram? Definition, lab and research examples, drawing rules and a step-by-step method, plus tools to make one quickly.