Rejection Region Diagram Maker for Hypothesis Tests
Create rejection region diagrams for z tests and t tests. Shade left, right, or two-tailed critical regions with alpha, critical values, and test statistic lines.
Critical region settings
Build a publication-ready hypothesis test diagram.
- Alpha
- 0.050
- Critical value
- -1.960, 1.960
Reject H0: the test statistic falls in the rejection region.
Critical values: -1.960 and 1.960; shaded red area is the rejection region.
Best for
Hypothesis test reports
Supports
Left, right, and two tails
Output
Editable SVG diagram
Rejection Region Examples
Browse hypothesis testing visuals for reports, slides, and teaching materials
Two-Tailed Z Test Rejection Region
A standard normal curve with alpha split into both tails and critical values at -1.96 and 1.96.
Right-Tailed Critical Region
A right-tailed hypothesis test diagram for showing whether a positive test statistic exceeds the critical value.
Left-Tailed T Test Diagram
A Student t distribution diagram for left-tailed tests, class notes, and methods sections.
Quality Control Hypothesis Test
A rejection region diagram for quality control reports where an observed statistic is compared with a threshold.
Psychology Statistics Critical Region
A psychology statistics example showing a critical region on a bell curve for classroom explanation.
Classroom Hypothesis Test Visual
A teaching visual that makes alpha, critical value, and decision rule easy to explain.
What is a rejection region diagram?
A rejection region diagram shows the sampling distribution under the null hypothesis, the significance level, and the critical value boundary where the null hypothesis would be rejected. It is commonly used in statistics homework, research methods sections, lab reports, and classroom slides.
When should you use this tool?
- Use a right-tailed diagram when the alternative hypothesis tests whether a value is greater than the null value.
- Use a left-tailed diagram when the alternative hypothesis tests whether a value is smaller than the null value.
- Use a two-tailed diagram when the alternative hypothesis tests whether a value is different in either direction.
- Use the t distribution when the population standard deviation is unknown and your test uses degrees of freedom.
How the calculator builds the chart
Choose a z test or t test, set alpha, select the tail direction, and optionally enter a test statistic. The tool calculates the critical value, shades the rejection region, and places the observed statistic on the same distribution so the decision rule is visible.
How to read the diagram
If the test statistic falls inside the red shaded region, reject H0 at the selected alpha level. If it stays outside the shaded region, fail to reject H0. For two-tailed tests, alpha is split equally between the left and right tails.
Limits and statistical notes
The t critical values use a standard approximation that is accurate for typical classroom and reporting diagrams. For high-stakes statistical decisions, verify final values with your statistics software or course-approved calculator.
Часто задаваемые вопросы
Related Statistics Tools
 Research
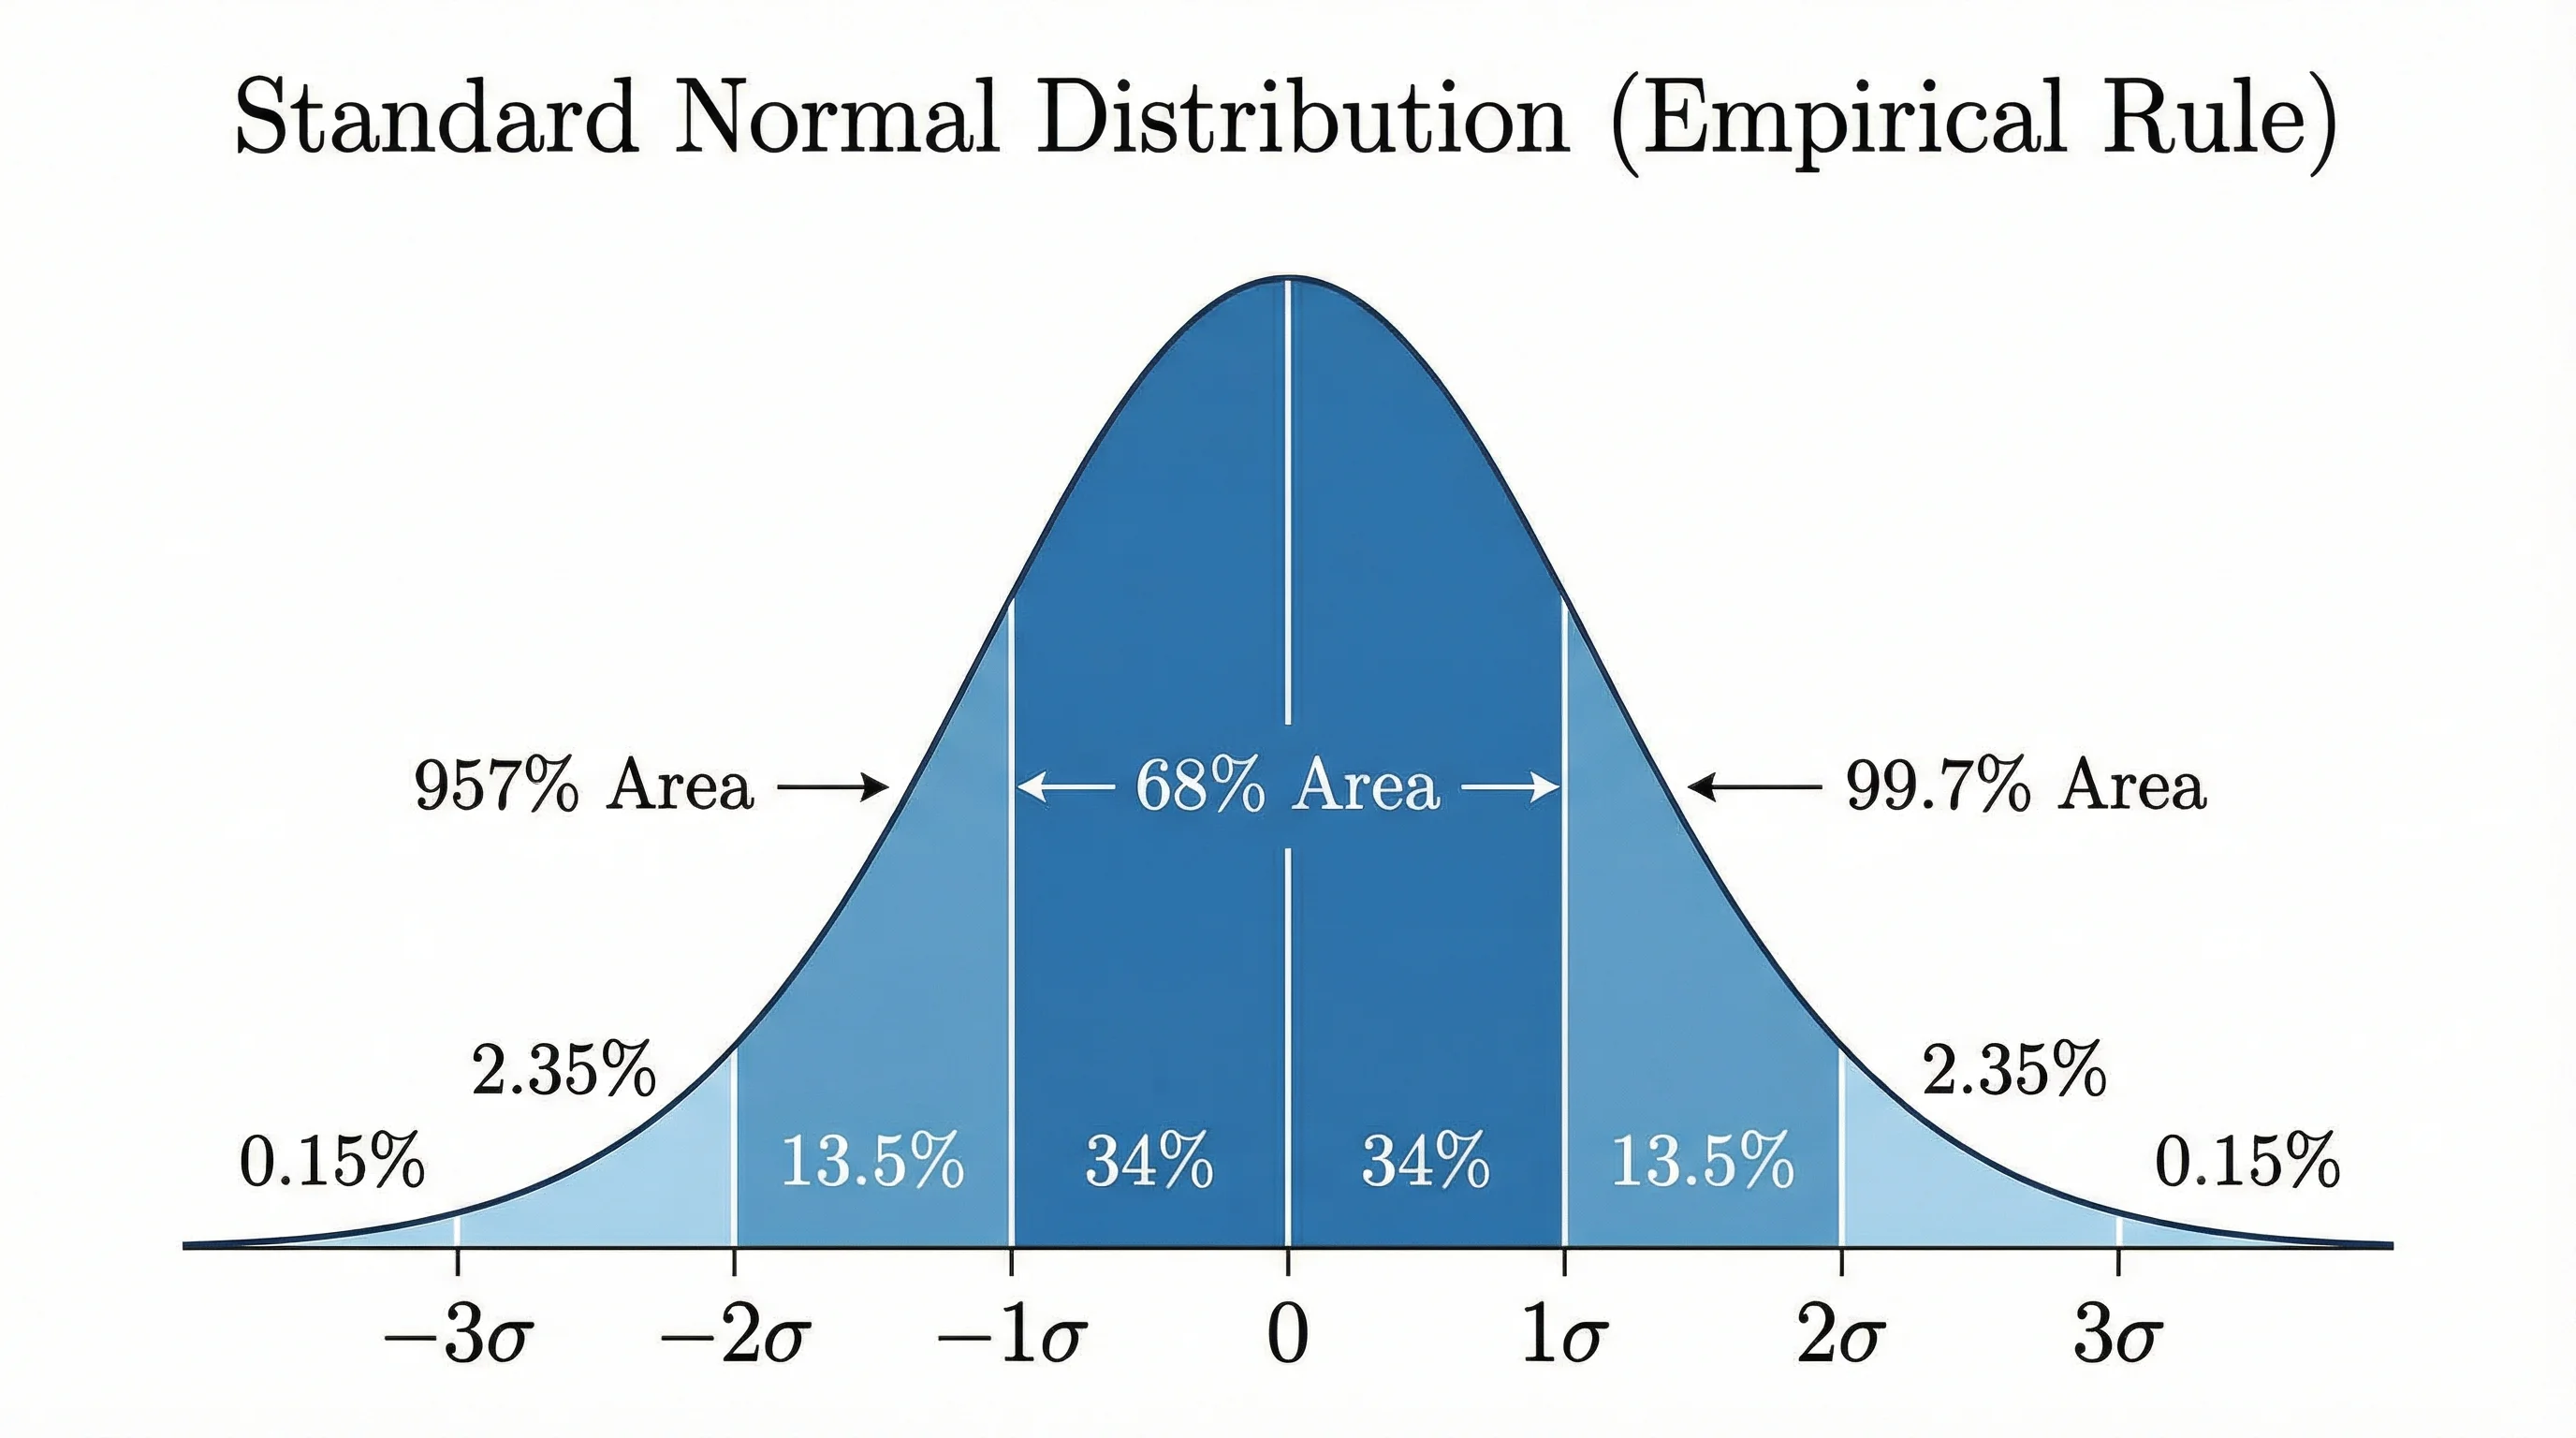
Bell Curve Generator
Create normal distribution and bell curve visuals for statistics reports and classroom explanations.
 Research
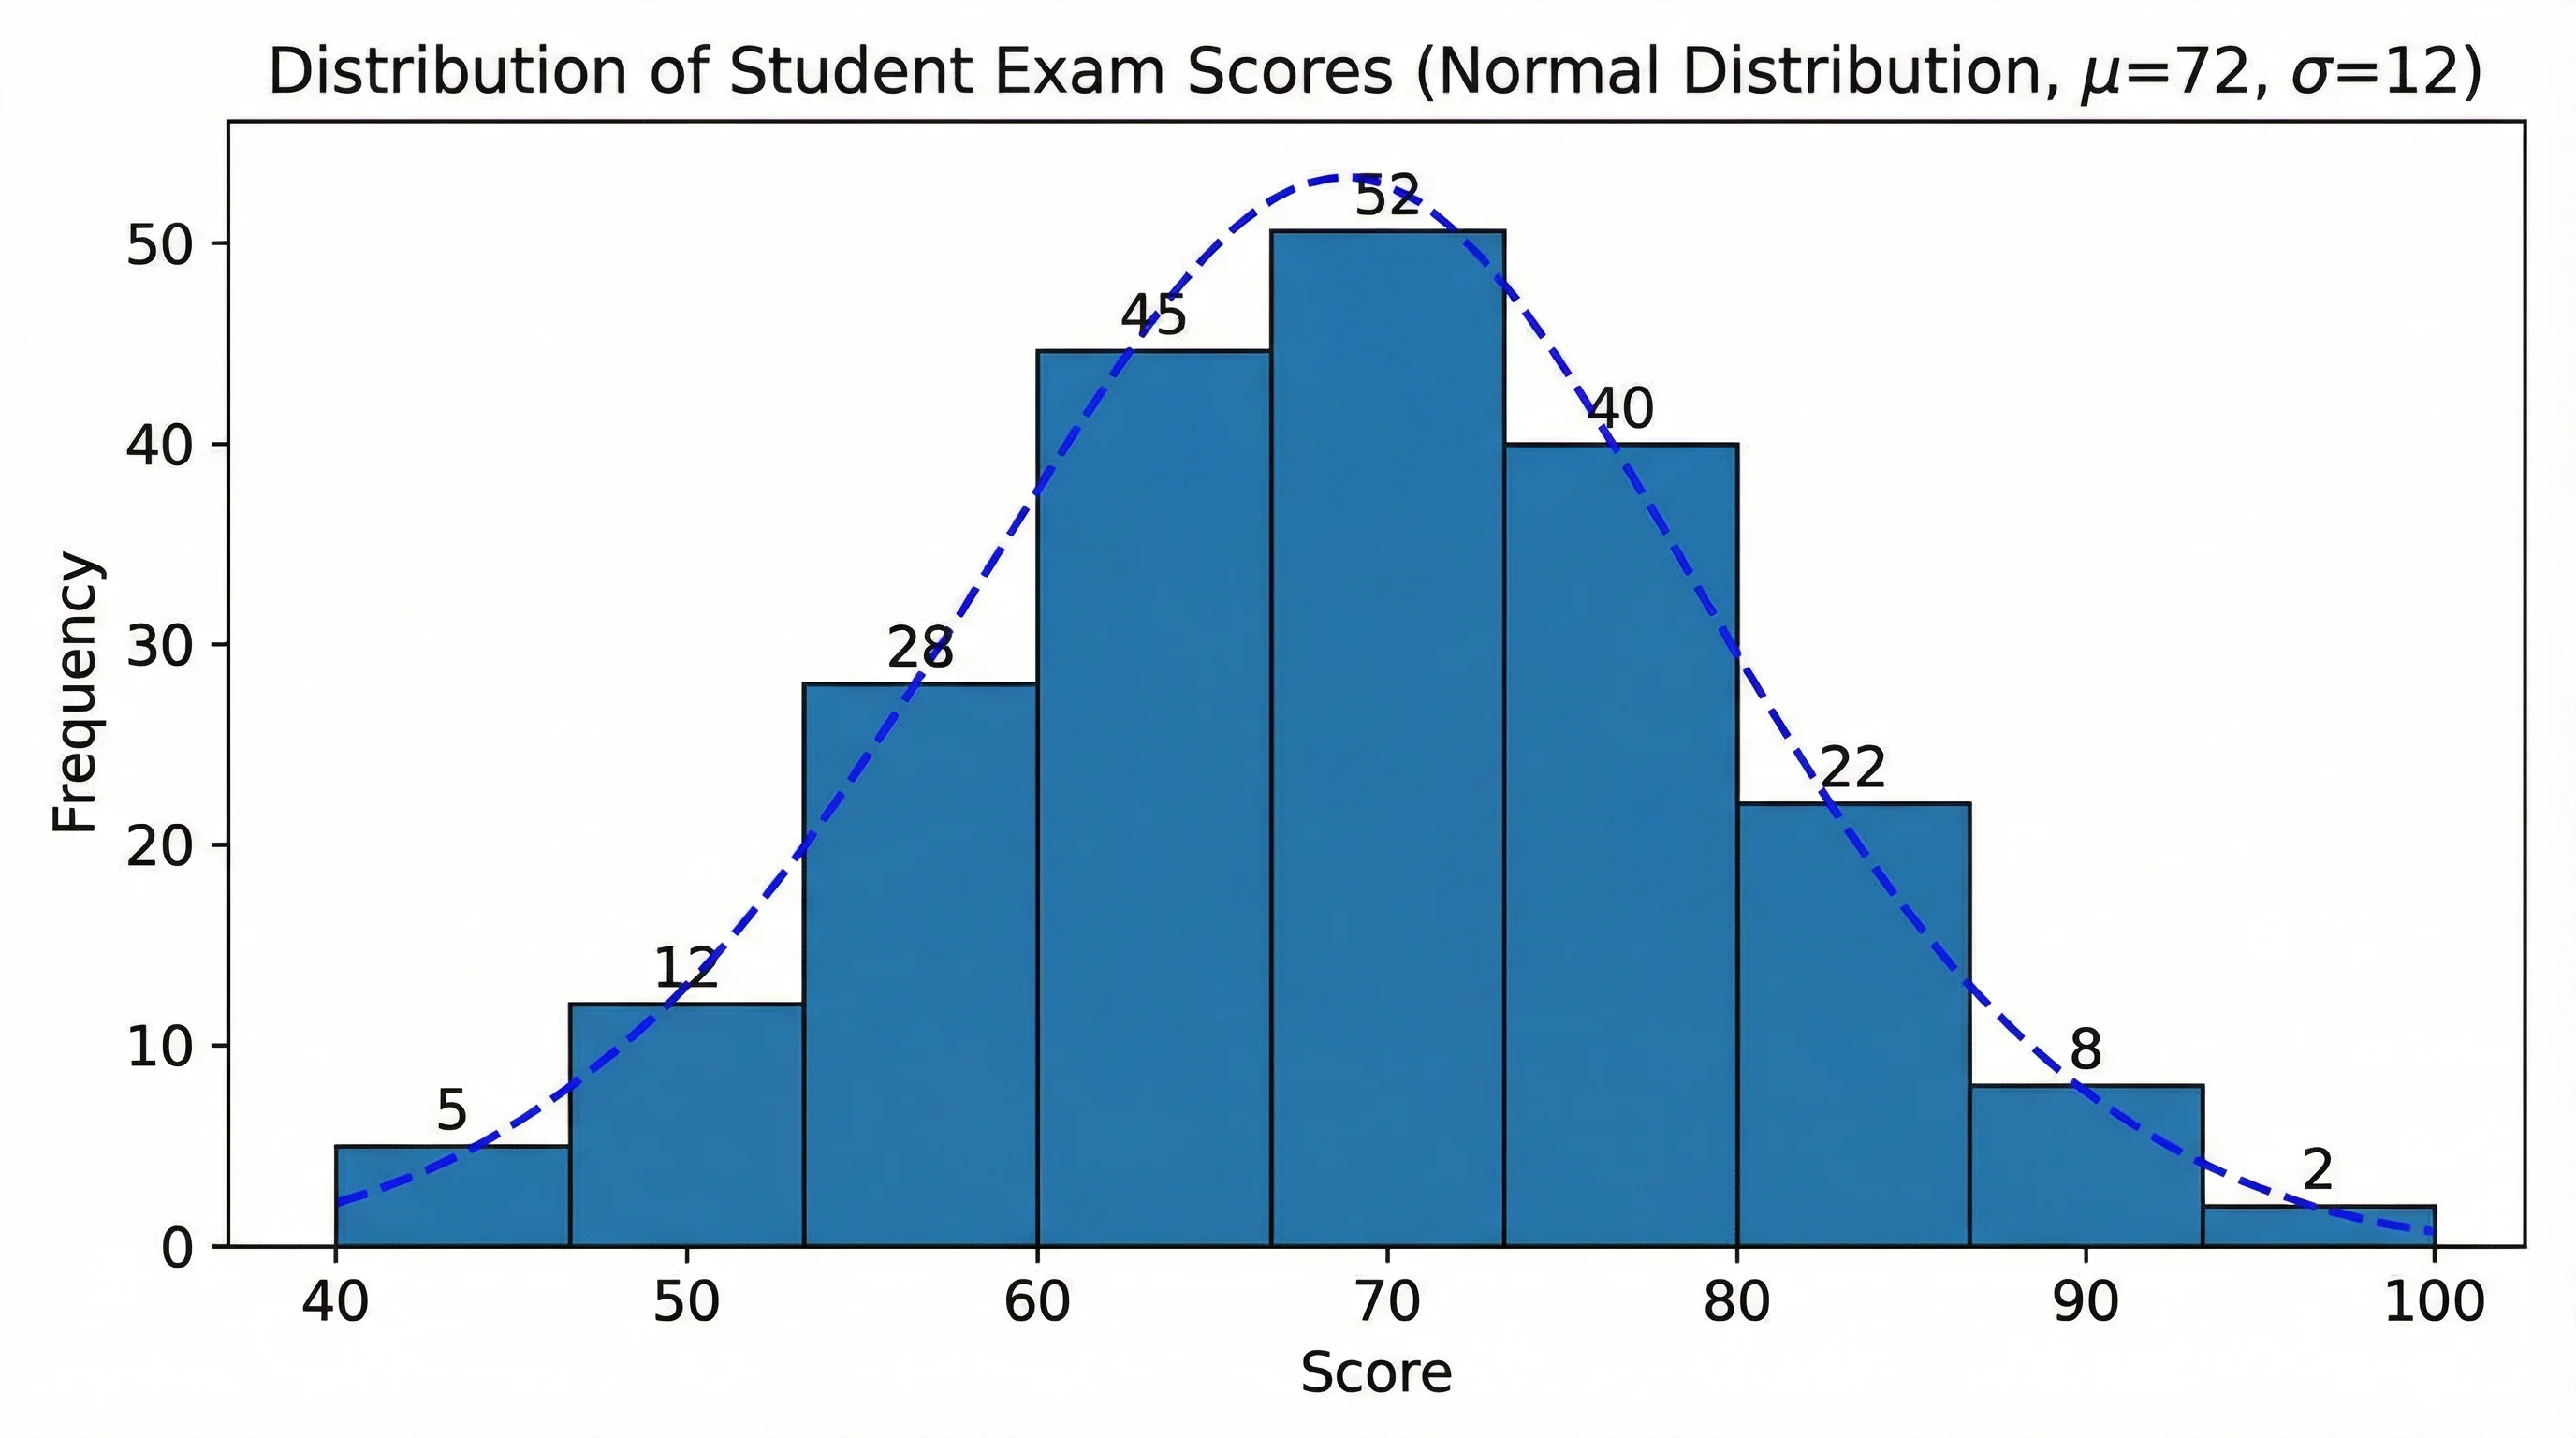
AI Histogram Maker
Create histograms and frequency distribution charts for statistics, STEM, and data analysis.
 Research
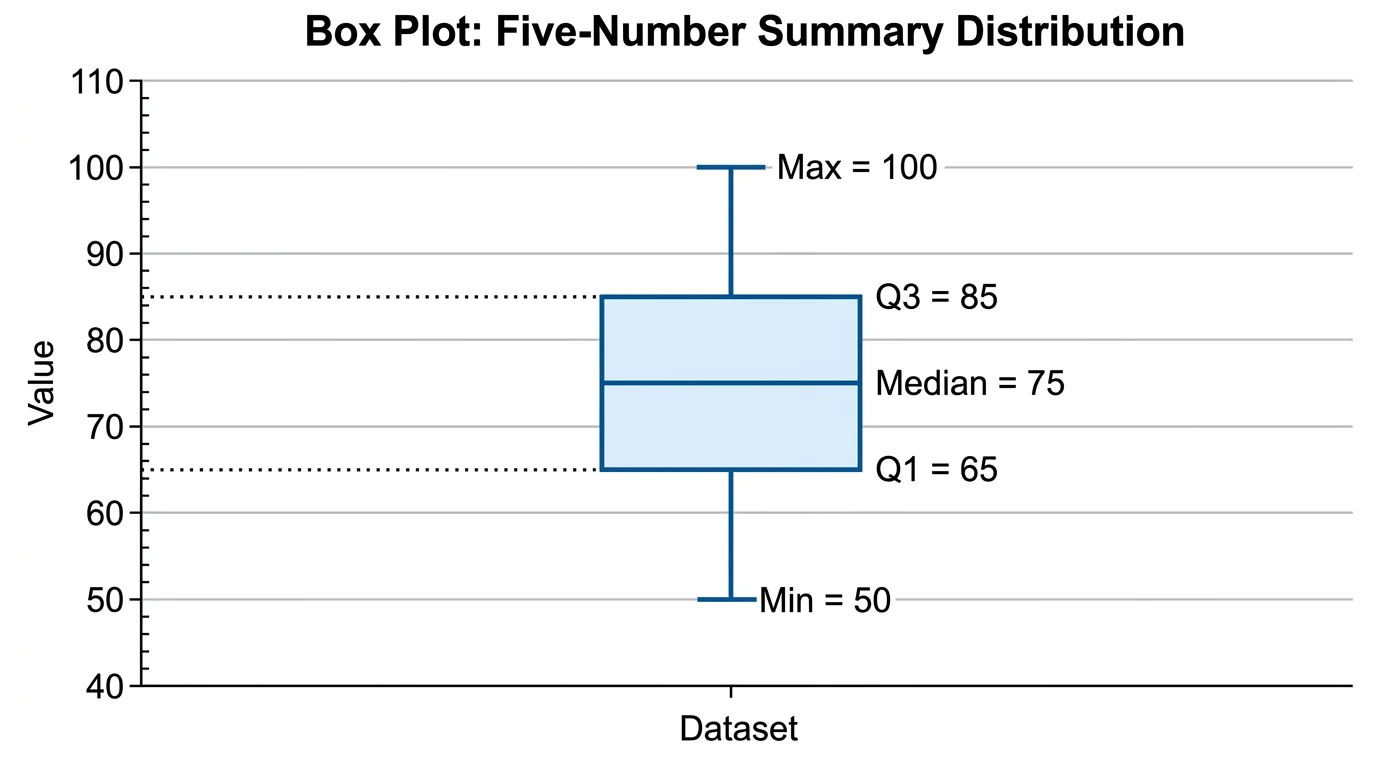
Box Plot Generator
Create box plots and box-and-whisker diagrams with quartiles, spread, and outliers.