Блог
Советы преподавателям, сравнение инструментов и руководства по научным диаграммам для преподавателей STEM. Создавайте лучшие учебные материалы с помощью ИИ.
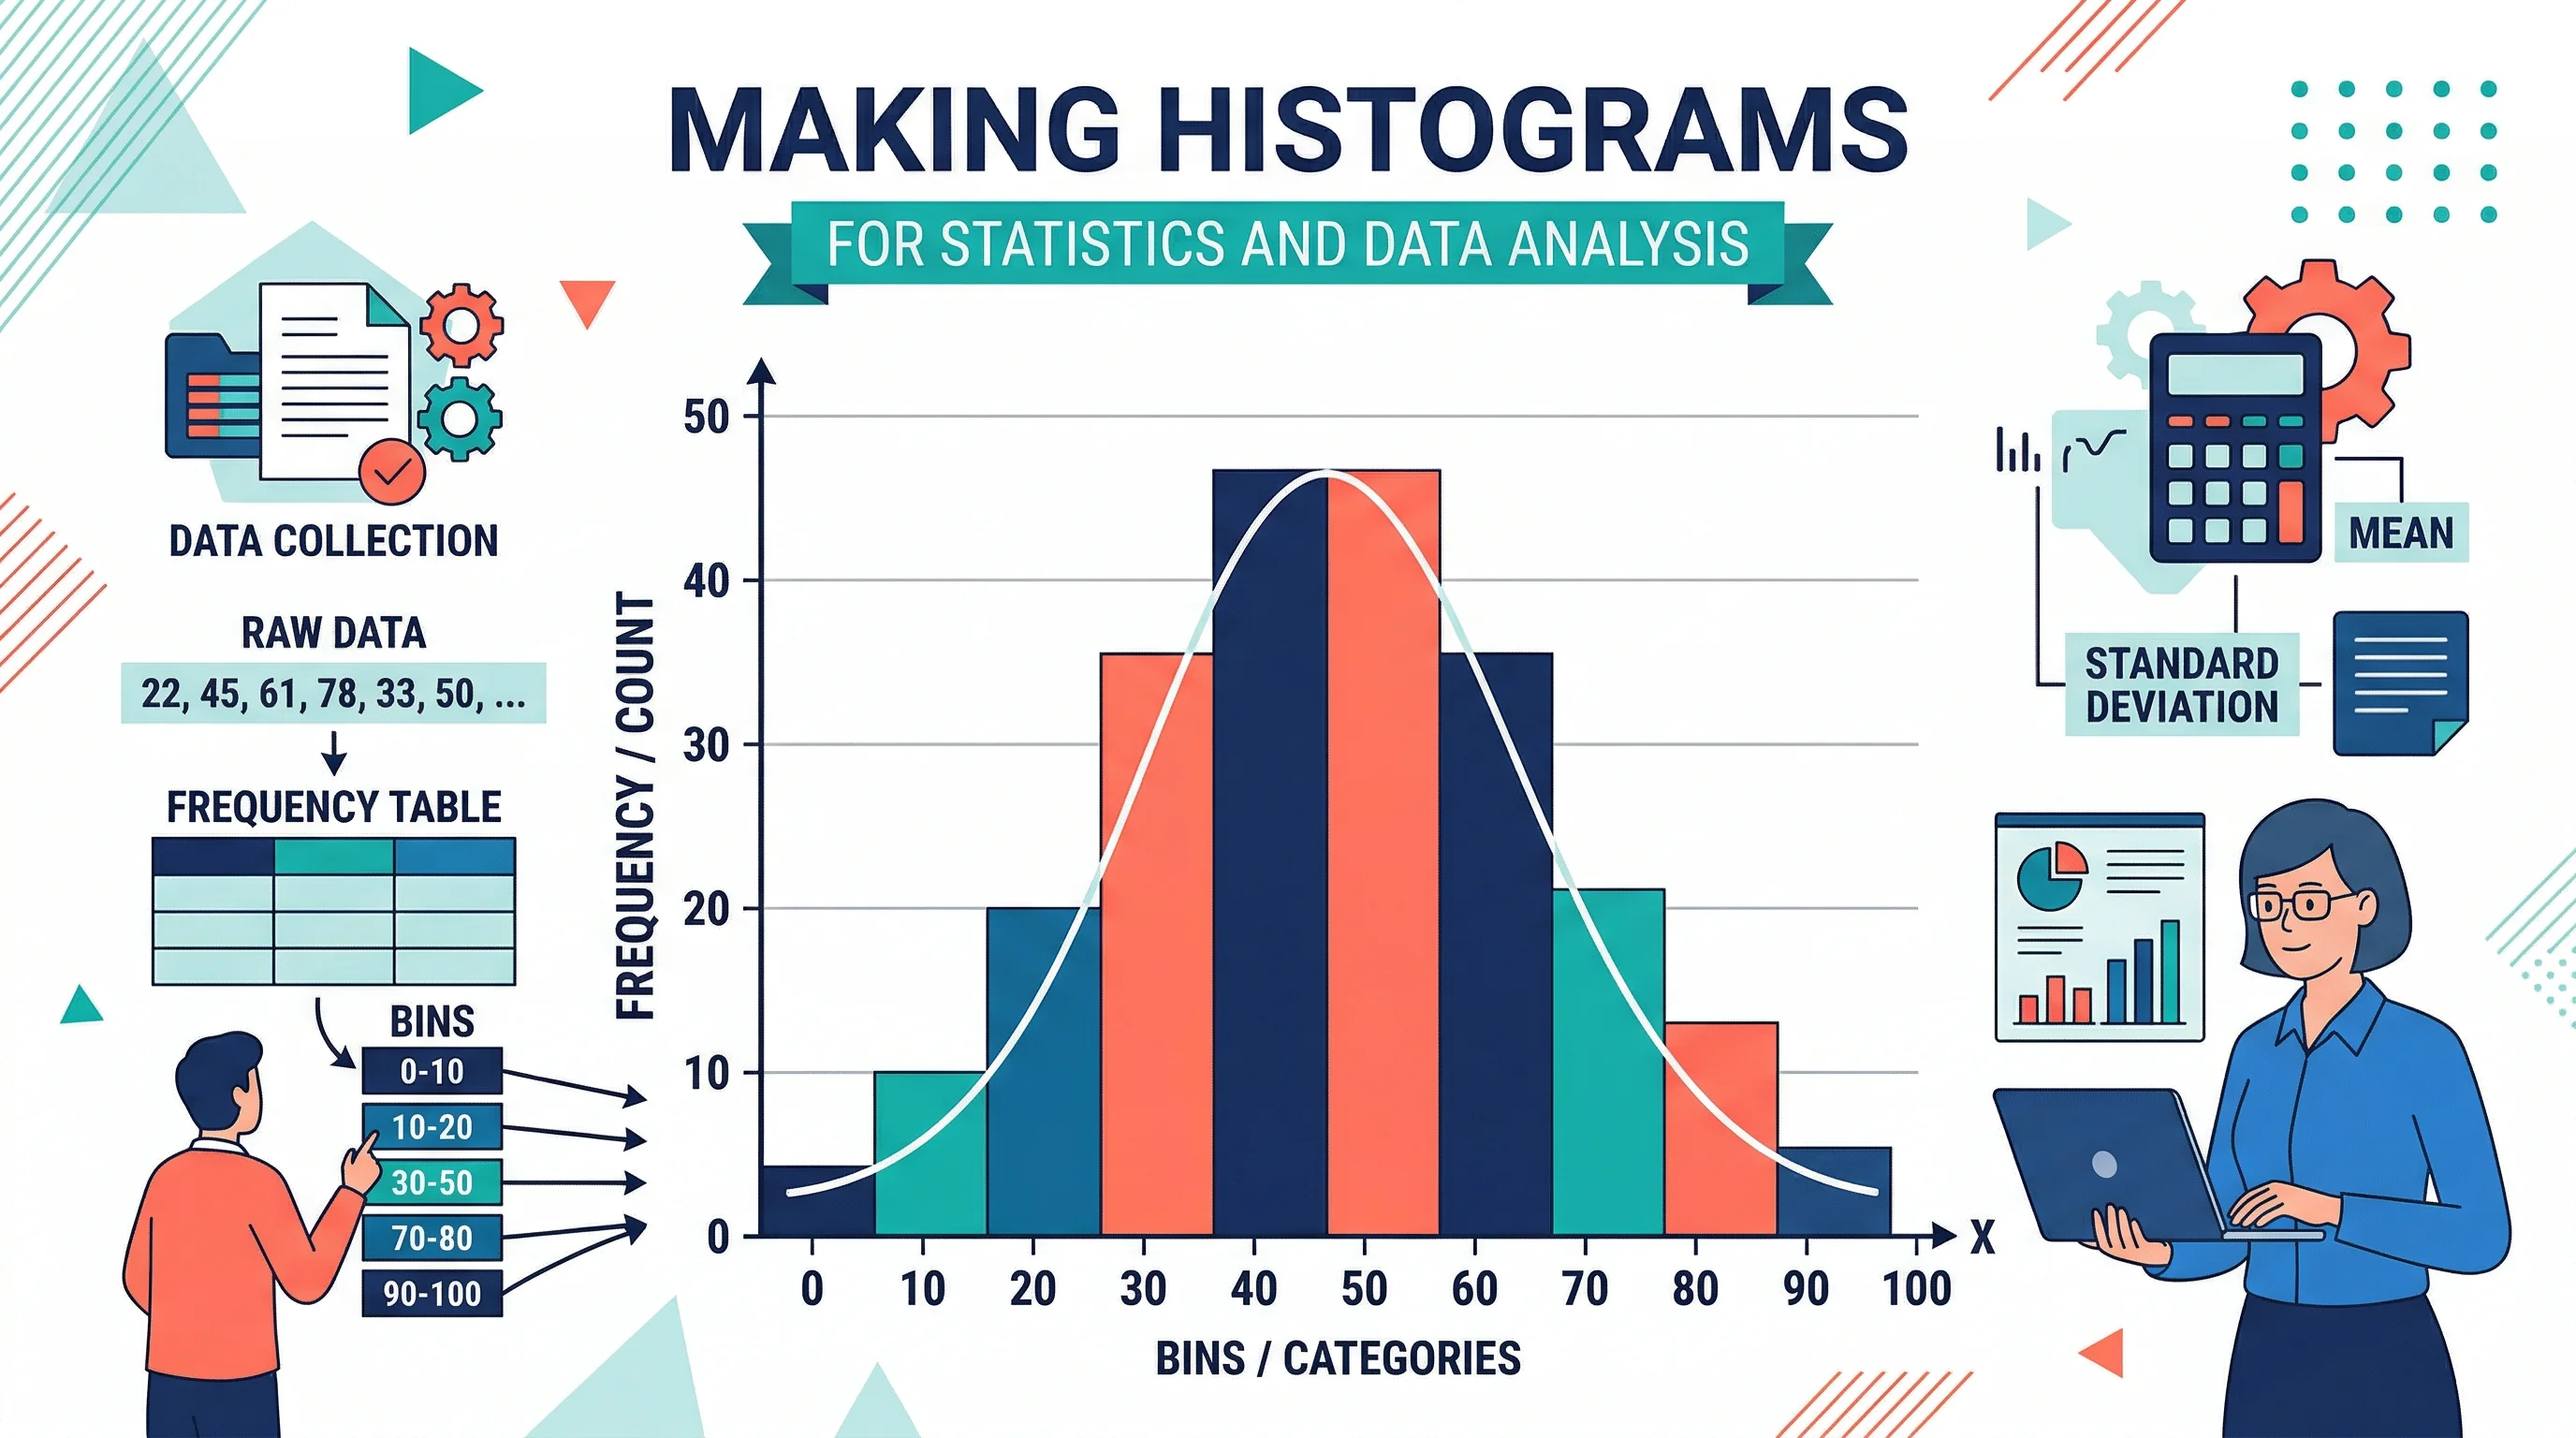
How to Make a Histogram: Step-by-Step Guide for Students and Researchers (2026)
Learn how to make a histogram by hand, in Excel, in Google Sheets, and in Python, with binning tips, common mistakes, and examples for statistics and research.
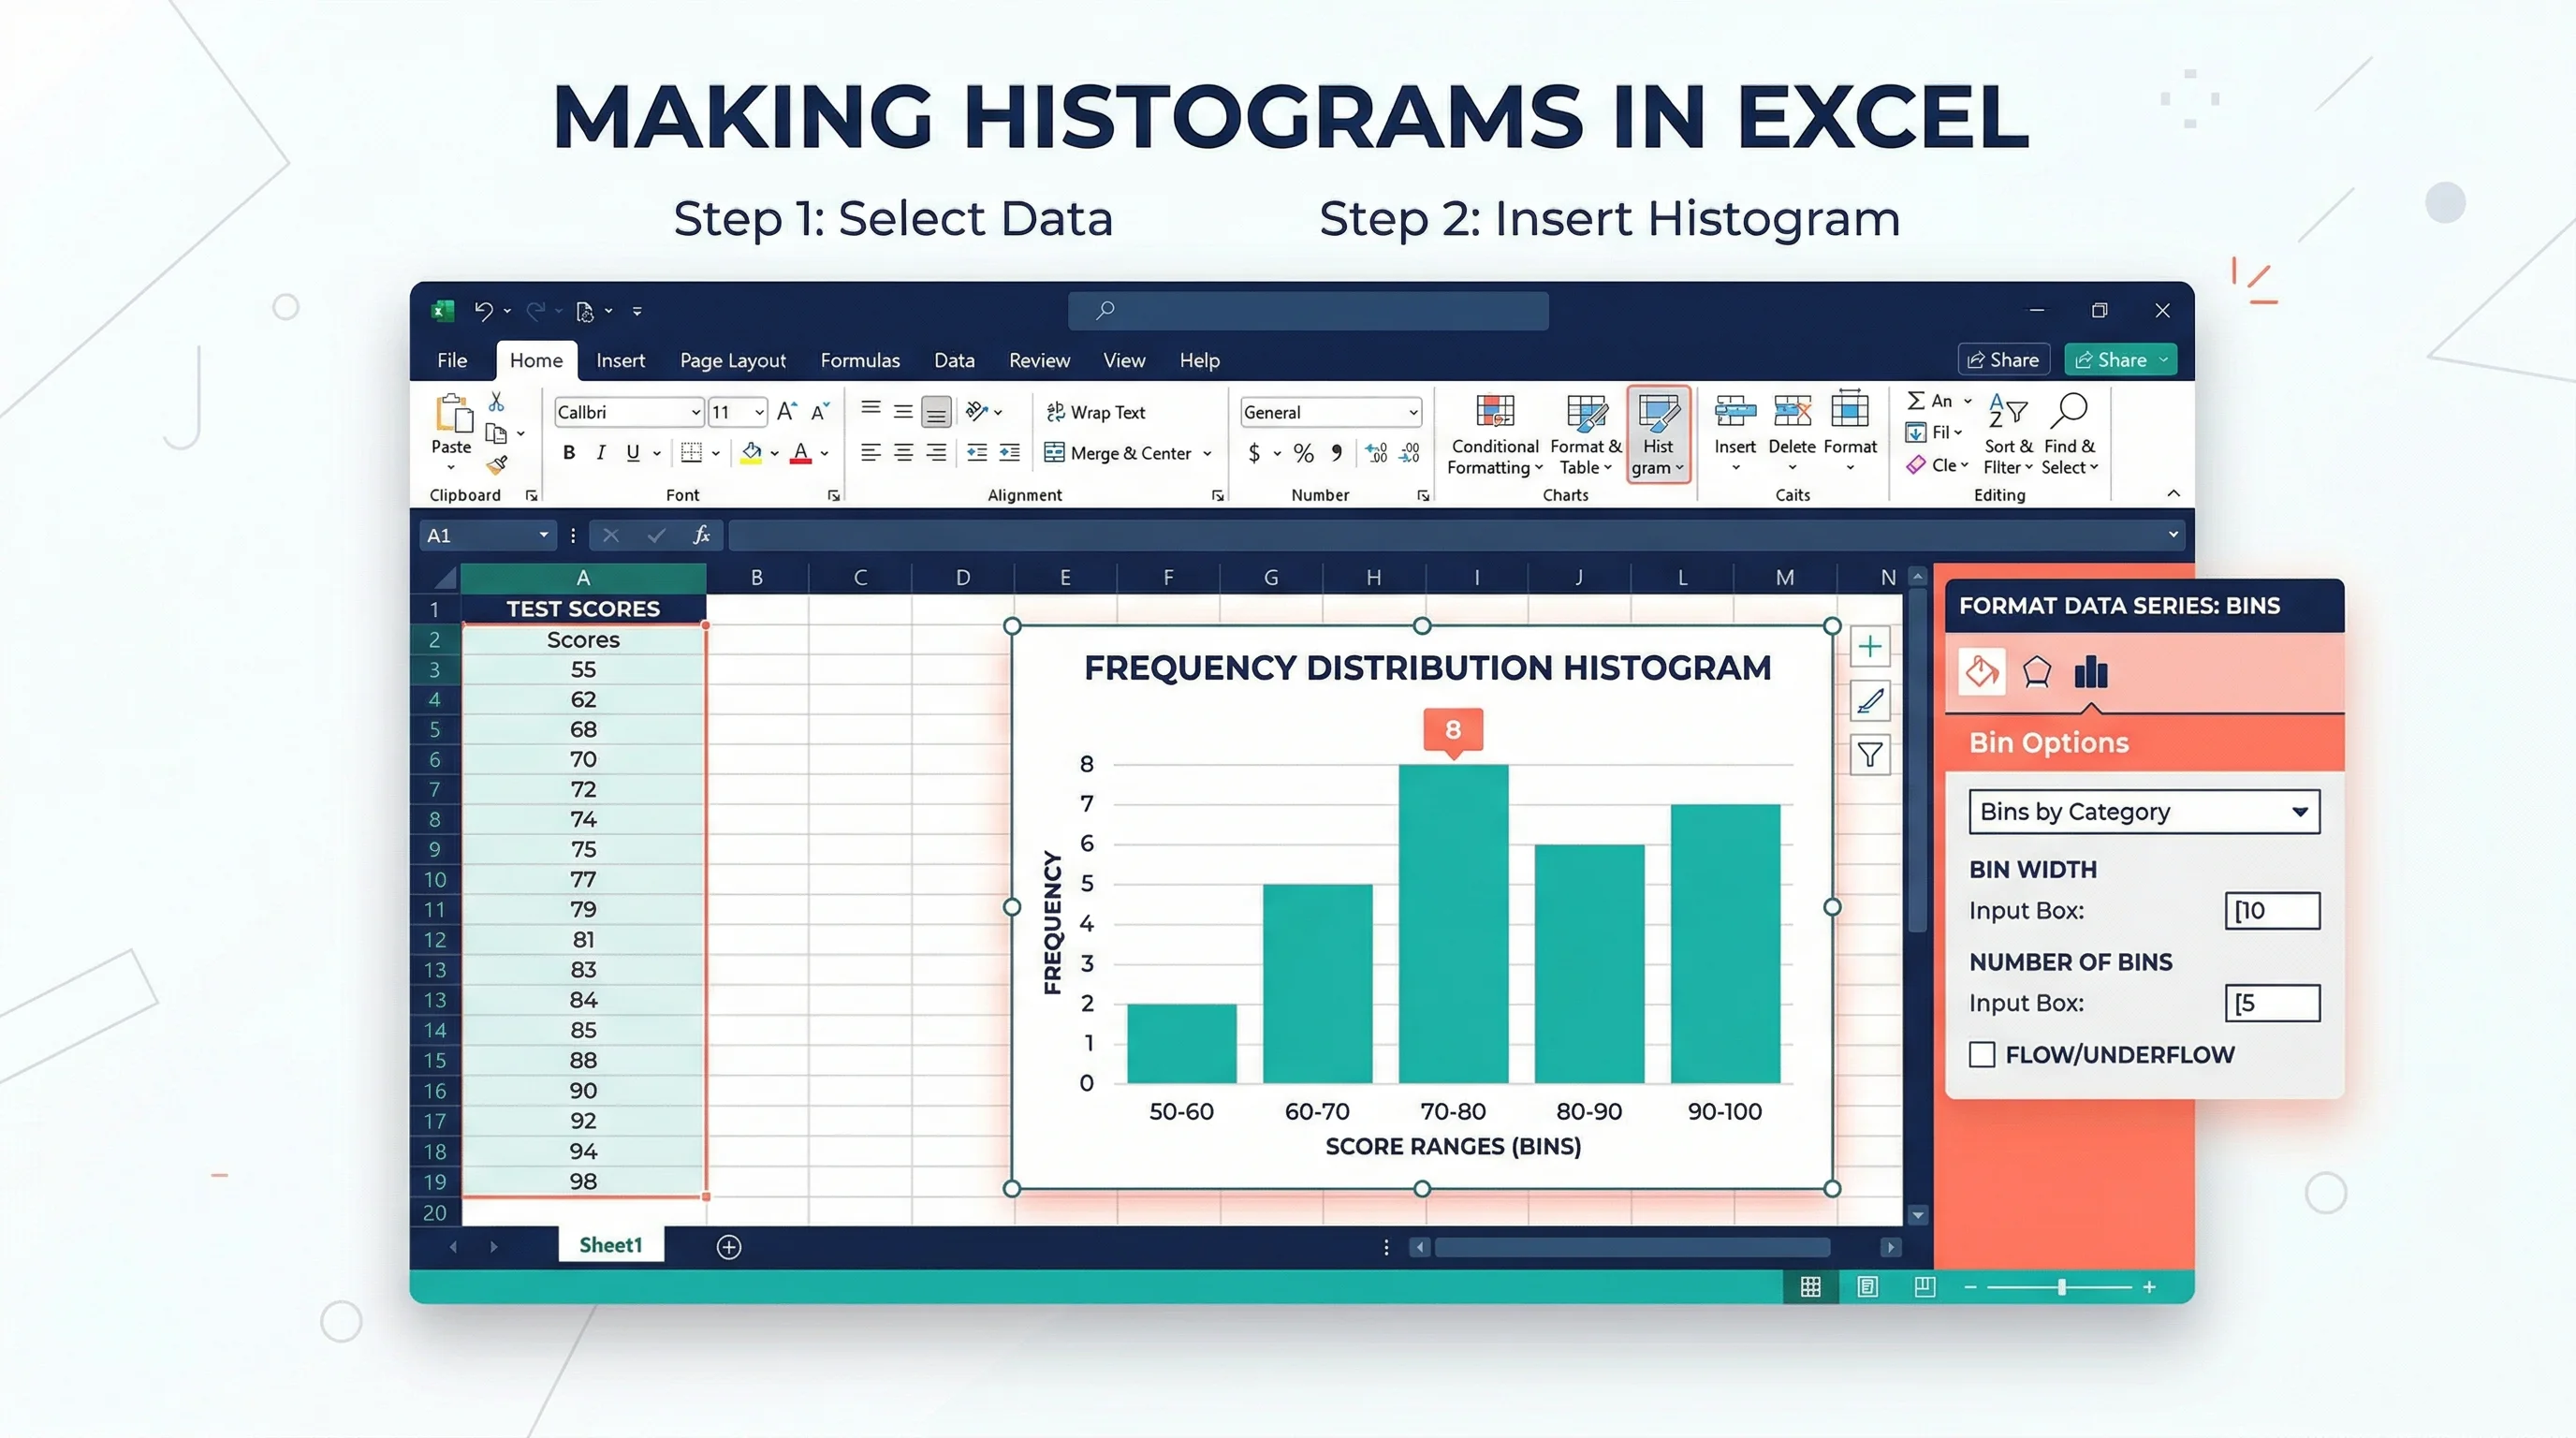
How to Make a Histogram in Excel: Step-by-Step Guide (2026)
Learn how to create a histogram in Excel with the built-in Histogram chart, bin controls, and formatting tips. Covers Excel 365, 2024, 2021, 2019, and 2016.
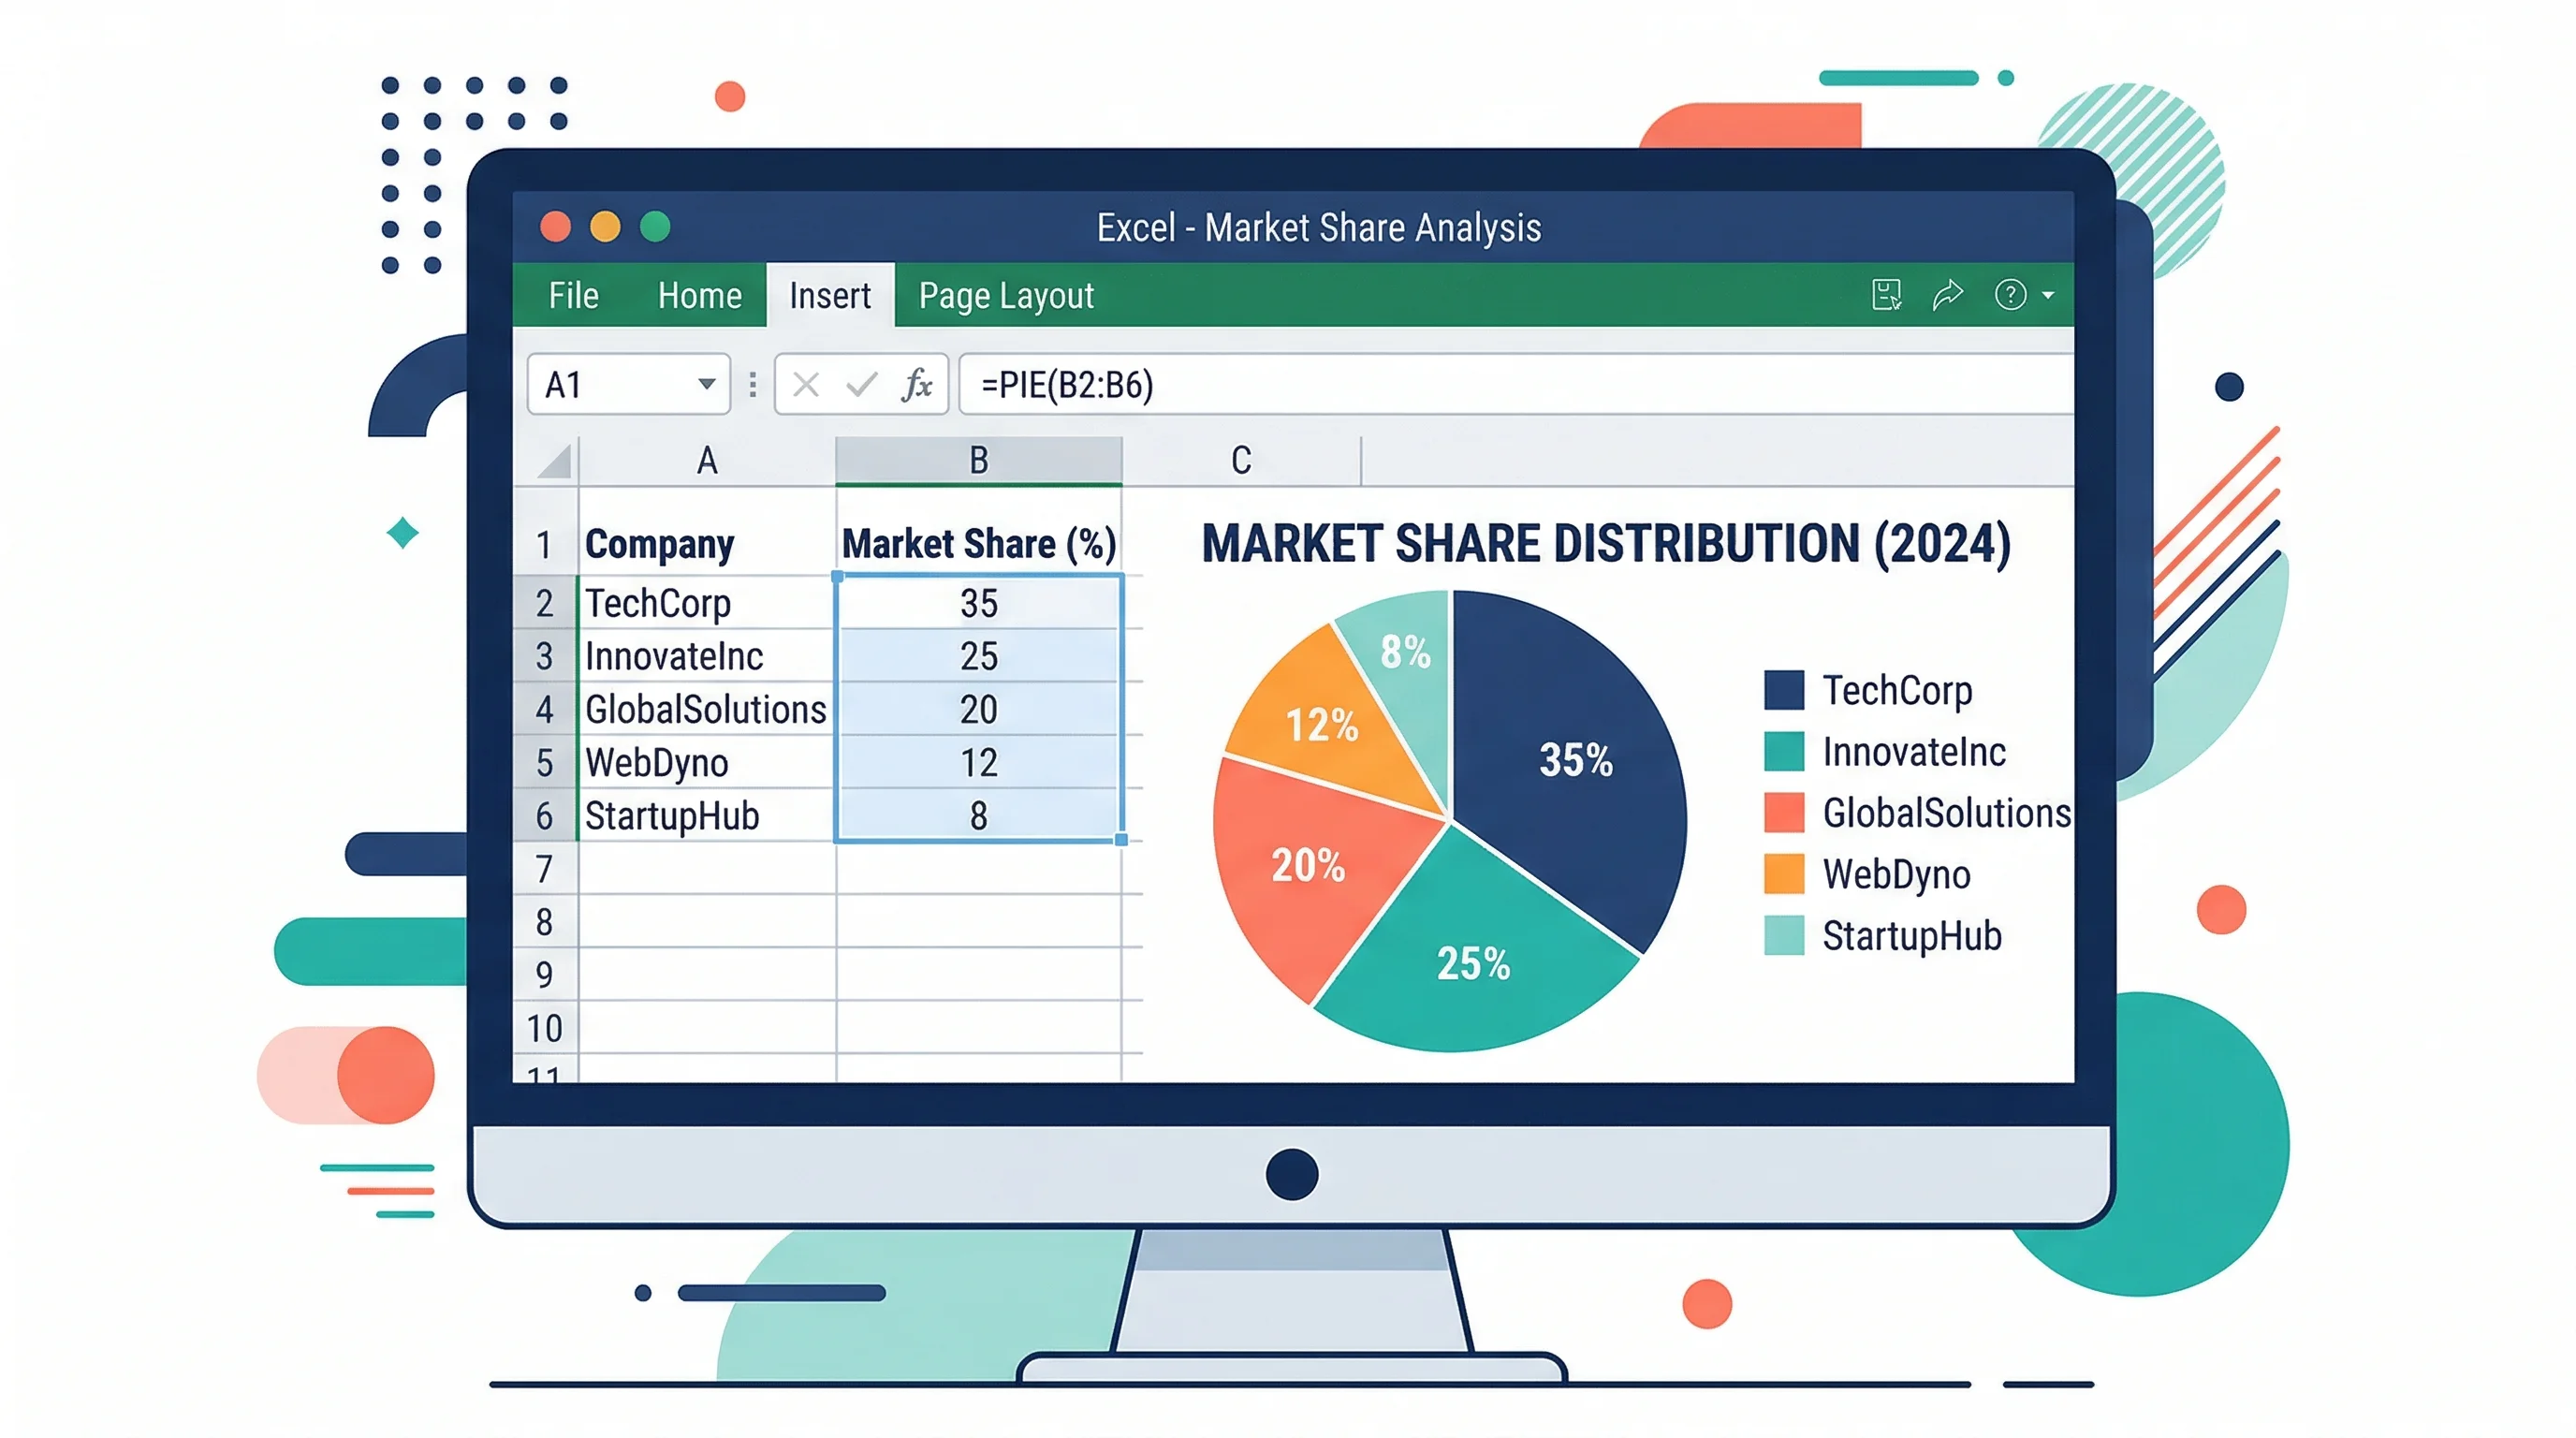
How to Make a Pie Chart in Excel: Step-by-Step Guide (2026)
Learn how to create a pie chart in Excel, format labels, choose better colors, and avoid misleading slices. Includes Excel 365, 2024, 2021, and 2019 workflows.
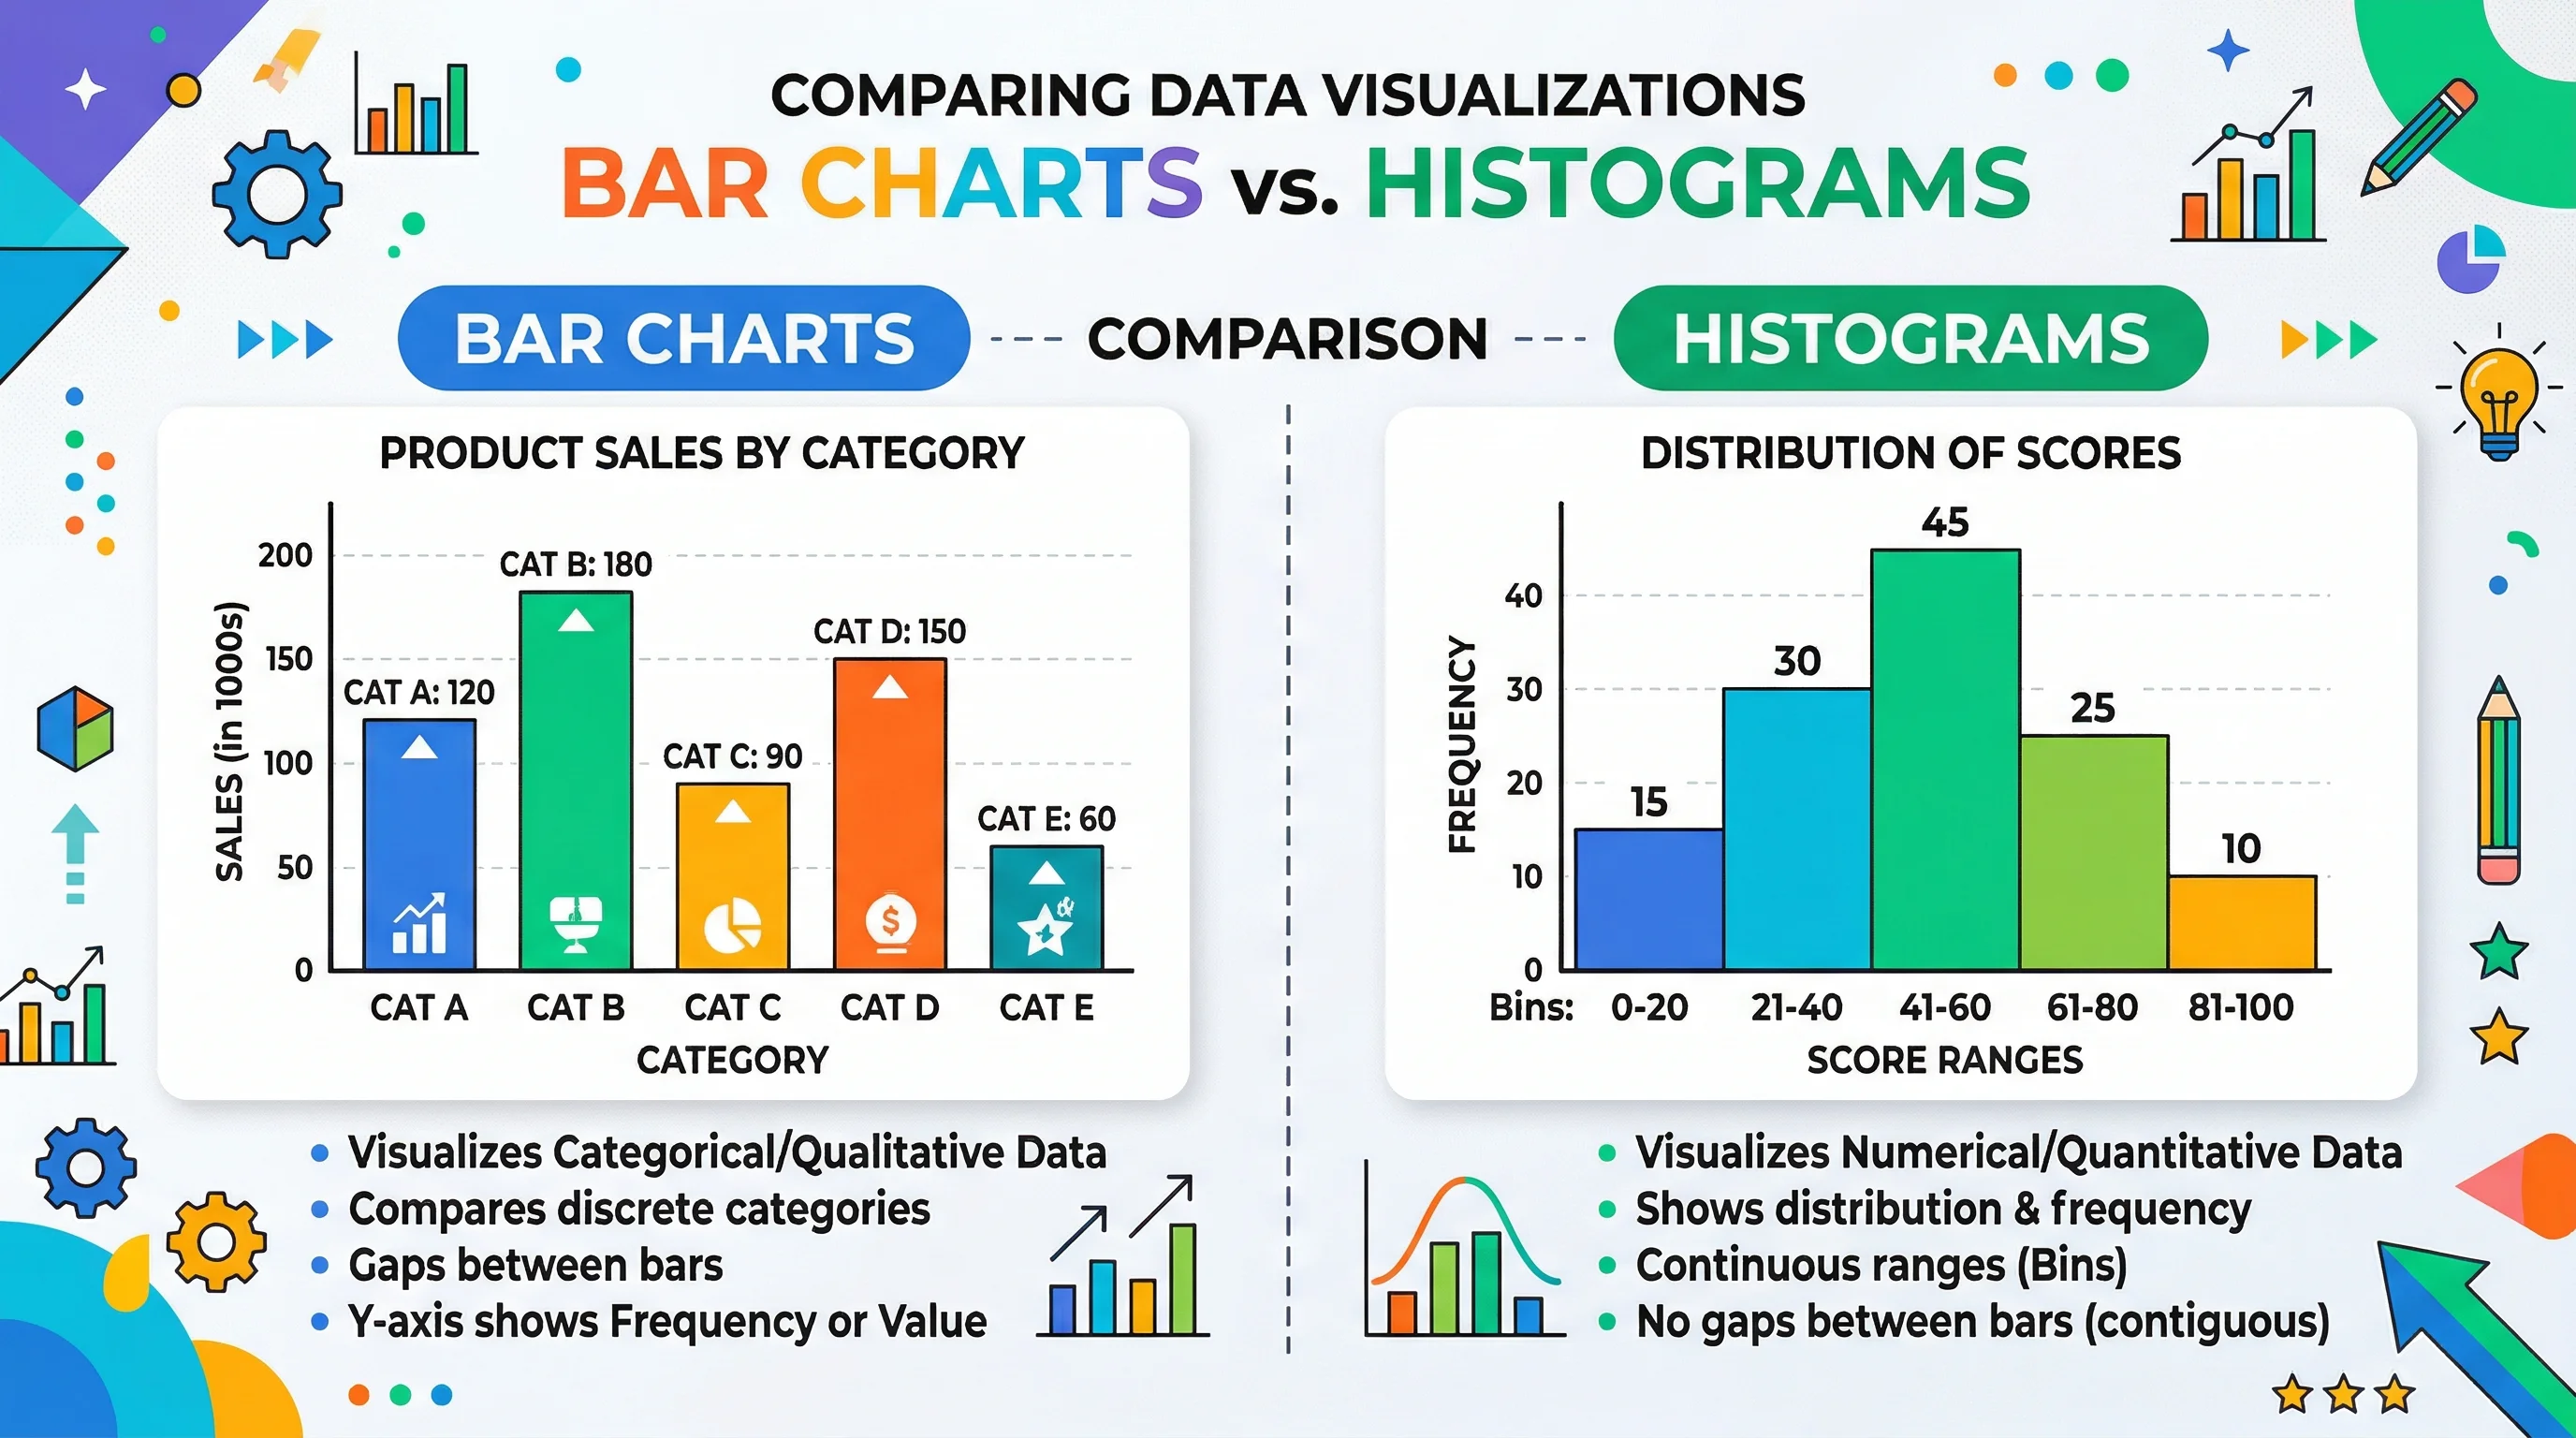
Bar Chart vs Histogram: Key Differences Explained
Learn the real difference between bar charts and histograms with clear examples. Covers when to use each, common mistakes, and how to create both quickly.

Best AI Diagram Generators in 2026 Compared
Compare the top AI diagram generators for UML, ER, Venn, electrical, and architecture diagrams. Turn text into professional visuals in seconds.
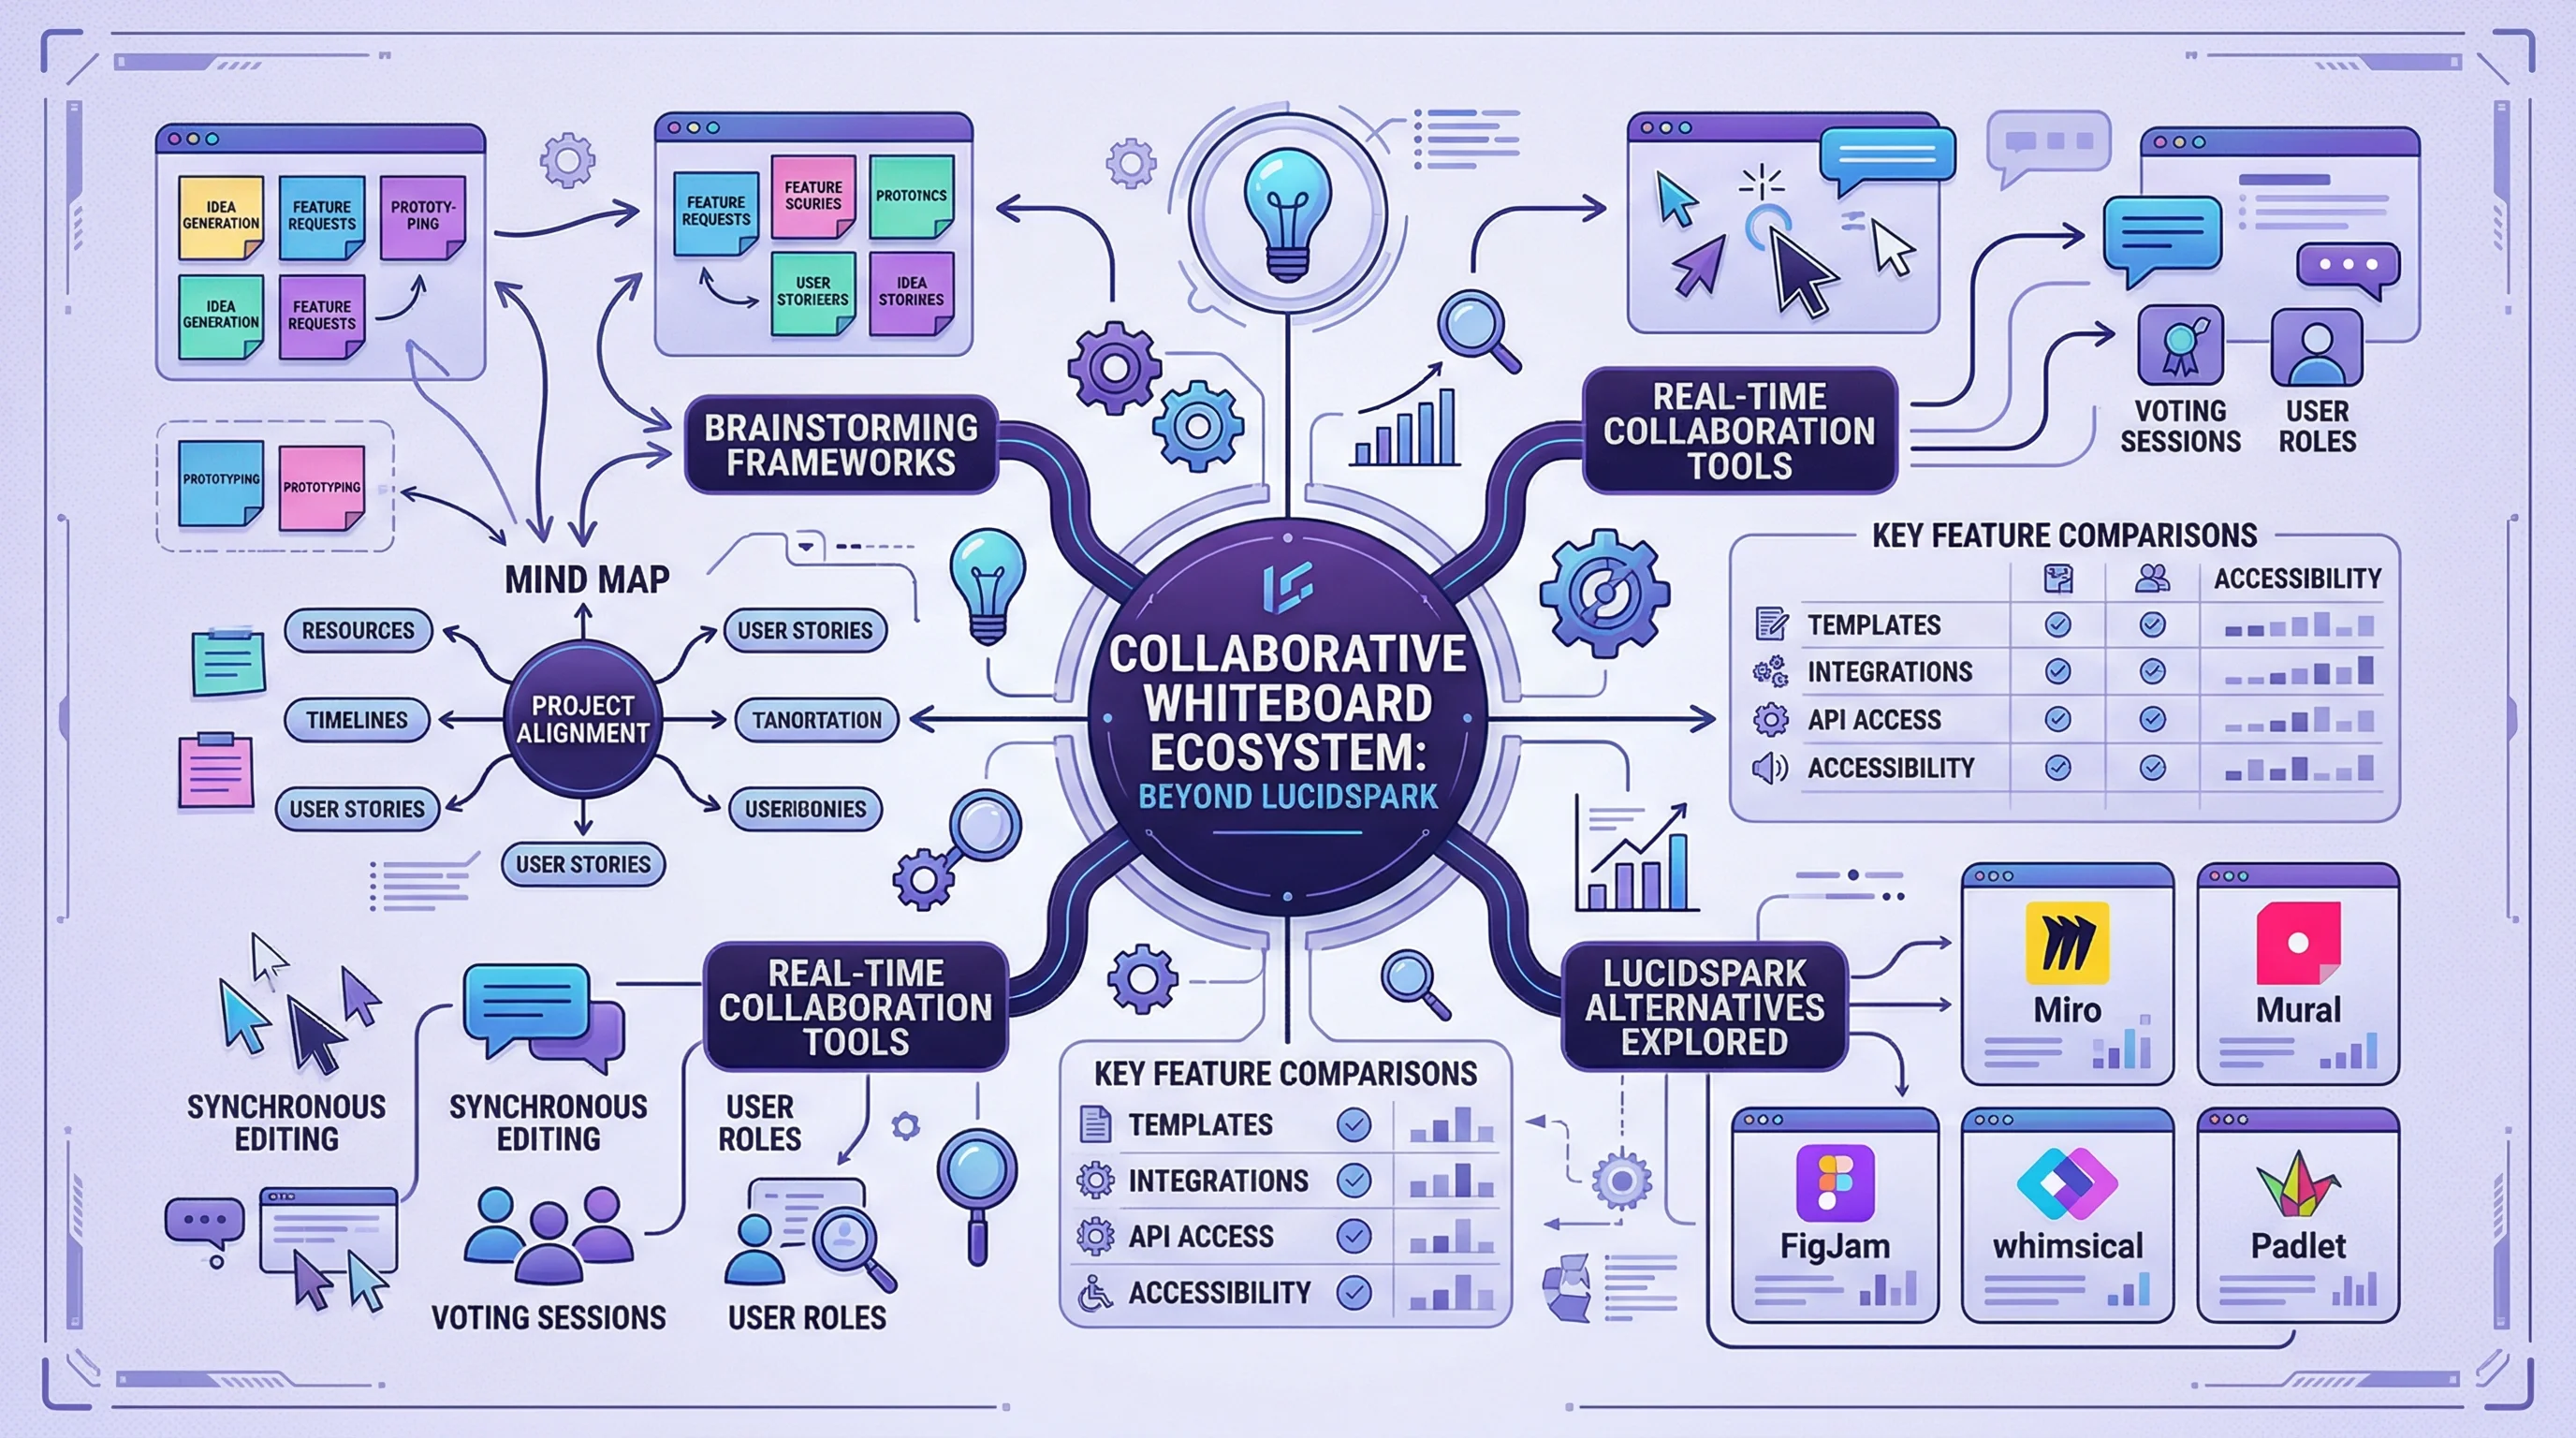
Lucidspark Alternatives: 8 Best Free Tools (2026)
Compare the 8 best free Lucidspark alternatives for 2026. FigJam, Miro, Excalidraw, Canva Whiteboard & more — unlimited brainstorming without the paywall.