Блог
Советы преподавателям, сравнение инструментов и руководства по научным диаграммам для преподавателей STEM. Создавайте лучшие учебные материалы с помощью ИИ.
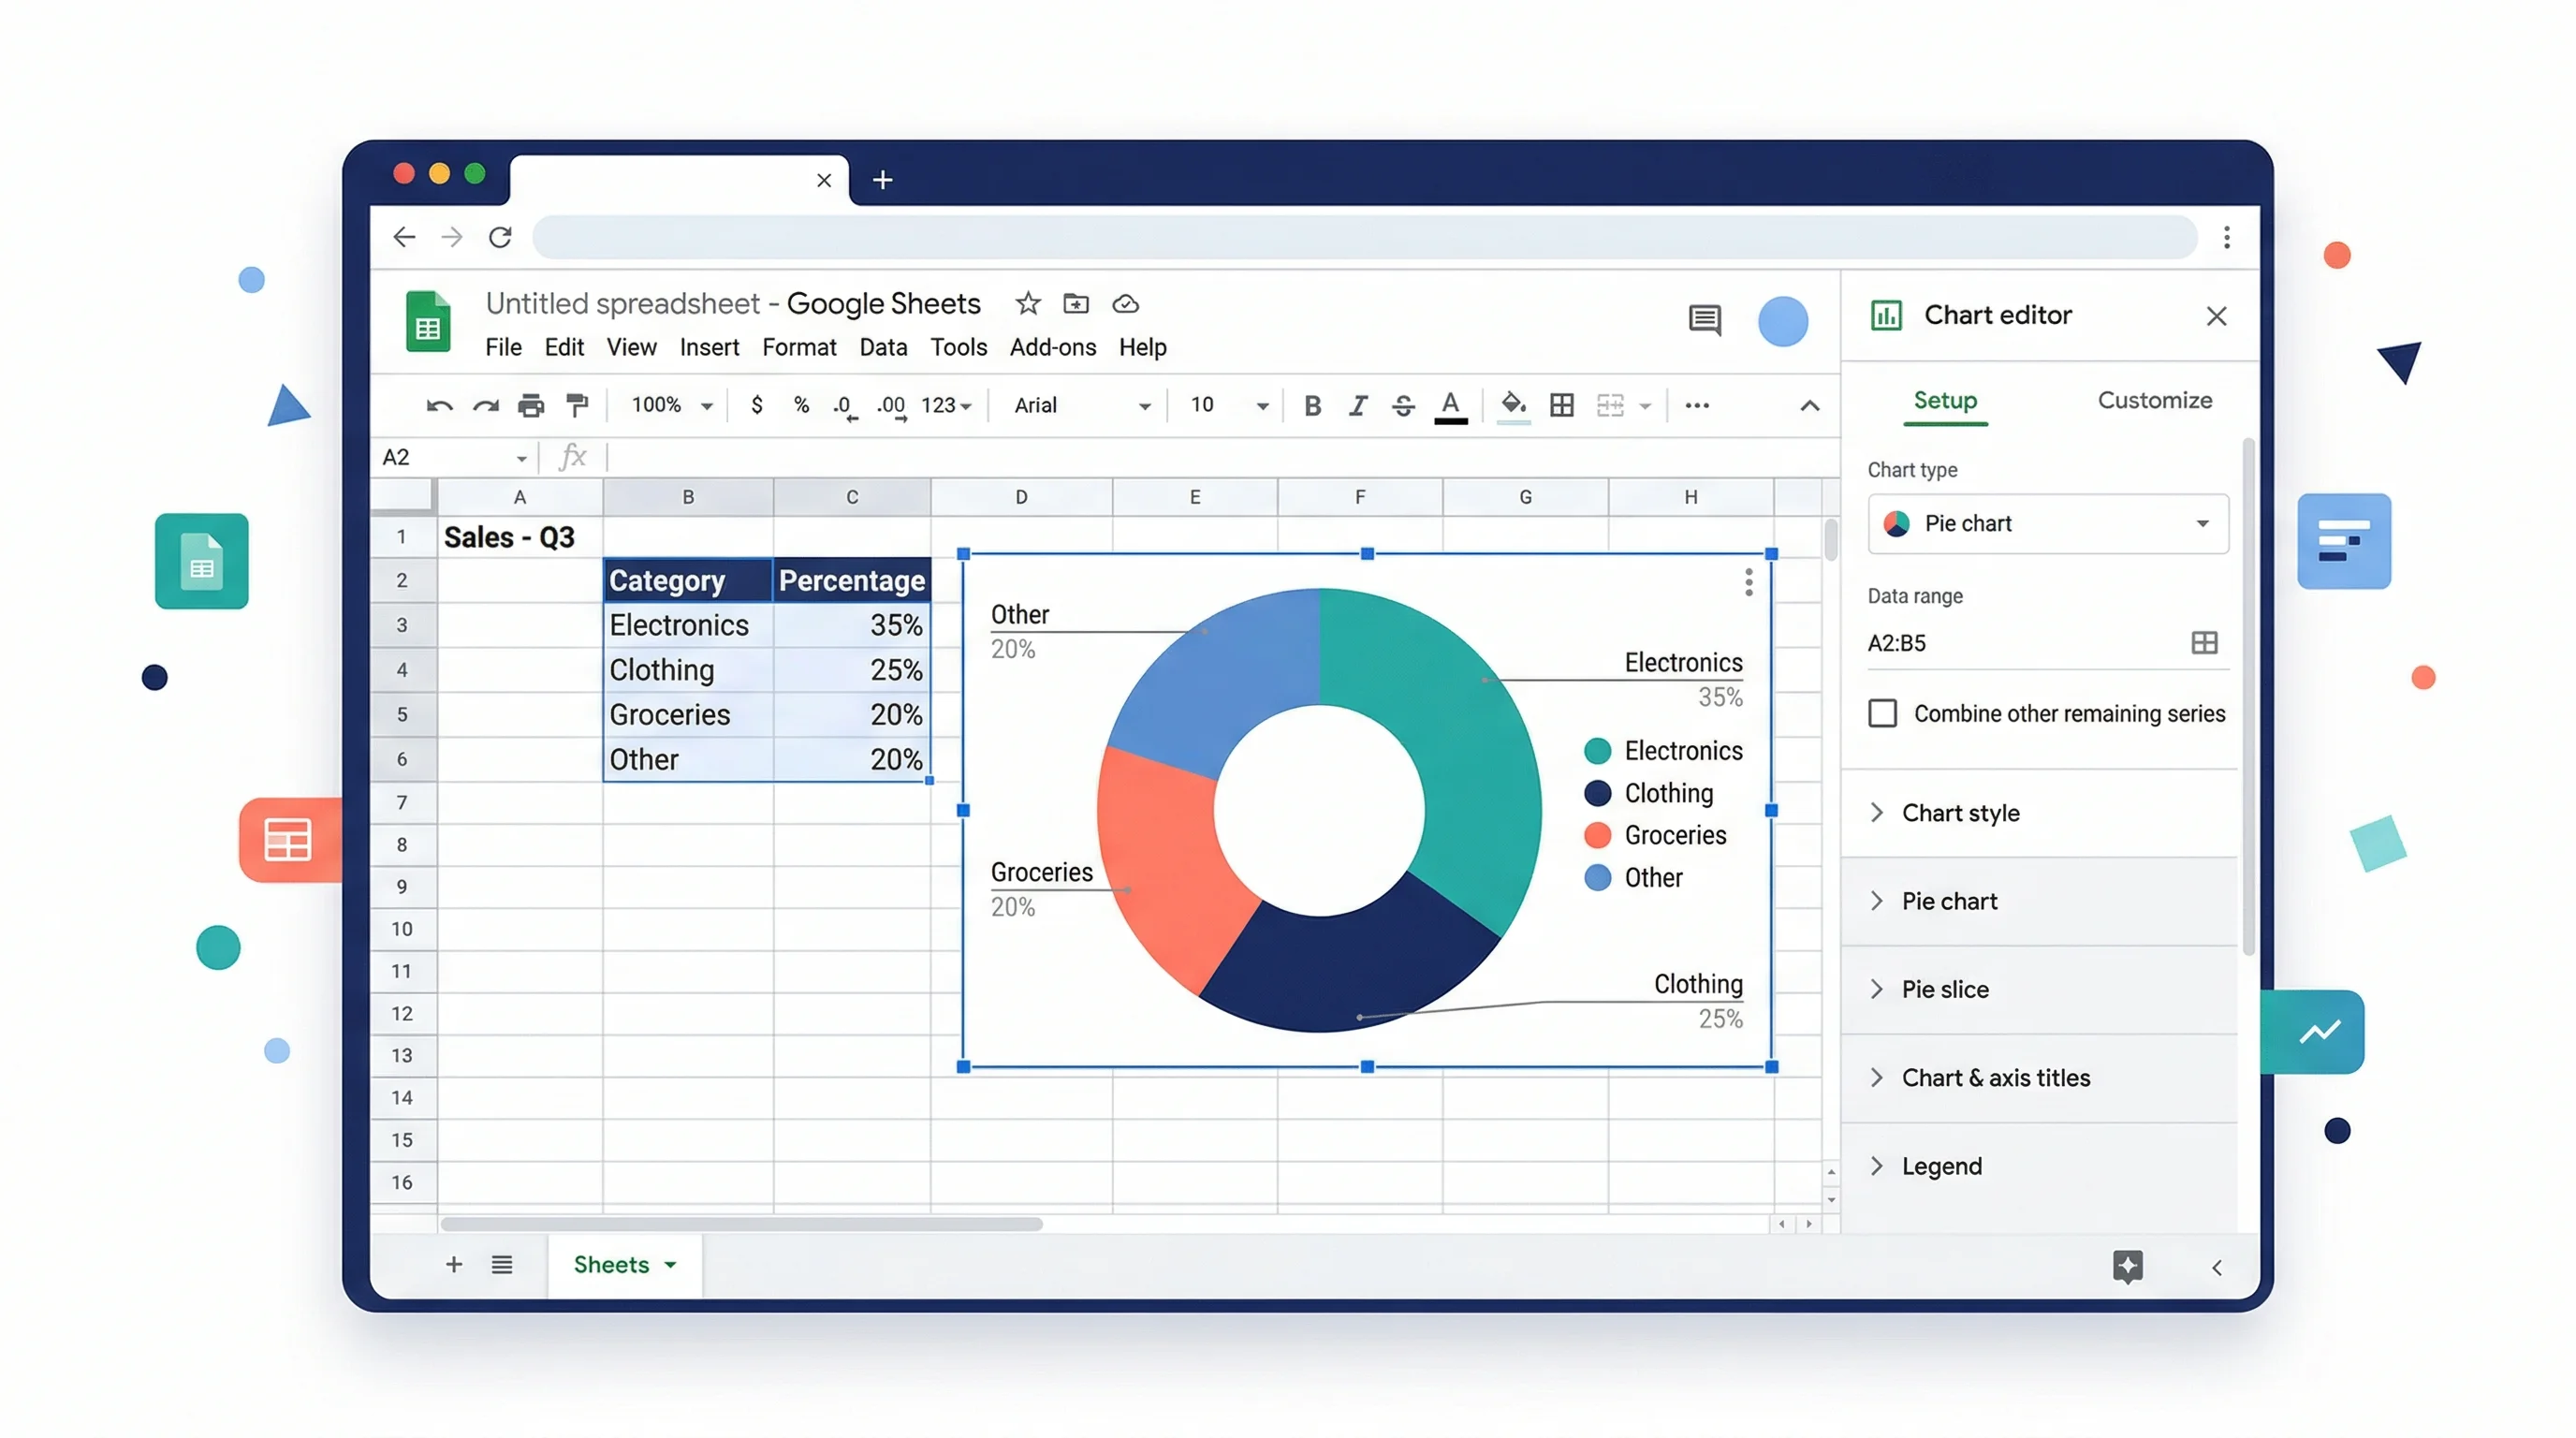
How to Make a Pie Chart in Google Sheets: Step-by-Step Guide (2026)
Learn how to create a pie chart in Google Sheets, summarize messy data, format labels, customize slices, and avoid misleading charts, with official help links.
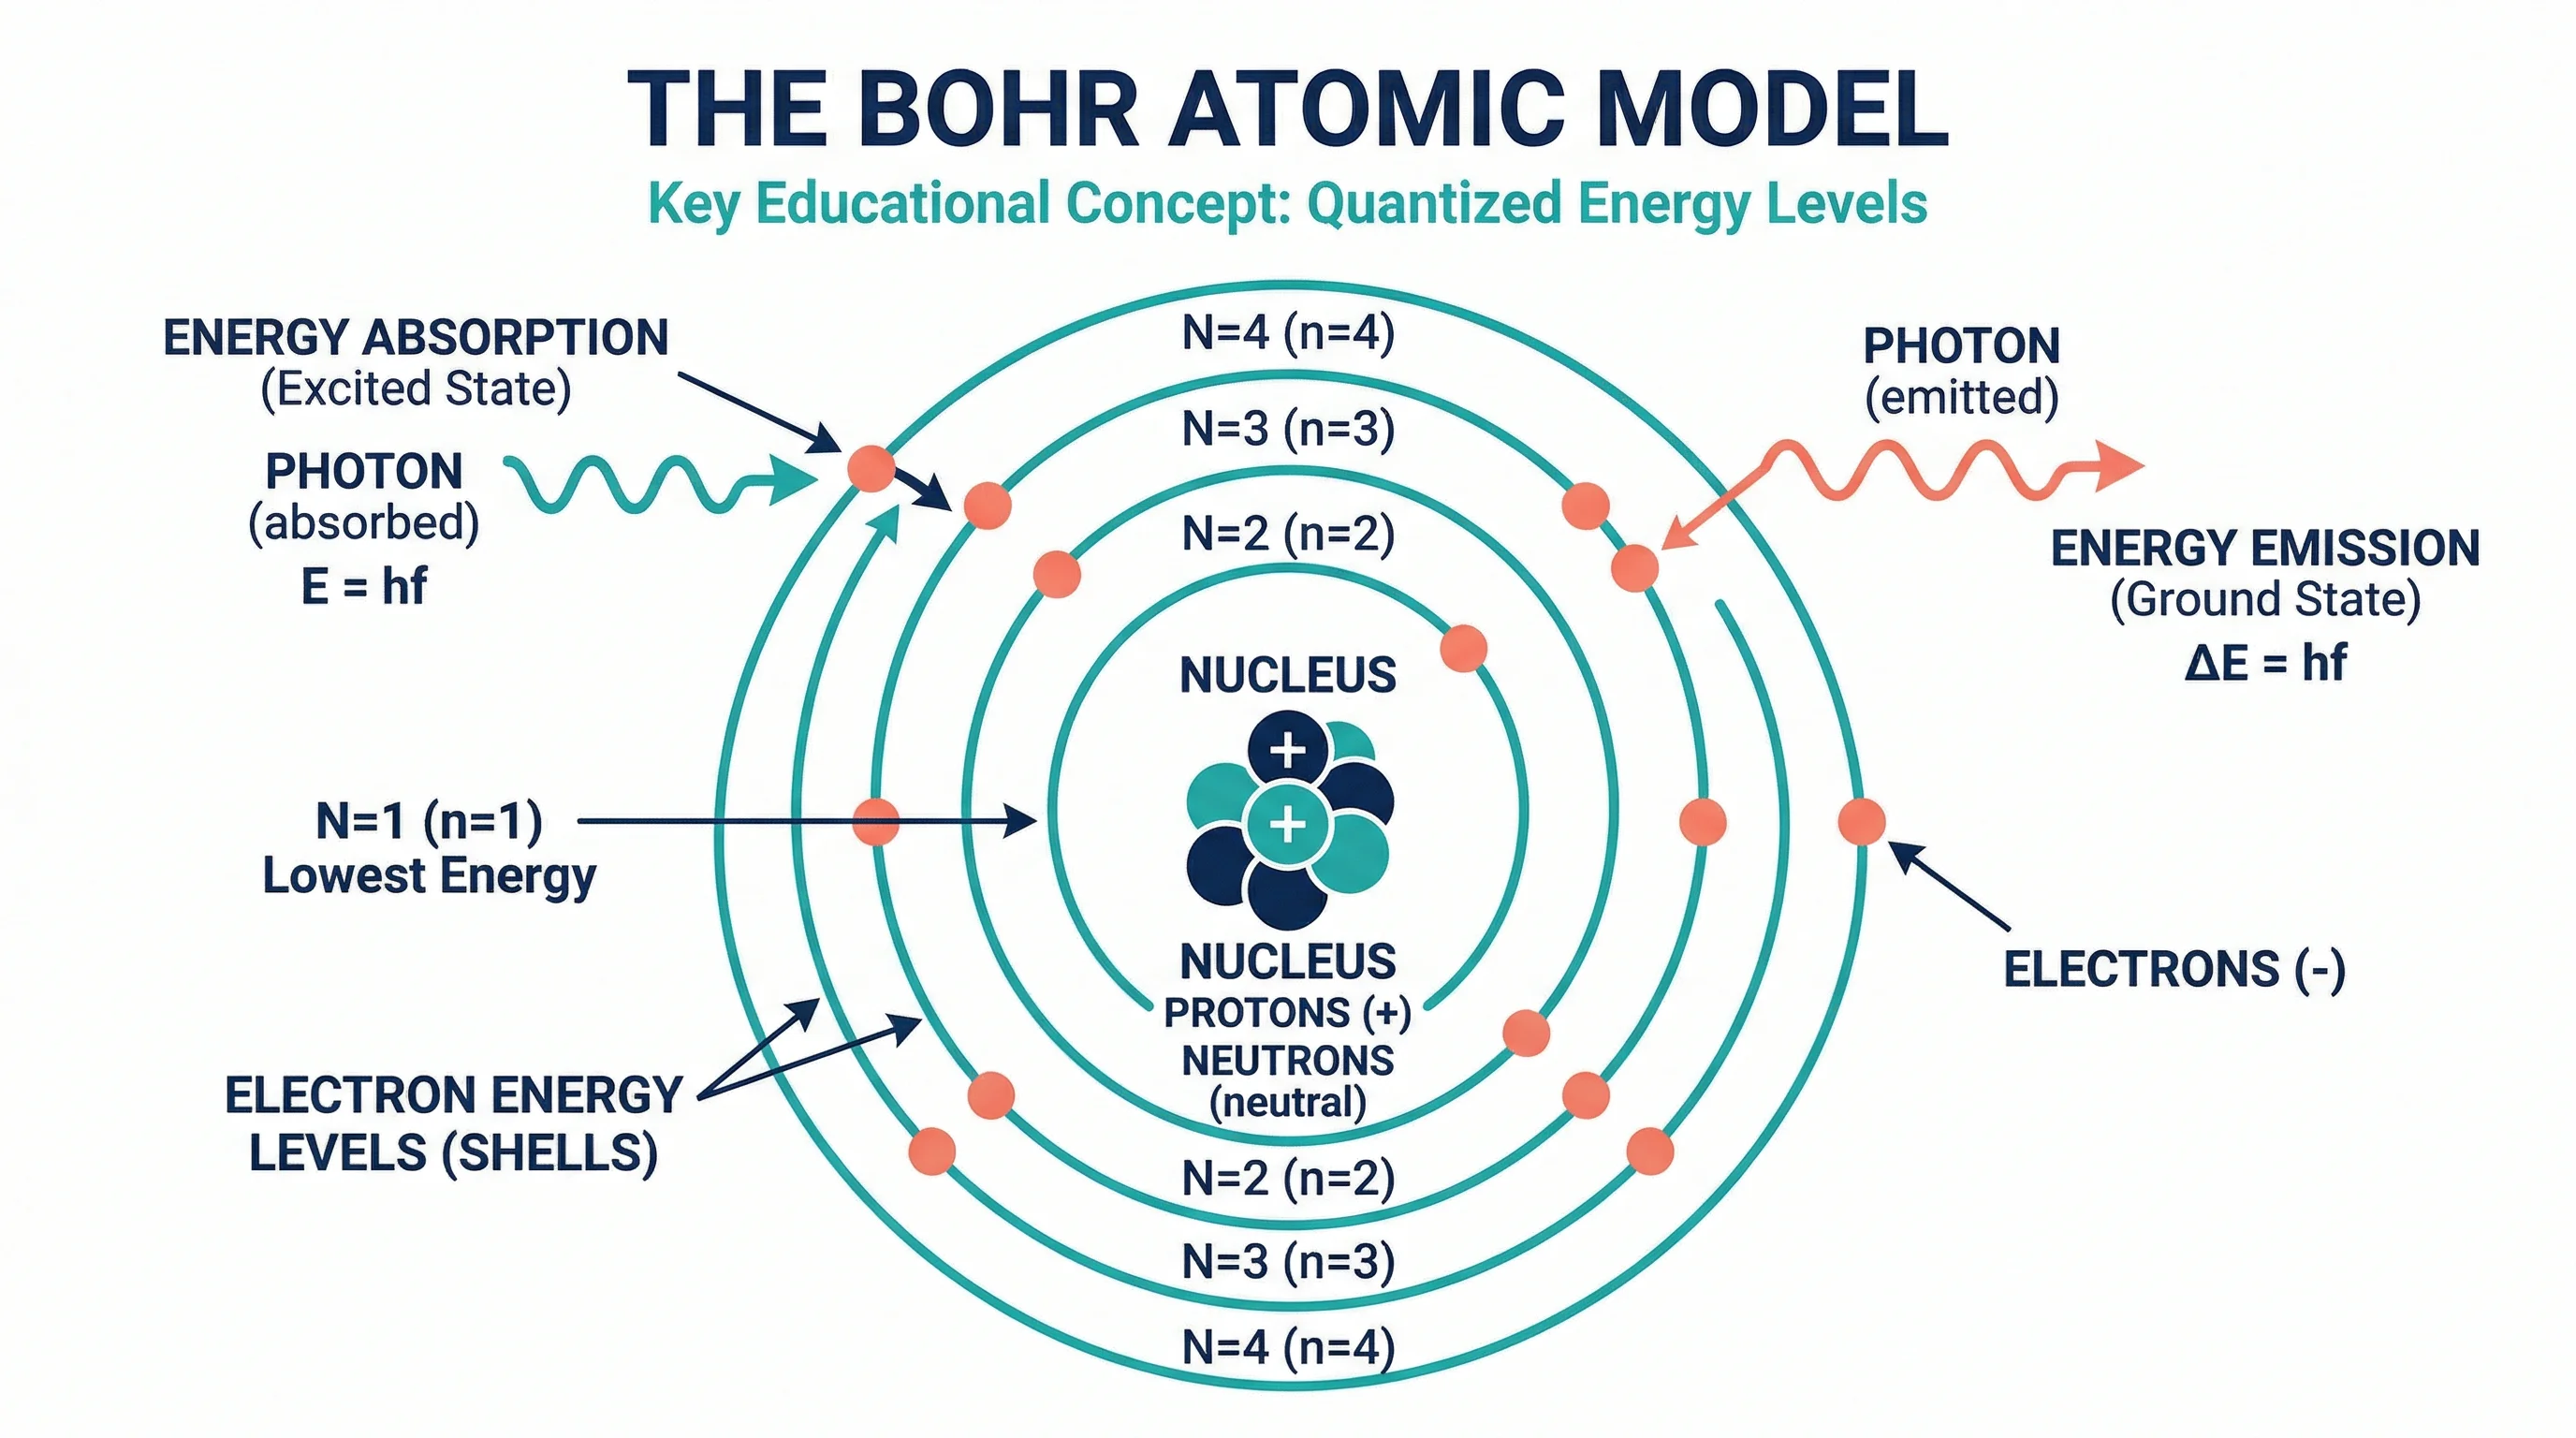
How to Make a Bohr Model: Step-by-Step Guide for Students (2026)
Learn how to draw a Bohr model for any element. Covers electron shell rules, common elements, mistakes to avoid, and where Bohr models break down.
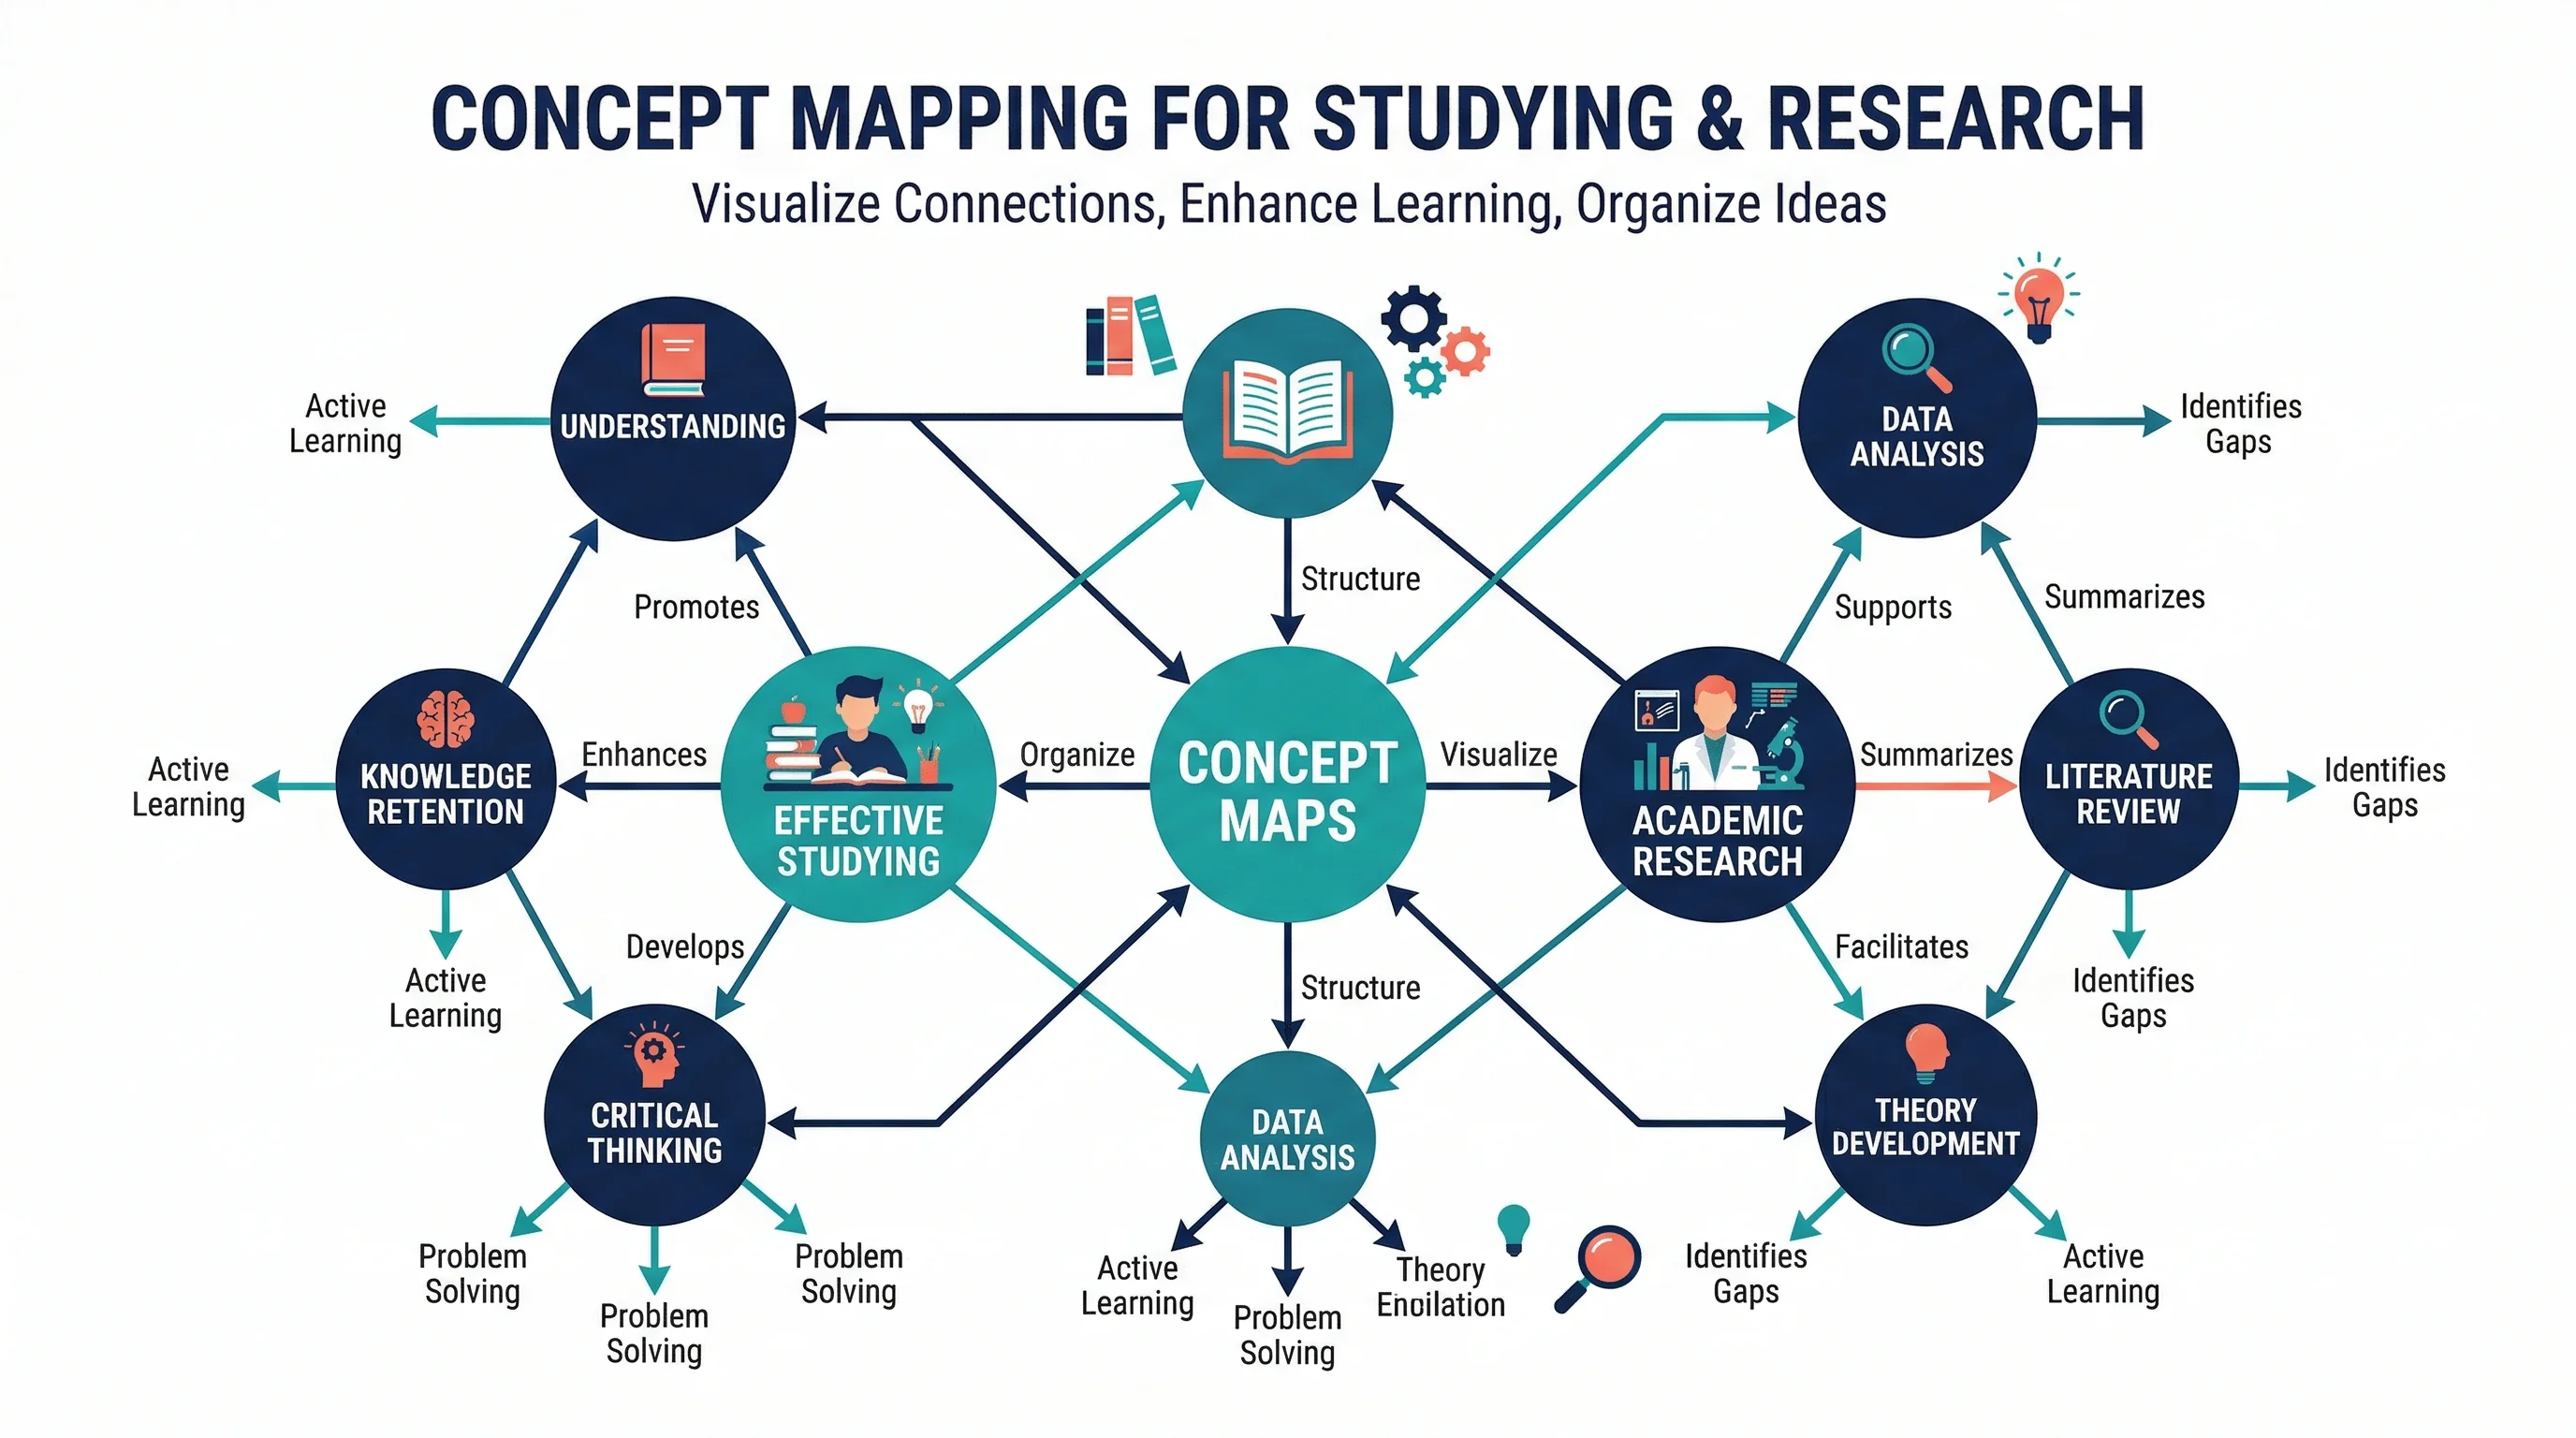
How to Make a Concept Map: Step-by-Step Guide for Students and Researchers (2026)
Learn how to make a concept map for research papers, studying, and brainstorming. Covers structure, linking phrases, tools, and common mistakes, with examples.
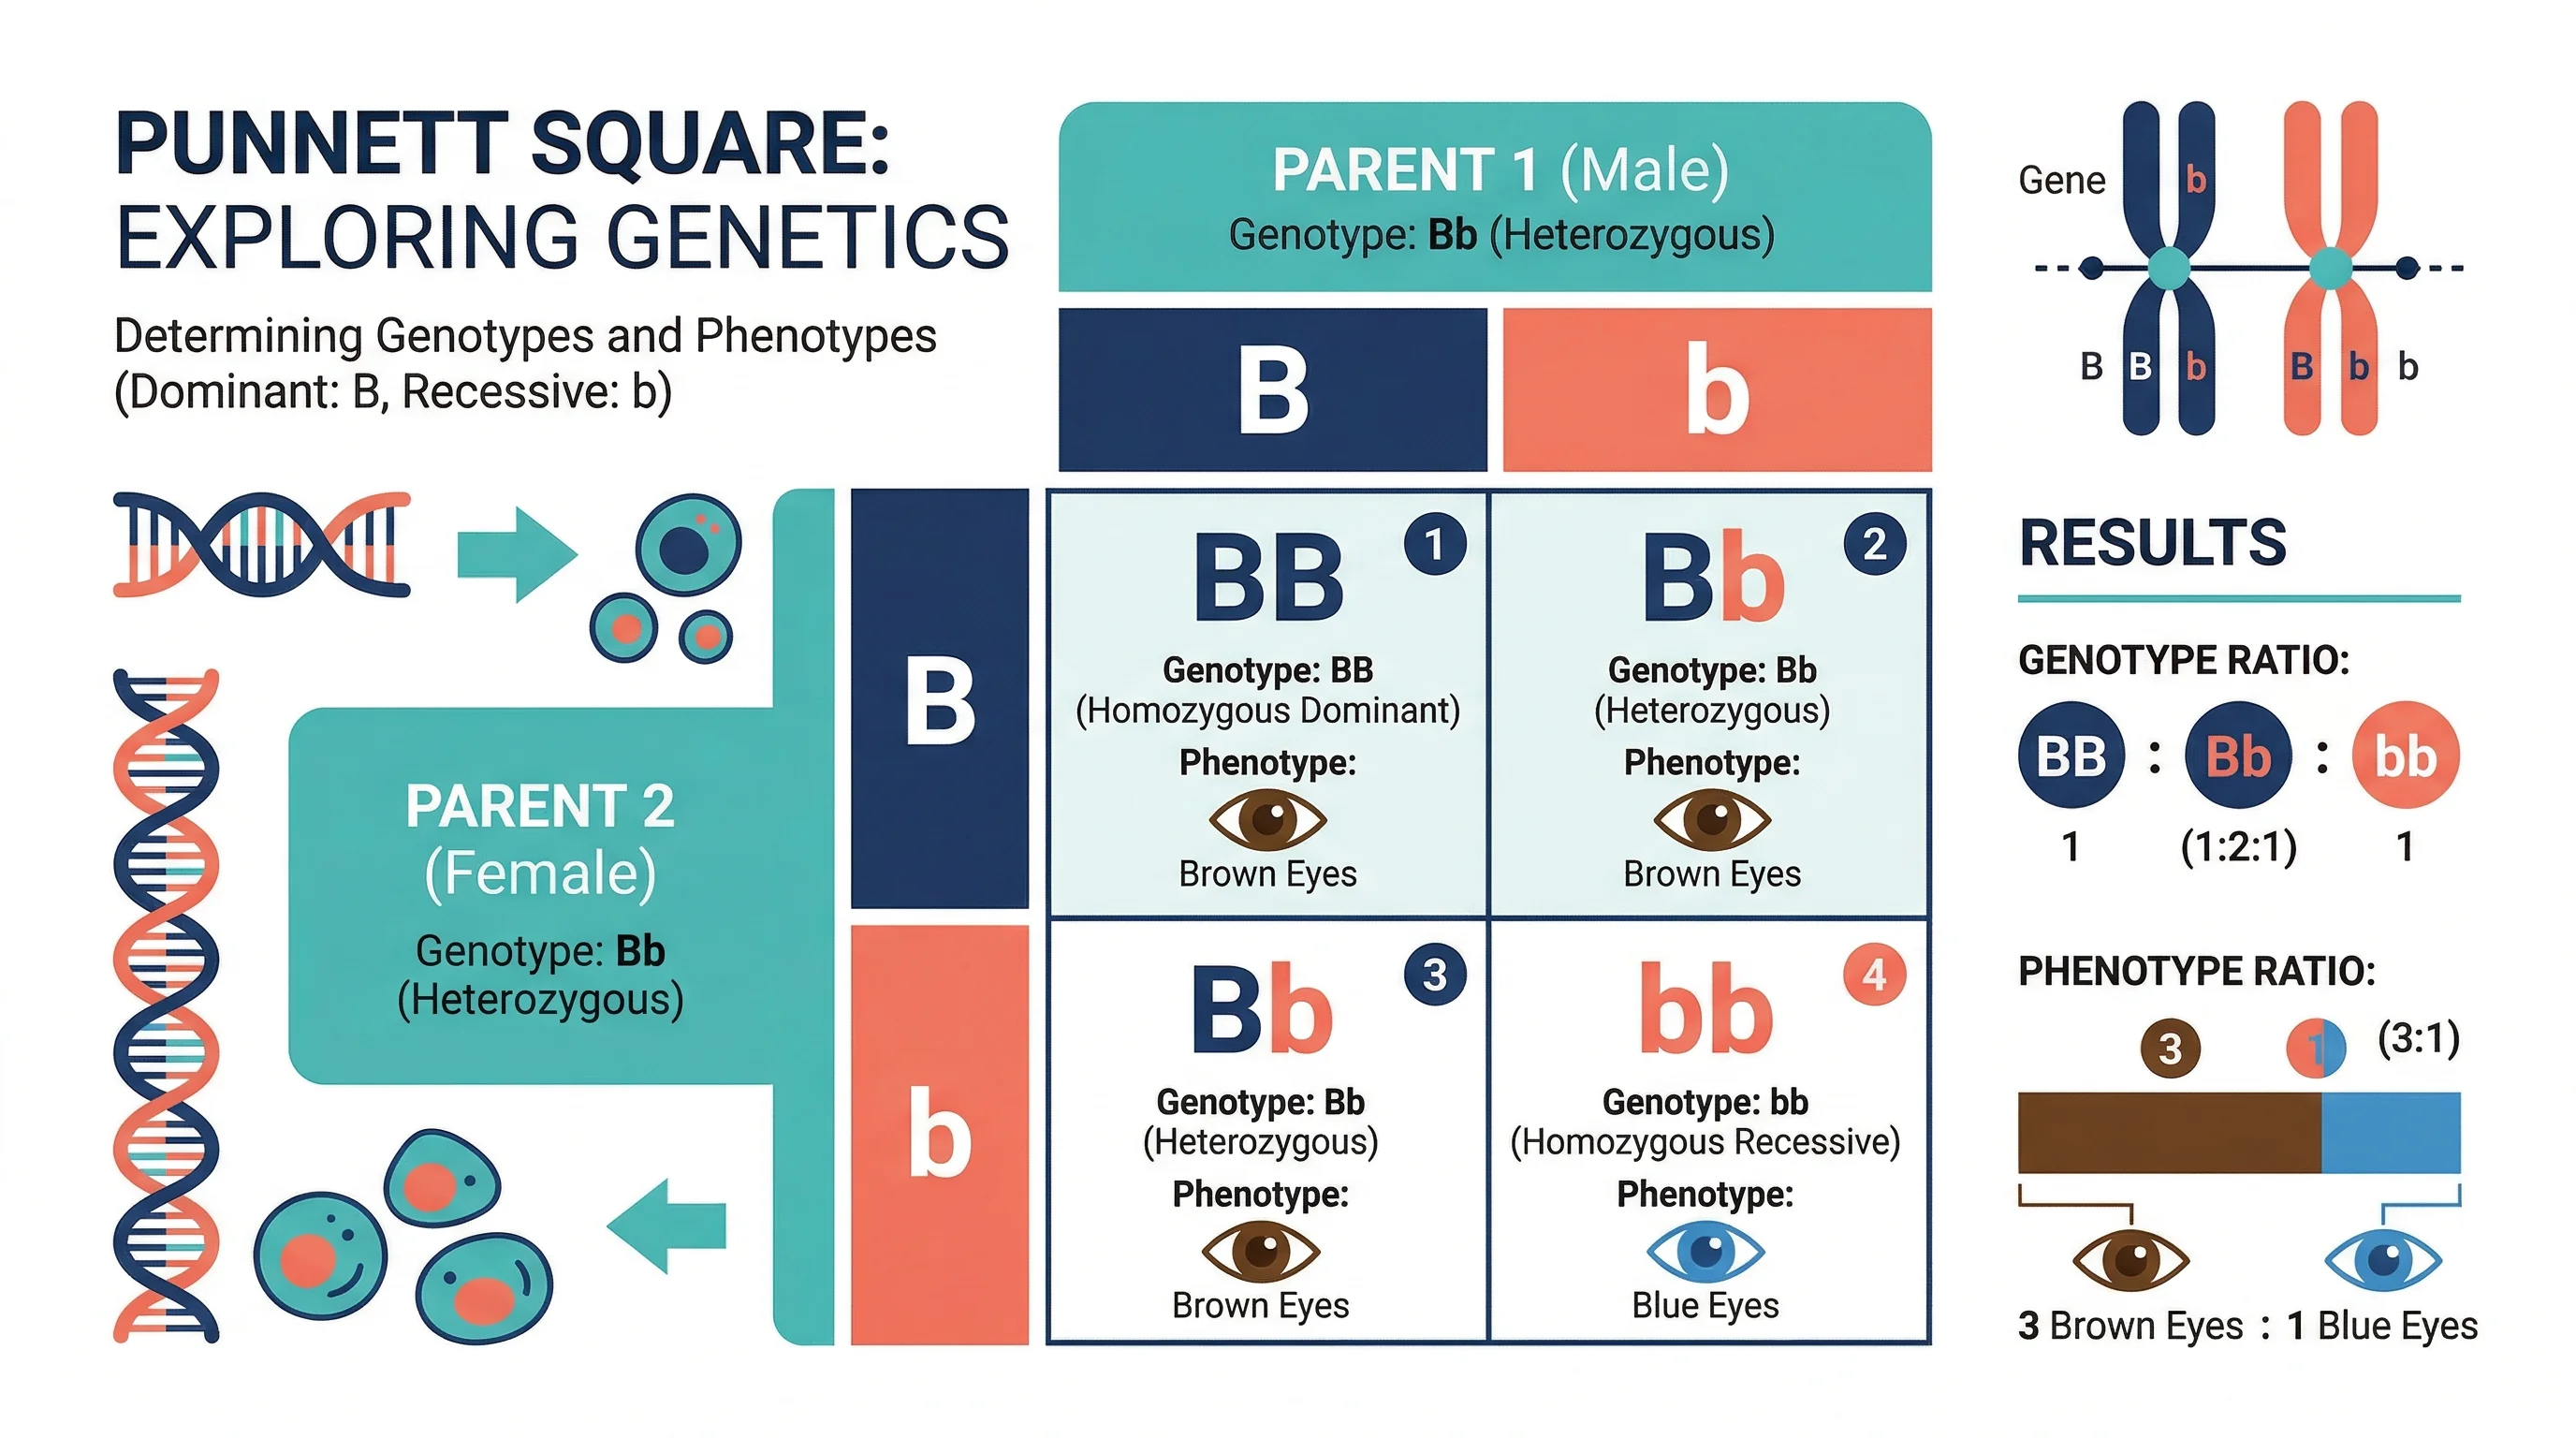
How to Make a Punnett Square: Step-by-Step Genetics Guide (2026)
Learn how to make a Punnett square for monohybrid and dihybrid crosses. Covers genotype and phenotype ratios, incomplete dominance, and mistakes, with examples.
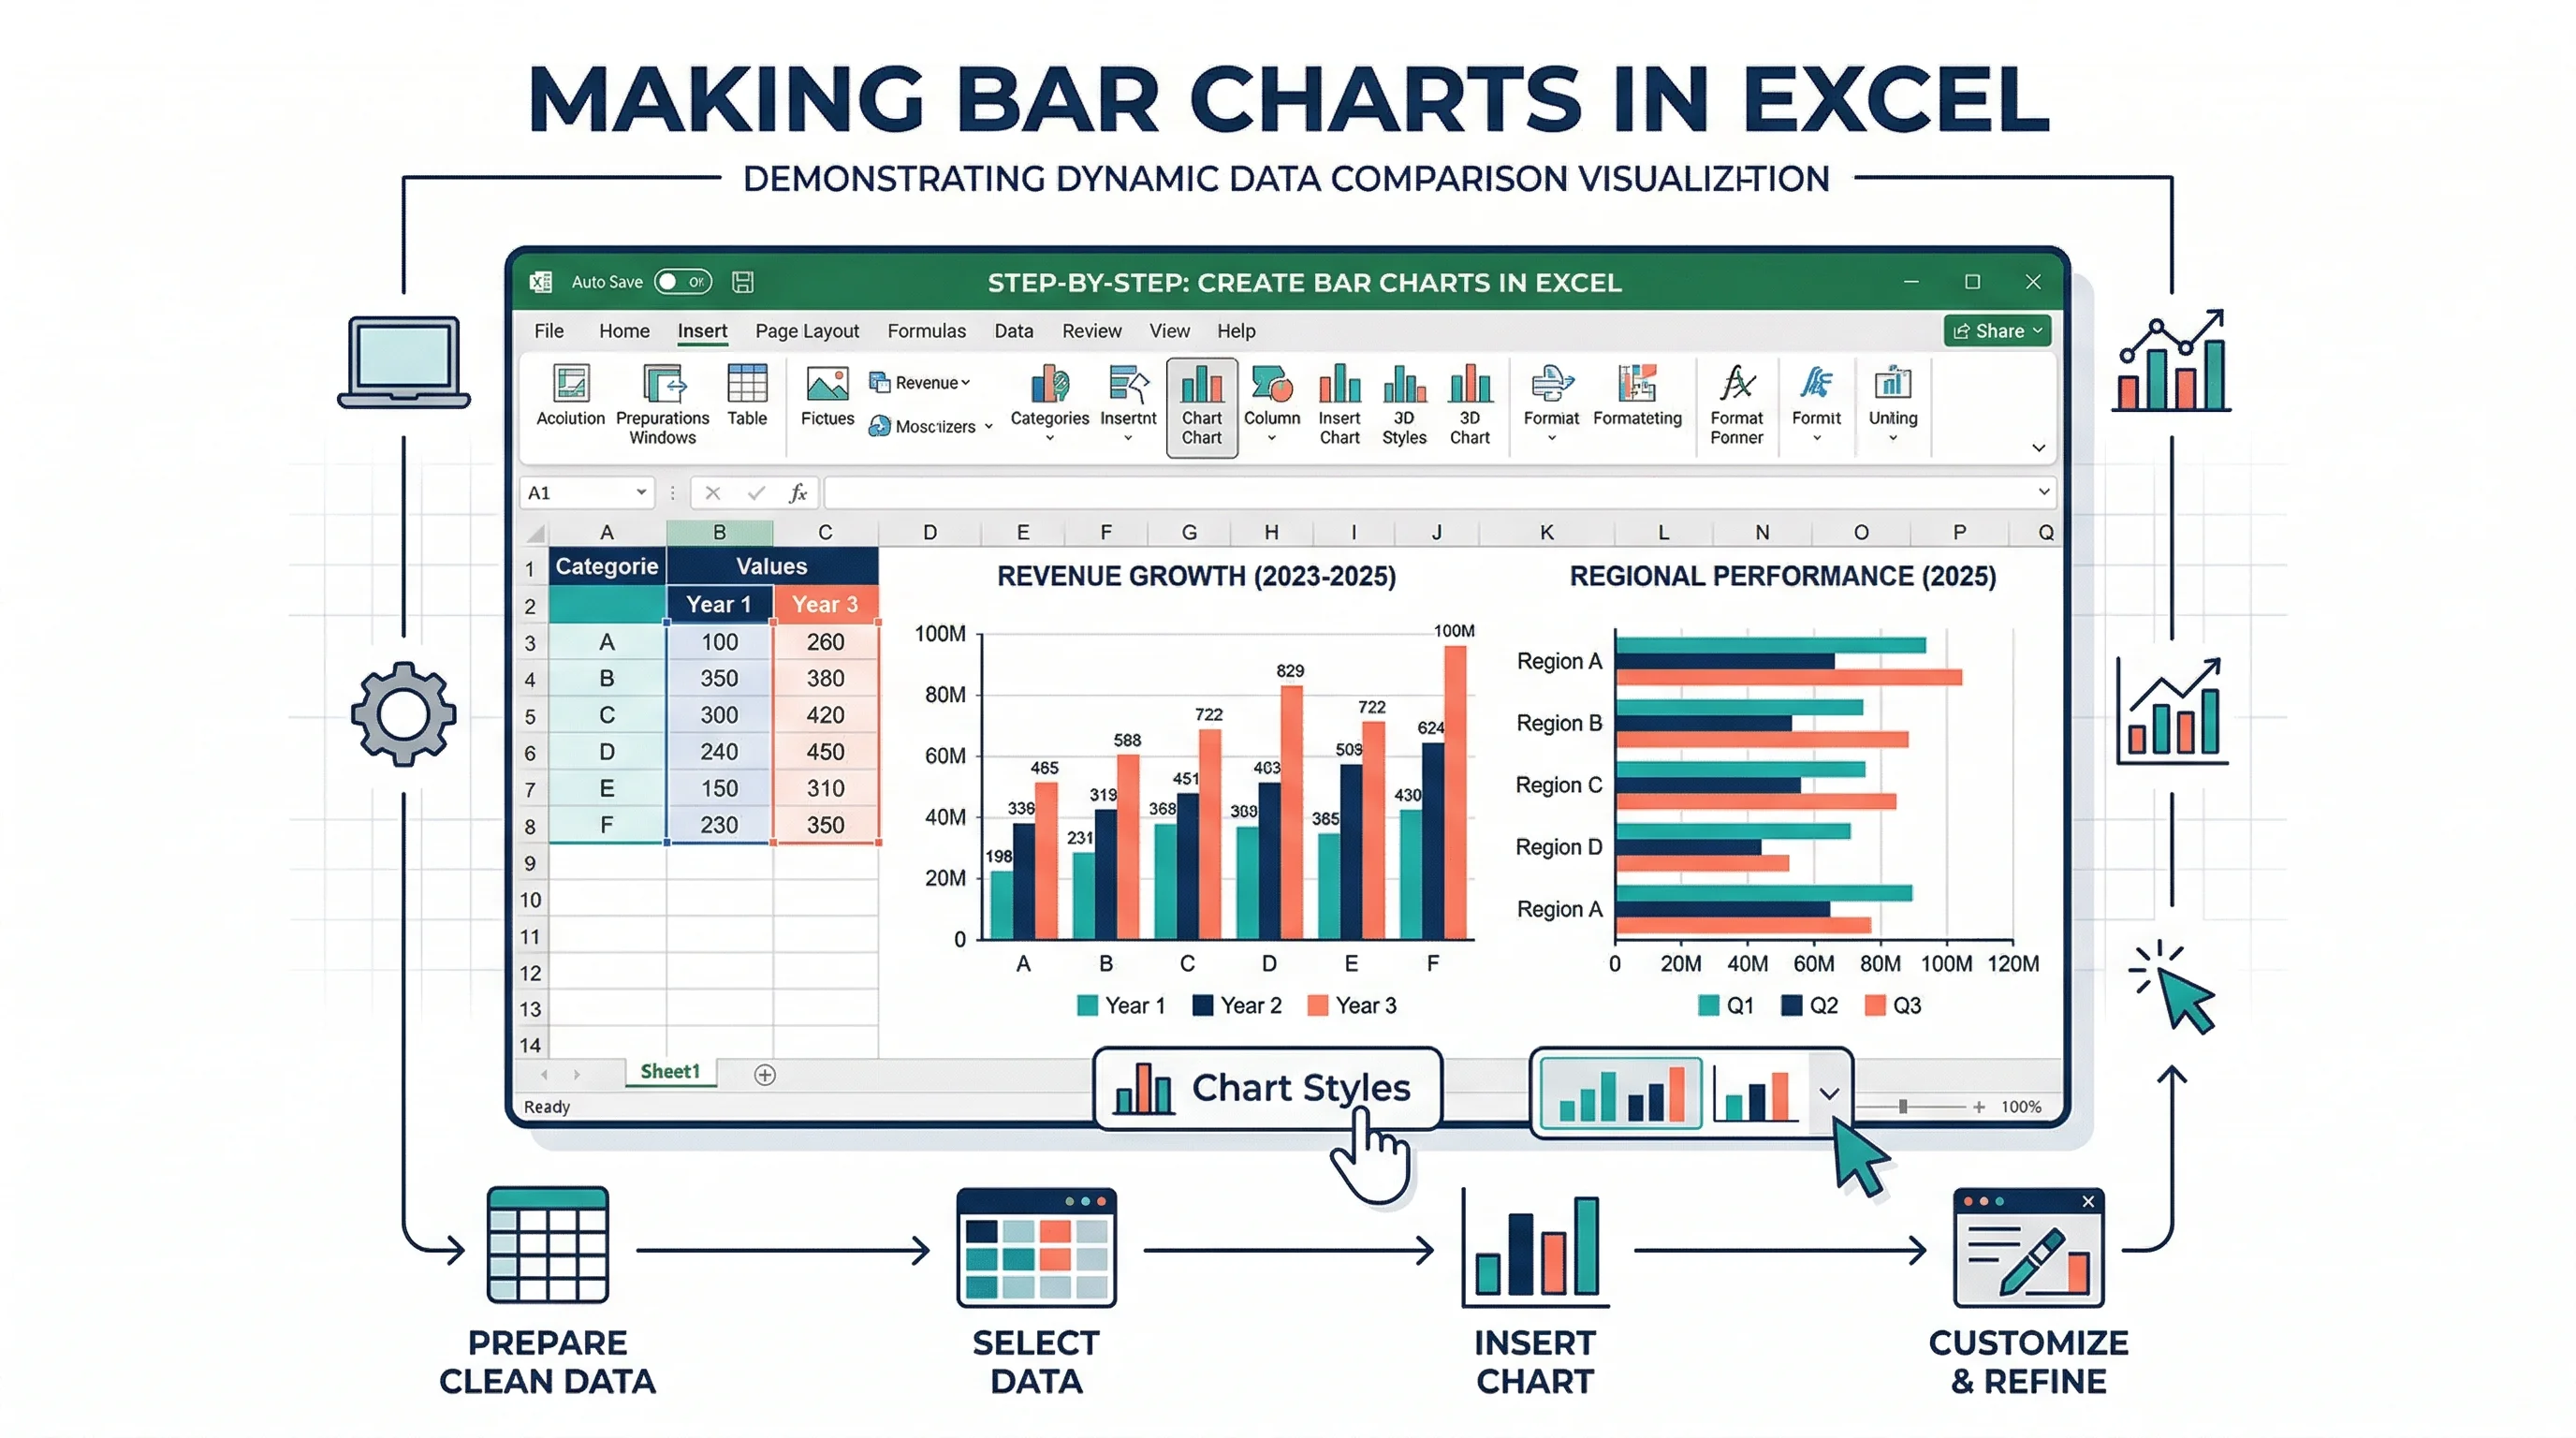
How to Make a Bar Chart in Excel: Step-by-Step Guide (2026)
Learn how to create a bar chart in Excel, sort categories, adjust gap width, add labels, and choose between bar and column charts, with official references.
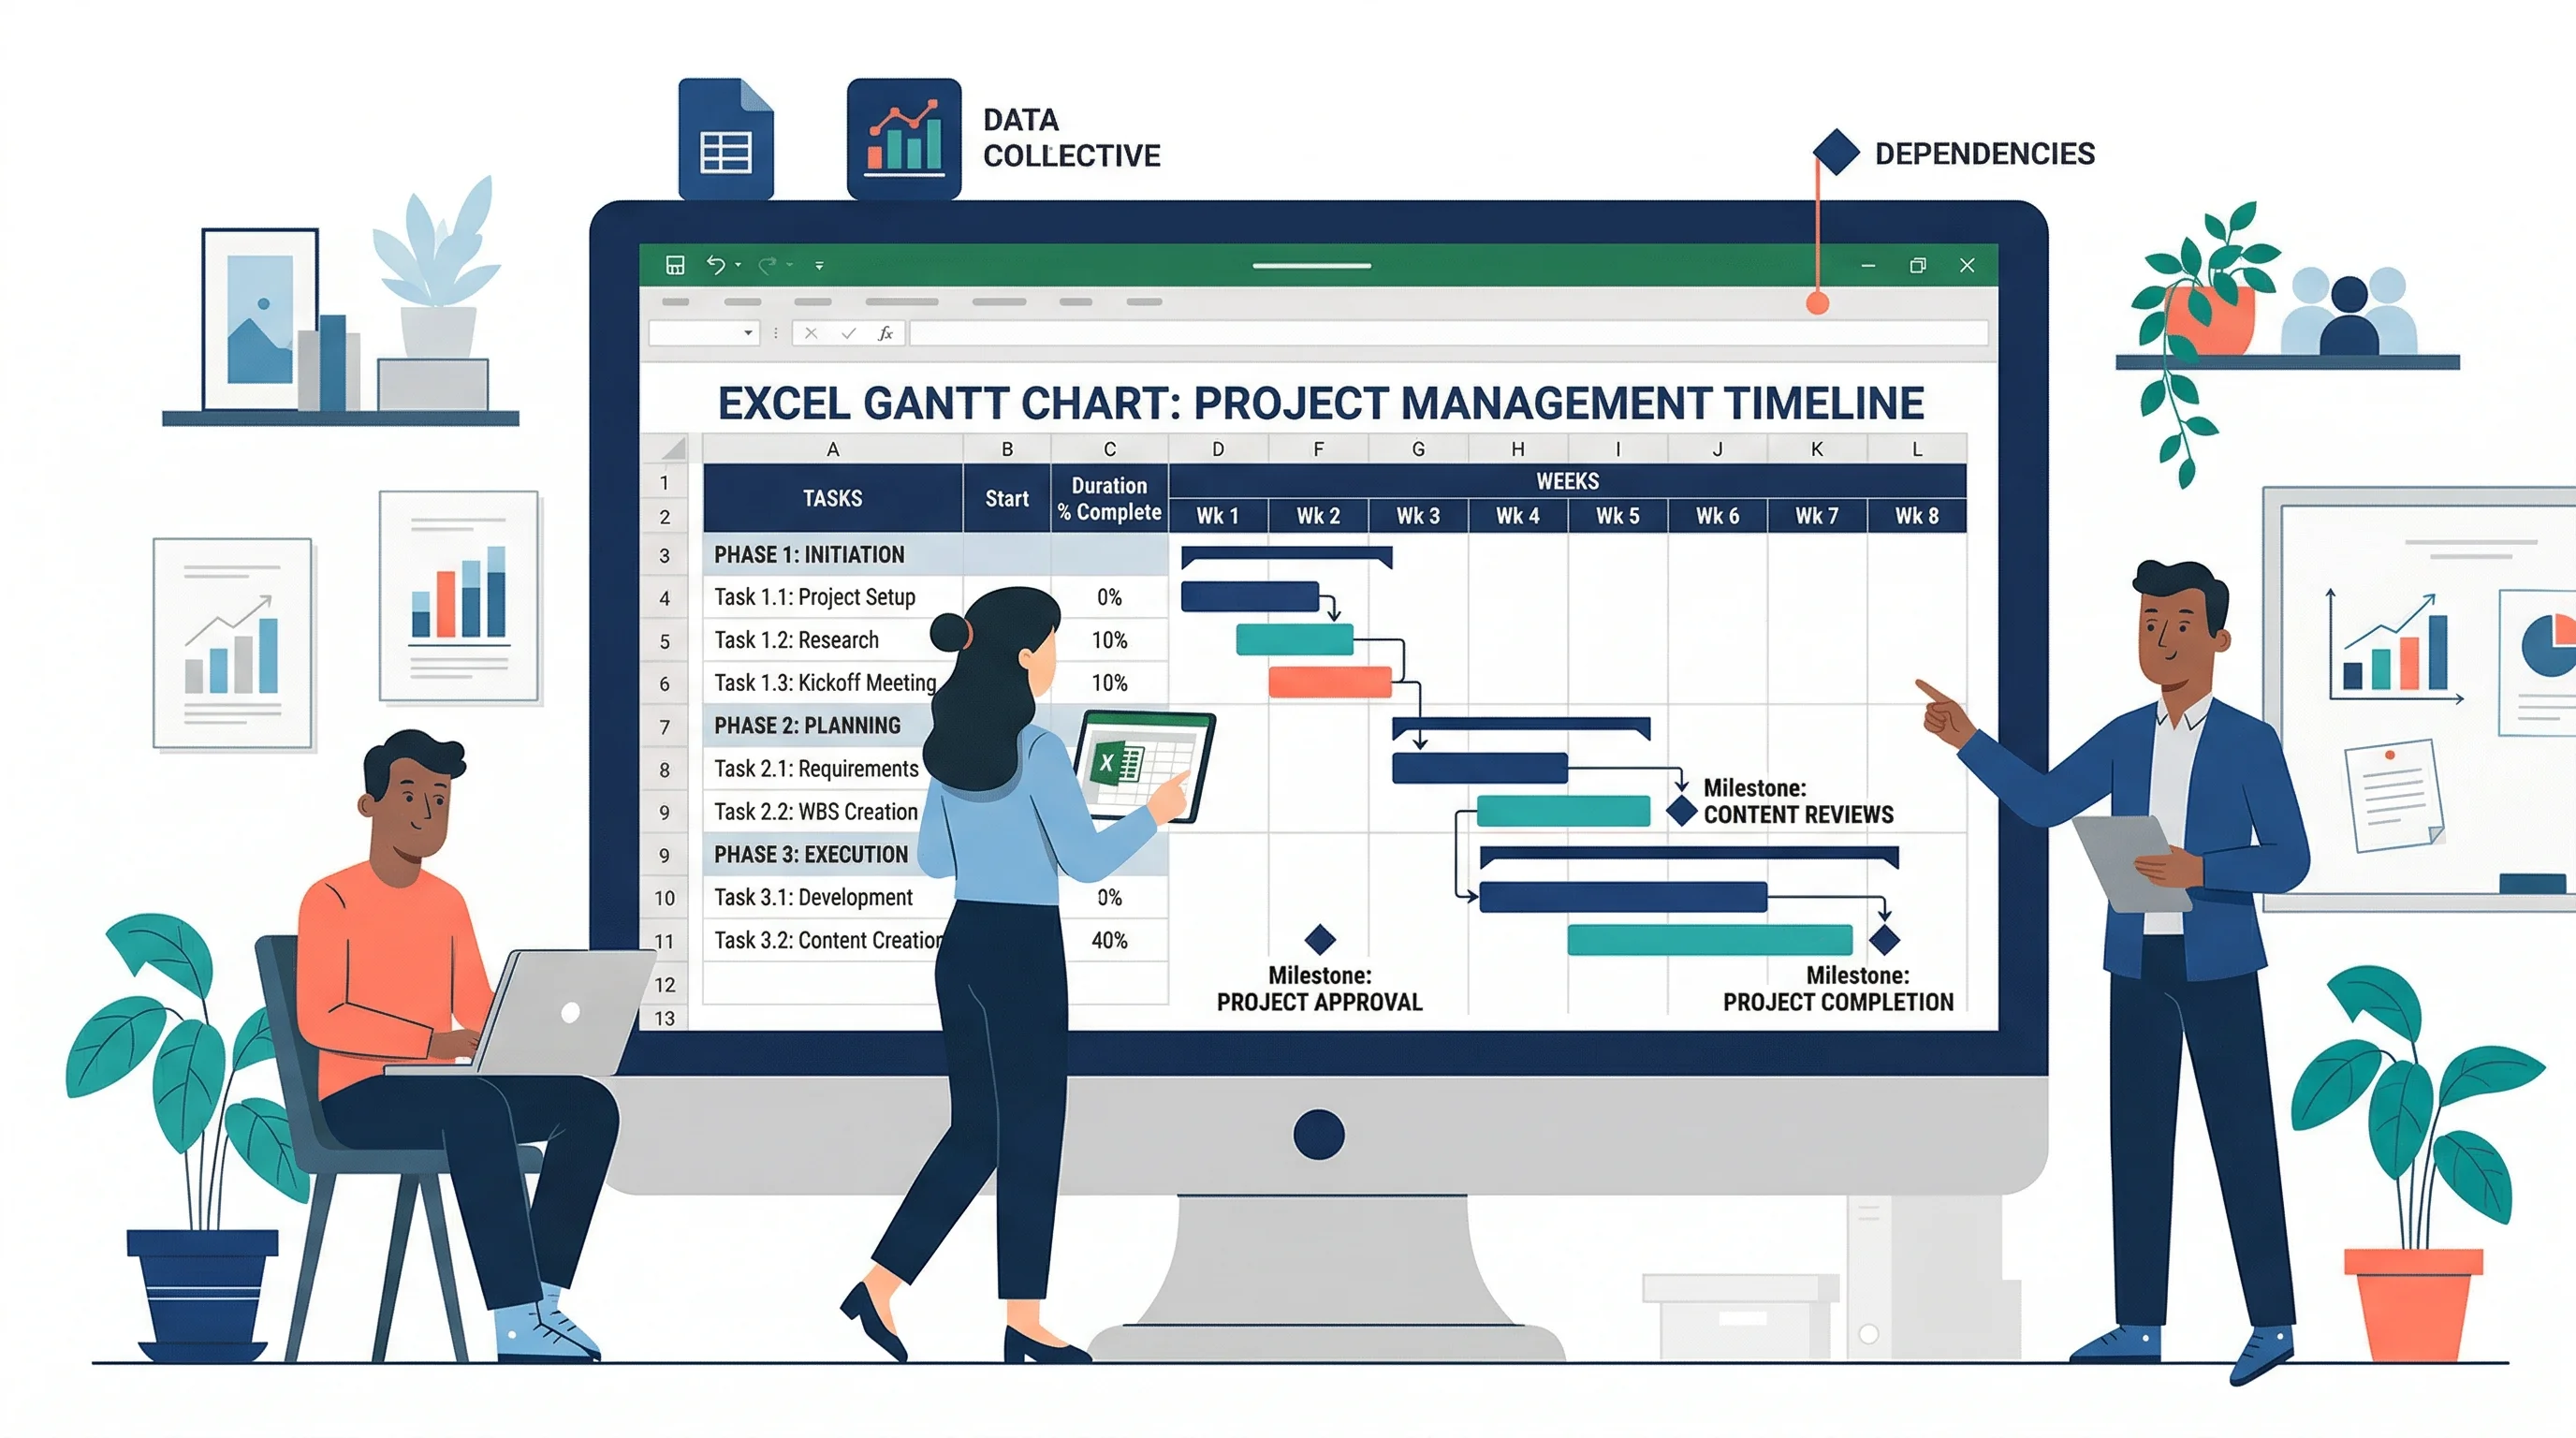
How to Make a Gantt Chart in Excel: Step-by-Step Project Timing Guide (2026)
Learn how to build a Gantt chart in Excel using a stacked bar chart, start dates, duration formulas, and milestone formatting, with official references.