")
ER Diagram Guide: How to Design Entity-Relationship Diagrams Step by Step (2026)
Learn how to draw ER diagrams from scratch with this step-by-step guide. Covers Chen and Crow's Foot notation, design best practices, real examples, free tools, and tips for research databases.
Entity relationship diagrams (ER diagrams or ERDs) are one of the most powerful tools for organizing, planning, and communicating the data structure behind any research project. Whether you are designing a clinical trial database, mapping survey variables, or modeling a complex multi-table dataset for your dissertation, a well-constructed ER diagram brings clarity to your work and credibility to your methodology.
This complete guide covers everything researchers need to know about ER diagrams--from foundational concepts and notation types to step-by-step creation instructions, tool comparisons, and best practices for academic use.
Text to Diagram Generator
Create professional ER diagrams from plain-text descriptions instantly. Supports Chen and Crow's Foot notation for research projects.
Try it free →What Is an ER Diagram?
An entity relationship diagram (ERD) is a visual representation of the data entities within a system and the relationships between them. Originally introduced by Peter Chen in 1976, ER diagrams have become the standard method for modeling relational databases.
In research contexts, an ER diagram serves as a blueprint for your study's data architecture. It shows:
- Entities: The main objects or concepts you are collecting data about (e.g., Participants, Experiments, Variables)
- Attributes: The properties or fields that describe each entity (e.g., participant_id, age, treatment_group)
- Relationships: How entities connect to one another (e.g., a Participant enrolls in a Study)
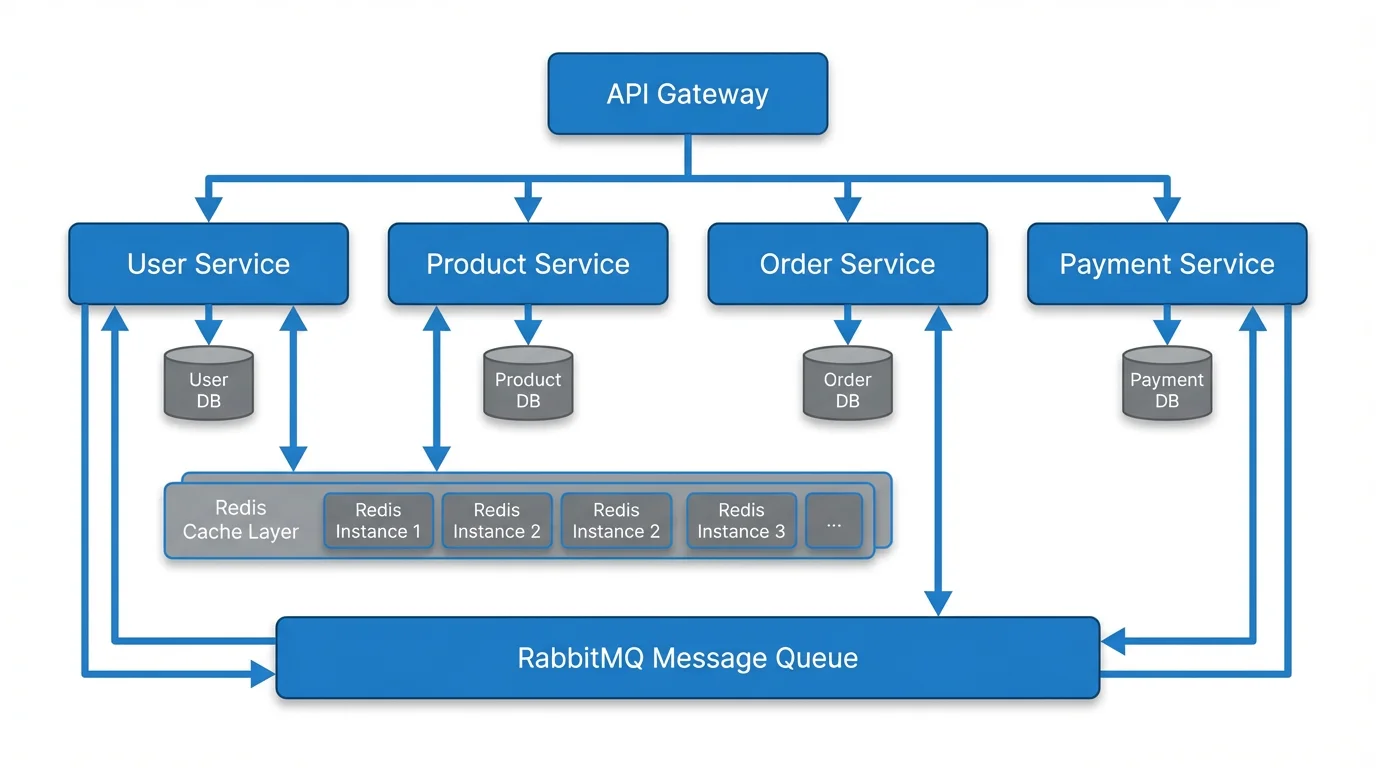
ER diagrams share structural similarities with data pipeline diagrams--both map how distinct components connect and interact within a system
Why Researchers Need ER Diagrams
| Benefit | Description |
|---|---|
| Data organization | Clarifies what data you need to collect before you begin |
| Integrity | Ensures referential integrity between related datasets |
| Communication | Helps collaborators and advisors understand your data model |
| Scalability | Makes it easier to expand your database as the study grows |
| Reproducibility | Documents your data structure for replication studies |
If you are working on a thesis or dissertation, the ER diagram often appears in the methodology chapter alongside your conceptual framework and research design.
Core Components of an ER Diagram
Before drawing your first diagram, you need to understand the three building blocks.
1. Entities
An entity represents a real-world object or concept about which you store data. In research, common entities include:
- Participant or Subject
- Experiment or Trial
- Measurement or Observation
- Instrument or Survey
- Publication or Dataset
Entities are typically drawn as rectangles in ER diagrams. Each entity becomes a table in your relational database.
2. Attributes
Attributes describe the properties of an entity. They are drawn as ovals connected to their parent entity (in Chen notation) or listed inside the entity rectangle (in Crow's Foot notation).
Attribute types include:
| Type | Symbol | Example |
|---|---|---|
| Simple | Single oval | participant_name |
| Composite | Oval with sub-ovals | full_name (first, last) |
| Derived | Dashed oval | age (derived from date_of_birth) |
| Multi-valued | Double oval | phone_numbers |
| Key | Underlined | participant_id (primary key) |
3. Relationships
Relationships describe how entities interact. They are drawn as diamonds (Chen notation) or lines with specific endpoints (Crow's Foot notation).
Cardinality types:
| Cardinality | Meaning | Example |
|---|---|---|
| One-to-One (1:1) | Each entity instance relates to exactly one of the other | One participant has one consent form |
| One-to-Many (1:N) | One entity instance relates to many of the other | One researcher supervises many experiments |
| Many-to-Many (M:N) | Multiple instances relate to multiple instances | Many participants take many surveys |
ER Diagram Notation Types
There are three major notation systems used for ER diagrams. Understanding them helps you choose the right one for your research context and read diagrams from other sources.
Chen Notation
The original notation introduced by Peter Chen in 1976. It uses:
- Rectangles for entities
- Ovals for attributes
- Diamonds for relationships
- Lines connecting components
┌──────────────┐         ◇──────────◇         ┌──────────────┐
│  Participant  │────────│  Enrolls   │────────│    Study      │
└──────────────┘         ◇──────────◇         └──────────────┘
       │                                              │
    (name)                                        (title)
    (age)                                        (start_date)
    (id)*                                        (study_id)*
Best for: Academic settings, conceptual modeling, and classroom instruction. Chen notation is the most commonly taught in database courses.
Crow's Foot Notation (IE Notation)
The most widely used notation in industry and practical database design. It uses:
- Rectangles with attributes listed inside
- Lines with specific endpoint symbols for cardinality
- Circle (zero), dash (one), crow's foot (many) at line endpoints
┌─────────────────┐          ┌─────────────────┐
│   Participant    │          │      Study       │
├─────────────────┤          ├─────────────────┤
│ participant_id   │──────<  │ study_id          │
│ name             │          │ title             │
│ age              │          │ start_date        │
│ email            │          │ principal_inv     │
└─────────────────┘          └─────────────────┘
Best for: Practical database implementation, software development, and detailed data modeling for research databases.
UML Class Diagram Notation
Unified Modeling Language (UML) notation extends beyond databases to model entire systems. It uses:
- Rectangles divided into sections (name, attributes, methods)
- Lines with multiplicity indicators (1, 0.., 1..)
- Association, aggregation, and composition symbols
Best for: Complex research systems involving both data and behavior, software-intensive projects, and interdisciplinary teams familiar with UML.
Which Notation Should You Use?
| Scenario | Recommended Notation |
|---|---|
| Thesis/dissertation methodology chapter | Chen (most recognizable in academia) |
| Building a research database in SQL | Crow's Foot (maps directly to tables) |
| Multi-disciplinary software project | UML (broader coverage) |
| Quick conceptual sketch | Chen (simplest to hand-draw) |
How to Draw an ER Diagram: Step-by-Step Guide
Whether you are sketching on paper or using a digital tool, the process for creating an ER diagram follows the same logical steps. This section walks you through how to draw an ER diagram from scratch, from initial planning through to the final polished diagram.
Step 1: Define Your Research Data Requirements
Start by listing everything your study needs to track. Ask yourself:
- What subjects or participants am I studying?
- What measurements or observations will I collect?
- What instruments or tools generate the data?
- What contextual variables (time, location, group) matter?
- What relationships exist between these elements?
Example: A clinical psychology study might need to track participants, therapy sessions, assessment scores, therapists, and treatment protocols.
Step 2: Identify Entities
From your data requirements list, extract the main nouns--these become your entities. Each entity should represent a distinct concept that has its own set of attributes.
Guidelines:
- Each entity should have a unique identifier (primary key)
- Avoid redundancy--if two entities always share the same attributes, they might be one entity
- Consider whether a concept is truly an entity or just an attribute of another entity
Step 3: Define Attributes for Each Entity
For every entity, list its properties. Determine:
- Which attribute is the primary key (unique identifier)?
- Are any attributes derived from others?
- Are any attributes multi-valued?
- Which attributes are required vs. optional?
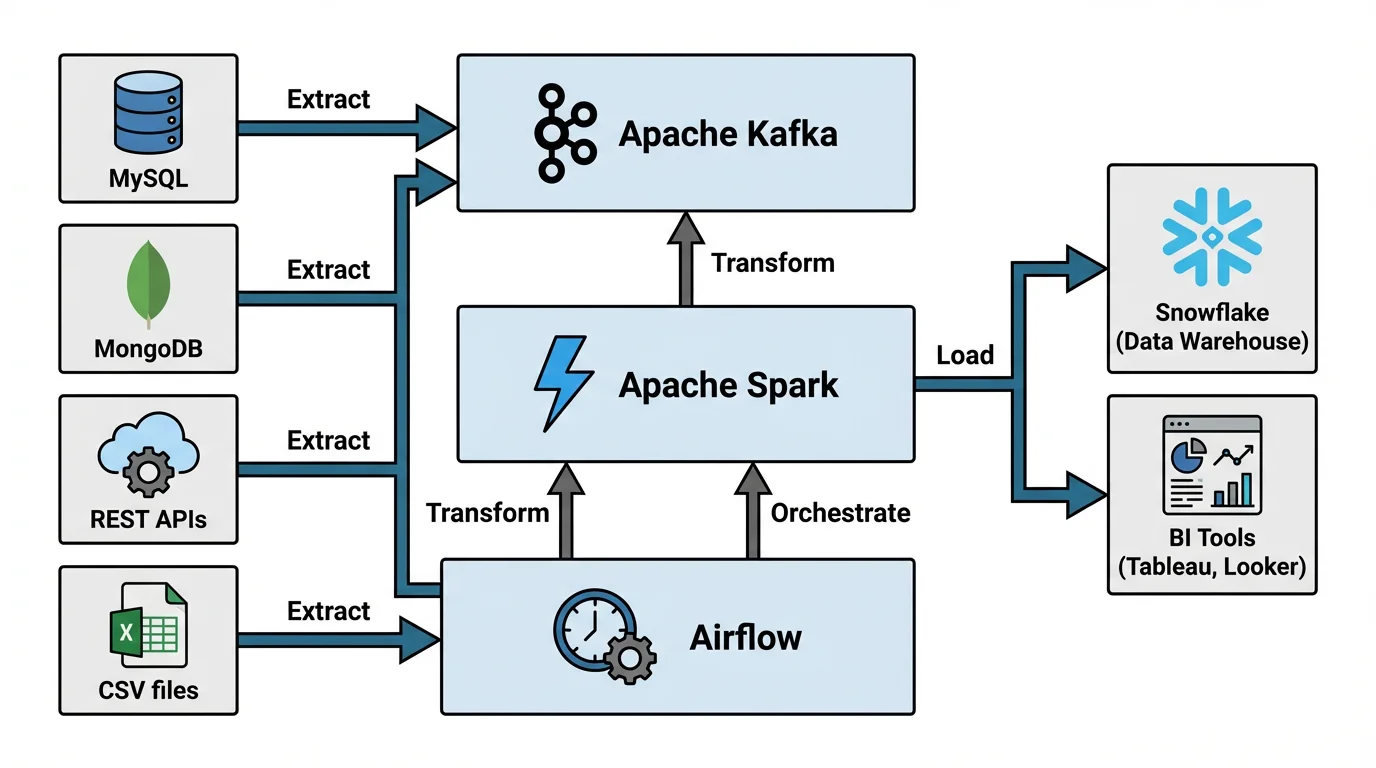
Like software architecture diagrams, ER diagrams require careful identification of components and their interconnections
Step 4: Establish Relationships
For each pair of related entities, determine:
- Does a relationship exist? Not all entities are directly related.
- What is the cardinality? One-to-one, one-to-many, or many-to-many?
- Is participation total or partial? Must every instance participate in the relationship?
- What verb describes the relationship? (e.g., "enrolls in", "measures", "supervises")
Step 5: Handle Many-to-Many Relationships
Many-to-many relationships cannot be directly implemented in relational databases. You need to create a junction table (also called an associative entity or bridge table).
Example:
Participant ←→ Survey    (Many-to-Many)

Becomes:

Participant ──→ ParticipantSurvey ←── Survey
                 │ participant_id
                 │ survey_id
                 │ completion_date
                 │ score
The junction table ParticipantSurvey holds the foreign keys from both entities plus any attributes specific to that relationship.
Step 6: Normalize Your Design
Apply normalization rules to eliminate data redundancy:
- 1NF: Each cell contains a single value; no repeating groups
- 2NF: All non-key attributes depend on the entire primary key
- 3NF: No non-key attribute depends on another non-key attribute
Step 7: Draw and Refine
Choose your notation and create the visual diagram. Then:
- Review with your advisor or data manager
- Test by mapping your actual data to the diagram
- Iterate as your understanding of the data deepens
ER Diagram Examples for Research
Example 1: Survey Research Database
A social science study collecting survey responses from multiple sites:
┌─────────────────┐     ┌─────────────────┐     ┌─────────────────┐
│   Participant    │     │    Response      │     │     Survey      │
├─────────────────┤     ├─────────────────┤     ├─────────────────┤
│ participant_id PK│──┐  │ response_id PK  │  ┌──│ survey_id PK    │
│ name             │  └─>│ participant_id FK│  │  │ title           │
│ age              │     │ survey_id FK    │<─┘  │ version         │
│ gender           │     │ question_id FK  │     │ created_date    │
│ site_id FK       │     │ answer_value    │     └─────────────────┘
└─────────────────┘     │ submitted_at    │
                        └─────────────────┘
         │                                        ┌─────────────────┐
         └───────────────────────────────────────>│      Site       │
                                                  ├─────────────────┤
                                                  │ site_id PK      │
                                                  │ location        │
                                                  │ coordinator     │
                                                  └─────────────────┘
Example 2: Clinical Trial Database
A medical research study tracking patients, treatments, and outcomes:
┌─────────────────┐     ┌─────────────────┐     ┌─────────────────┐
│    Patient       │     │   Treatment     │     │    Outcome      │
├─────────────────┤     ├─────────────────┤     ├─────────────────┤
│ patient_id PK   │──┐  │ treatment_id PK │──┐  │ outcome_id PK   │
│ demographics     │  └─>│ patient_id FK   │  └─>│ treatment_id FK │
│ diagnosis        │     │ drug_id FK      │     │ measure_type    │
│ enrollment_date  │     │ dosage          │     │ value           │
│ consent_status   │     │ start_date      │     │ recorded_date   │
└─────────────────┘     │ end_date        │     └─────────────────┘
                        └─────────────────┘
Example 3: Ecological Research Database
A biodiversity study tracking species observations across field sites:
┌─────────────────┐     ┌─────────────────┐     ┌─────────────────┐
│    Species       │     │  Observation    │     │   Field Site    │
├─────────────────┤     ├─────────────────┤     ├─────────────────┤
│ species_id PK   │──┐  │ observation_id PK│ ┌──│ site_id PK      │
│ scientific_name  │  └─>│ species_id FK   │ │  │ gps_coordinates │
│ common_name      │     │ site_id FK      │<┘  │ habitat_type    │
│ taxonomy_class   │     │ count           │     │ elevation       │
│ conservation_st  │     │ date_observed   │     │ region          │
└─────────────────┘     │ observer_id FK  │     └─────────────────┘
                        └─────────────────┘
For more guidance on structuring research data visually, see our research data visualization best practices guide.
Best ER Diagram Tools for Researchers
Choosing the right ER diagram tool depends on your technical comfort level, budget, and specific needs. Here is a comparison of the most popular options in 2026.
Free ER Diagram Tools
| Tool | Type | Best For | Key Feature |
|---|---|---|---|
| draw.io (diagrams.net) | Visual drag-and-drop | General diagramming | Free, no account required |
| ERDPlus | Web-based | Students and academics | Purpose-built for ERDs |
| dbdiagram.io | Code-based | Developers | Write markup, get diagrams |
| Mermaid | Code-based | Documentation | Integrates with Markdown |
| ChartDB | Open-source | Technical users | Full SQL generation |
Paid ER Diagram Tools
| Tool | Starting Price | Best For | Key Feature |
|---|---|---|---|
| Lucidchart | $7.95/mo | Teams and collaboration | Real-time collaboration |
| MySQL Workbench | Free (open-source) | MySQL databases | Forward/reverse engineering |
| Microsoft Visio | $5/mo | Enterprise | Microsoft ecosystem integration |
AI-Powered Diagram Generation
For researchers who want to quickly generate diagrams from text descriptions, AI-powered tools offer a compelling alternative to manual drawing.
Text to Diagram Generator
Transform text descriptions into professional diagrams instantly. Describe your ER diagram in plain language and get a polished visual output.
Try it free →With a text-to-diagram tool, you can describe your entities and relationships in natural language and generate a structured diagram in seconds--ideal for early-stage research planning when your data model is still evolving. Simply describe entities like "Patient has patient_id, name, diagnosis" and relationships like "Patient receives Treatment," and the tool generates a clean ER diagram you can export.
ER Diagrams in the Research Workflow
During the Research Design Phase
Create your initial ER diagram during research design, alongside your conceptual framework. The two diagrams serve complementary purposes:
- Your conceptual framework shows the theoretical relationships between research variables
- Your ER diagram shows the practical data structure needed to test those relationships
During Data Collection
A well-designed ER diagram ensures that your data collection instruments capture the right information in the right format. It prevents:
- Missing data fields that you need later for analysis
- Redundant data entry across multiple forms
- Inconsistent formatting between related records
During Analysis
When you need to join tables, filter records, or aggregate data, your ER diagram serves as a reference map. It tells you:
- Which tables to join and on which keys
- Where to find specific variables
- How to trace relationships across your dataset
During Writing
Include a simplified version of your ER diagram in your methodology chapter. This demonstrates to reviewers and committee members that your data collection was systematic and well-planned. For guidance on structuring your manuscript, see our research manuscript writing guide.
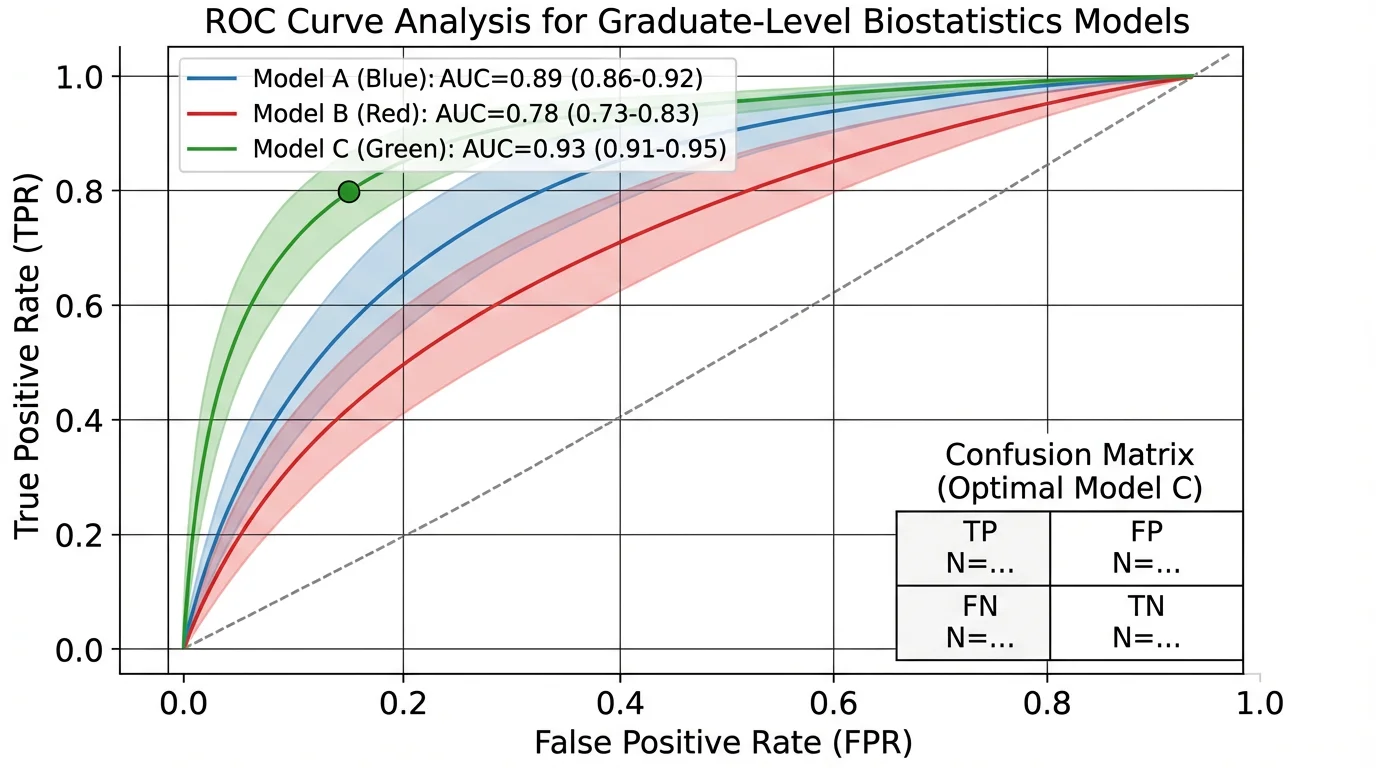
Rigorous data analysis depends on well-structured underlying databases--ER diagrams ensure your data architecture supports the analysis you need
Best Practices for Research ER Diagrams
1. Start Simple, Then Expand
Begin with a high-level conceptual ER diagram showing just entities and relationships. Add attributes and constraints in subsequent iterations.
2. Use Consistent Naming Conventions
| Convention | Example | Use When |
|---|---|---|
| snake_case | participant_id | SQL databases |
| camelCase | participantId | Programming interfaces |
| PascalCase | ParticipantId | Entity names |
Pick one convention and apply it consistently across your entire diagram.
3. Document Your Design Decisions
Keep a data dictionary alongside your ER diagram that explains:
- Why each entity exists
- What each attribute represents
- Why relationships have their specific cardinality
- Any constraints or business rules
4. Plan for Data Growth
Research projects often collect more data than initially planned. Design your ER diagram with flexibility in mind:
- Use surrogate keys (auto-incremented IDs) rather than natural keys
- Include timestamp fields for auditing
- Consider versioning for entities that change over time
5. Validate with Real Data
Before finalizing your ER diagram, test it with a small sample of actual data. This reveals:
- Missing attributes you forgot to include
- Relationships that do not work as expected
- Normalization issues causing data redundancy
6. Keep Visual Clarity
A cluttered diagram defeats its purpose. Follow these visual design principles:
- Limit to 10-15 entities per diagram; split larger models into sub-diagrams
- Use color coding to group related entities (e.g., blue for participant data, green for measurement data)
- Maintain consistent spacing and alignment
- Include a legend explaining your notation
For color guidance, refer to our scientific color palette guide.
Common Mistakes in Research ER Diagrams
Mistake 1: Confusing Entities with Attributes
Wrong: Creating a separate "Address" entity when address is just an attribute of "Participant."
Right: Only create a separate entity when the concept has its own attributes and participates in independent relationships.
Mistake 2: Ignoring Normalization
Storing repeated data (like a therapist's name in every session record) leads to update anomalies and inconsistencies.
Fix: Normalize your design to at least 3NF. Create a separate Therapist entity with a foreign key reference in Session.
Mistake 3: Missing Junction Tables
Implementing many-to-many relationships without a junction table causes data integrity problems.
Fix: Always decompose M:N relationships into two 1:N relationships through a junction table.
Mistake 4: Over-Engineering
Creating 50 entities with every conceivable attribute for a study that only needs 5 core tables.
Fix: Start with what your research questions require. You can always add more later.
Mistake 5: No Primary Keys
Every entity must have a primary key--a unique identifier for each record.
Fix: Add a dedicated ID field (e.g., participant_id) as the primary key for every entity, even if a natural key exists.
Frequently Asked Questions
What is an ER diagram and why is it important for research?
An ER diagram (entity relationship diagram) is a visual representation of the data entities in a system and the relationships between them. For research, it is important because it serves as a blueprint for your study's database, ensuring data integrity, preventing redundancy, and communicating your data architecture to collaborators and reviewers.
What is the difference between Chen notation and Crow's Foot notation?
Chen notation uses rectangles for entities, ovals for attributes, and diamonds for relationships--it is the most commonly taught in academic settings. Crow's Foot notation lists attributes inside entity rectangles and uses specific line-end symbols (crow's foot, dash, circle) to indicate cardinality. Crow's Foot is more compact and commonly used in practical database design.
Can I use an ER diagram for qualitative research?
Yes. While ER diagrams are most commonly associated with quantitative research databases, qualitative researchers can use them to model the structure of their coding schemes, organize interview and observation data, or plan the architecture of qualitative data analysis software databases like NVivo or ATLAS.ti projects.
How many entities should my ER diagram have?
For most research projects, 5 to 15 entities are typical. A simple survey study might need only 3-5 entities (Participant, Survey, Response), while a complex clinical trial could require 10-15 (Patient, Treatment, Drug, Outcome, Adverse Event, Site, Investigator, etc.). If your diagram exceeds 15 entities, consider splitting it into sub-diagrams.
What is the best free ER diagram tool for students?
ERDPlus is purpose-built for academic use and completely free, making it ideal for students. For more flexibility, draw.io (diagrams.net) offers a full-featured diagramming tool with no account required. If you prefer writing markup instead of dragging shapes, dbdiagram.io is excellent for quickly generating ER diagrams from code.
How do I convert an ER diagram to a real database?
Each entity becomes a table, each attribute becomes a column, and relationships become foreign key constraints. One-to-many relationships place a foreign key in the 'many' side table. Many-to-many relationships require a junction table with foreign keys from both entities. Tools like MySQL Workbench and dbdiagram.io can generate SQL code directly from your ER diagram.
What is a junction table and when do I need one?
A junction table (also called an associative entity or bridge table) resolves many-to-many relationships by creating a new table that holds foreign keys from both related entities. For example, if Participants take multiple Surveys and each Survey has multiple Participants, you need a ParticipantSurvey junction table containing participant_id and survey_id.
Should I include my ER diagram in my thesis or dissertation?
Yes, including an ER diagram in your methodology chapter demonstrates that your data collection was systematic and well-planned. Use a simplified version showing key entities and relationships. You can include the full detailed diagram in an appendix. This is especially important for studies involving custom databases or complex multi-table data structures.
Conclusion
An ER diagram is more than a technical artifact--it is a research planning tool that brings structure and rigor to your data management. By mapping your entities, attributes, and relationships before data collection begins, you ensure that your database can support the analyses your research questions demand.
Key takeaways:
- Choose the right notation -- Chen for academic presentations, Crow's Foot for implementation
- Start with your research questions -- every entity and relationship should serve your study's goals
- Normalize your design -- eliminate redundancy to maintain data integrity
- Use the right tool -- from free options like ERDPlus and draw.io to AI-powered generators for rapid prototyping
- Document everything -- a data dictionary alongside your ER diagram makes your research reproducible
- Iterate and refine -- your ER diagram should evolve as your understanding of the data deepens
Whether you are building a small survey database or a complex multi-site clinical trial system, the time invested in creating a proper ER diagram pays dividends throughout your entire research project.
Additional Resources
- How to Create a Conceptual Framework for Research
- Research Data Visualization Best Practices
- How to Write a Research Manuscript in IMRAD Format
- Scientific Color Palette for Research Papers
- How to Make Scientific Diagrams for Research Papers
Ready to create your ER diagram? Try ConceptViz's Text to Diagram Generator to transform plain-language descriptions into professional diagrams instantly.
Категории
Ещё публикации
")
How to Make a Gantt Chart in Excel: Step-by-Step Project Timing Guide (2026)
Learn how to build a Gantt chart in Excel using a stacked bar chart, start dates, duration formulas, and milestone formatting. Includes Microsoft and ExcelJet references.
")
Lucidspark Alternatives: 8 Best Free Tools (2026)
Compare the 8 best free Lucidspark alternatives for 2026. FigJam, Miro, Excalidraw, Canva Whiteboard & more — unlimited brainstorming without the paywall.
: размеры A0 и A1")
Лучшие шрифты для научных постеров и иллюстраций (2026): размеры A0 и A1
Какой шрифт выбрать для научного постера? Практическое руководство по шрифтам для A0 и A1, академической типографике, требованиям журналов и бесплатным альтернативам.