Créateur d'Arbre Phylogénétique Propulsé par l'IA
Décrivez les organismes et leurs relations évolutives, et notre IA générera instantanément un arbre phylogénétique professionnel. Idéal pour la phylogénétique moléculaire, la taxonomie, l'épidémiologie et la biologie évolutive.
Générateur d'Arbre Phylogénétique
By using ConceptViz, you agree not to generate or edit adult, sexual, explicit, unsafe, or policy-violating content. See Content Policy.
Gratuit à essayer ·
Votre arbre phylogénétique apparaîtra ici
Décrivez les organismes et les relations, puis cliquez sur Générer
Exemples d'Arbres Phylogénétiques
Parcourez des exemples d'arbres phylogénétiques de divers domaines ou générez le vôtre ci-dessus
Arbre Phylogénétique des Mammifères
Phylogénie complète des mammifères illustrant la radiation des principaux ordres, des monotrèmes aux primates, avec les temps de divergence estimés en millions d'années.
Arbre d'Évolution des Virus
Phylogénie moléculaire des familles de virus à ARN illustrant les relations évolutives, les taux de mutation et les événements de transmission inter-espèces.
Phylogénie de l'ARNr 16S Bactérien
Phylogénie du gène ARN ribosomal 16S des principaux phyla bactériens, le marqueur moléculaire standard utilisé pour la classification bactérienne et la métagénomique.
Phylogénie de l'Évolution des Plantes
Arbre évolutif des plantes terrestres montrant la progression des ancêtres aquatiques à travers les bryophytes, fougères, gymnospermes, jusqu'aux plantes à fleurs avec les adaptations clés annotées.
Phylogénie de la Migration Humaine
Phylogénie des haplogroupes d'ADN mitochondrial retraçant les schémas de migration humaine de l'Afrique vers tous les continents habités, avec les dates estimées de divergence.
Arbre de Famille de Protéines
Phylogénie moléculaire d'une superfamille de protéines illustrant la divergence des séquences, les domaines conservés et l'évolution fonctionnelle à travers les organismes modèles.
Qu'est-ce qu'un Arbre Phylogénétique ?
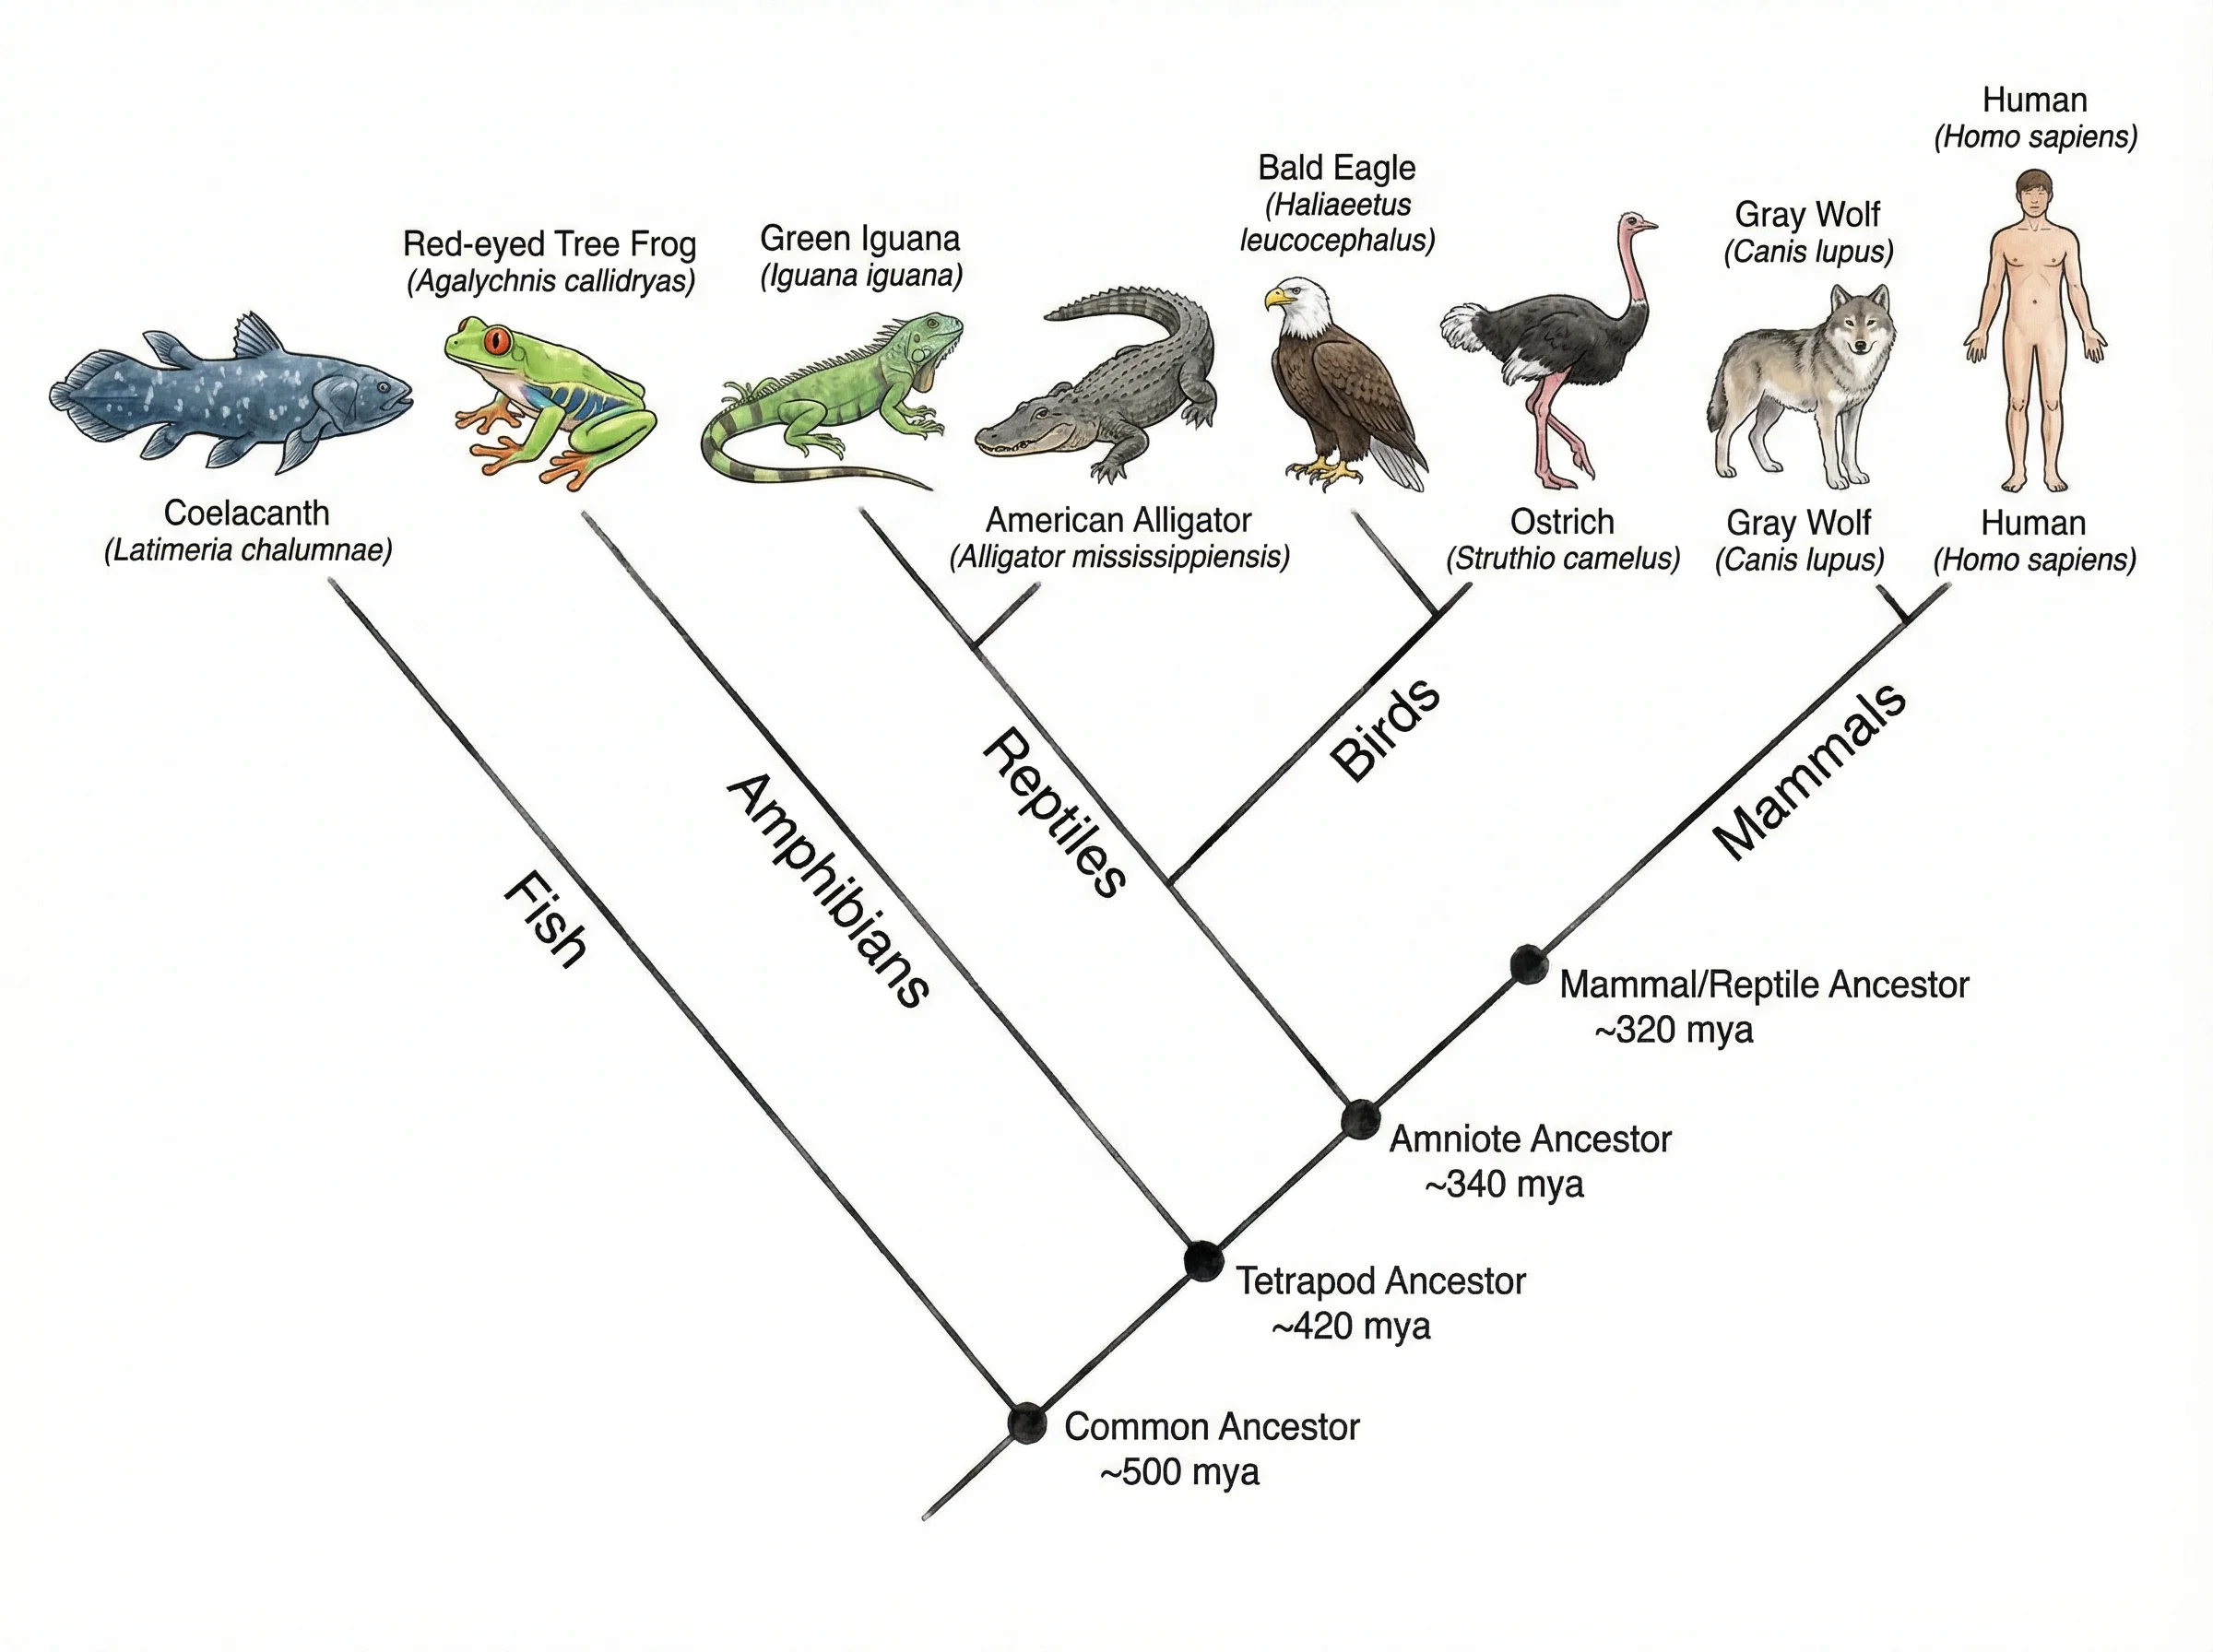
Un arbre phylogénétique est un diagramme ramifié qui représente les relations évolutives entre les entités biologiques — typiquement des espèces, des gènes ou des protéines. Chaque point de ramification (nœud interne) représente un ancêtre commun hypothétique, et les extrémités (nœuds terminaux ou feuilles) représentent les taxons comparés. Les longueurs de branches peuvent encoder le temps évolutif (chronogrammes), la distance génétique (phylogrammes), ou ne porter aucune signification quantitative (cladogrammes). Les arbres phylogénétiques constituent le cadre central de la biologie évolutive, fournissant une hypothèse visuelle de la façon dont les organismes sont apparentés par descendance avec modification. Ils sont construits à partir de caractères morphologiques, de données de séquences moléculaires (ADN, ARN ou protéines), ou d'une combinaison des deux.
Types d'Arbres Phylogénétiques
- Arbres racinés — possèdent un seul nœud ancestral (racine) représentant l'ancêtre commun le plus récent de tous les taxons ; la direction de l'évolution va de la racine aux extrémités
- Arbres non racinés — montrent les relations entre les taxons sans spécifier l'ancêtre commun ni la direction de l'évolution ; couramment produits par les méthodes de neighbor-joining et de maximum de vraisemblance
- Cladogrammes — les longueurs de branches sont uniformes et ne portent aucune information ; seule la topologie (motif de ramification) importe pour montrer les caractères dérivés partagés
- Phylogrammes — les longueurs de branches sont proportionnelles à la quantité de changement évolutif (par ex., substitutions nucléotidiques par site)
- Chronogrammes — les longueurs de branches sont proportionnelles au temps, avec les extrémités alignées au présent ; calibrés à l'aide de registres fossiles ou d'estimations d'horloge moléculaire
- Arbres circulaires (radiaux) — un arbre raciné dessiné en disposition circulaire pour afficher efficacement un grand nombre de taxons, couramment utilisé en métagénomique et en génomique comparative
Comment Lire un Arbre Phylogénétique
Lire correctement un arbre phylogénétique nécessite de se concentrer sur le motif de ramification plutôt que sur l'ordre des taxons aux extrémités. Deux taxons sont les plus étroitement apparentés s'ils partagent un ancêtre commun plus récent (nœud) qui exclut les autres taxons. La rotation des branches autour d'un nœud ne change pas les relations évolutives — seule la topologie compte. Les valeurs de bootstrap (typiquement 0-100) ou les probabilités postérieures aux nœuds indiquent le soutien statistique pour cet arrangement de ramification particulier. Des valeurs plus élevées signifient une confiance plus forte que le regroupement est correct. Les longueurs de branches dans les phylogrammes représentent la quantité de changement évolutif ; des branches plus longues indiquent une divergence génétique plus importante. Une barre d'échelle montre l'unité de mesure, comme les substitutions par site nucléotidique. Les groupes externes — des taxons connus pour être en dehors du groupe d'intérêt — sont utilisés pour raciner l'arbre et établir la direction de l'évolution.
Méthodes de Phylogénétique Moléculaire
- Alignement de séquences — la première étape, alignant les séquences homologues d'ADN, d'ARN ou de protéines pour identifier les positions conservées et variables à l'aide d'outils comme MUSCLE, MAFFT ou ClustalW
- Méthodes basées sur les distances — calculent les distances évolutives par paires et regroupent les taxons en conséquence ; neighbor-joining (NJ) est rapide et largement utilisé pour l'analyse exploratoire
- Parcimonie maximale — trouve l'arbre qui nécessite le moins de changements évolutifs pour expliquer les données de séquences observées ; efficace pour les taxons étroitement apparentés
- Maximum de vraisemblance (ML) — évalue la probabilité des données de séquences étant donné une topologie d'arbre et un modèle de substitution ; statistiquement rigoureux mais coûteux en calcul (par ex., RAxML, IQ-TREE)
- Inférence bayésienne — utilise l'échantillonnage de Monte Carlo par chaînes de Markov (MCMC) pour estimer les probabilités postérieures des topologies d'arbres étant donné les données et un modèle a priori (par ex., MrBayes, BEAST)
- Analyse de bootstrap — rééchantillonne les colonnes d'alignement avec remplacement pour évaluer la robustesse de chaque nœud ; des valeurs supérieures à 70-80% sont généralement considérées comme bien soutenues
Applications en Recherche Biologique
- Taxonomie et systématique — classification des organismes et révision de la nomenclature taxonomique basée sur les relations évolutives plutôt que sur la similarité superficielle
- Épidémiologie et santé publique — traçage de l'origine et de la propagation des pathogènes, identification des événements de transmission zoonotique et suivi de l'évolution des variants viraux en temps réel
- Biologie de la conservation — identification des espèces évolutivement distinctes et globalement menacées (EDGE) pour prioriser les efforts de conservation et préserver la diversité phylogénétique maximale
- Découverte de médicaments et génomique fonctionnelle — prédiction de la fonction des gènes et des protéines par orthologie phylogénétique, guidant la recherche de cibles thérapeutiques à travers les espèces
- Biogéographie et paléontologie — reconstruction des aires géographiques ancestrales et intégration des points de calibration fossile pour dater les événements évolutifs
- Métagénomique et recherche sur le microbiome — classification des communautés microbiennes à l'aide des phylogénies d'ARNr 16S/18S et compréhension de la structure des communautés écologiques
Questions Fréquentes
Plus d'Outils de Biologie
 Recherche
Générateur de Diagramme en Arbre
Créez des diagrammes arborescents hiérarchiques pour la taxonomie, la classification, les arbres de décision et les probabilités.
 Biologie
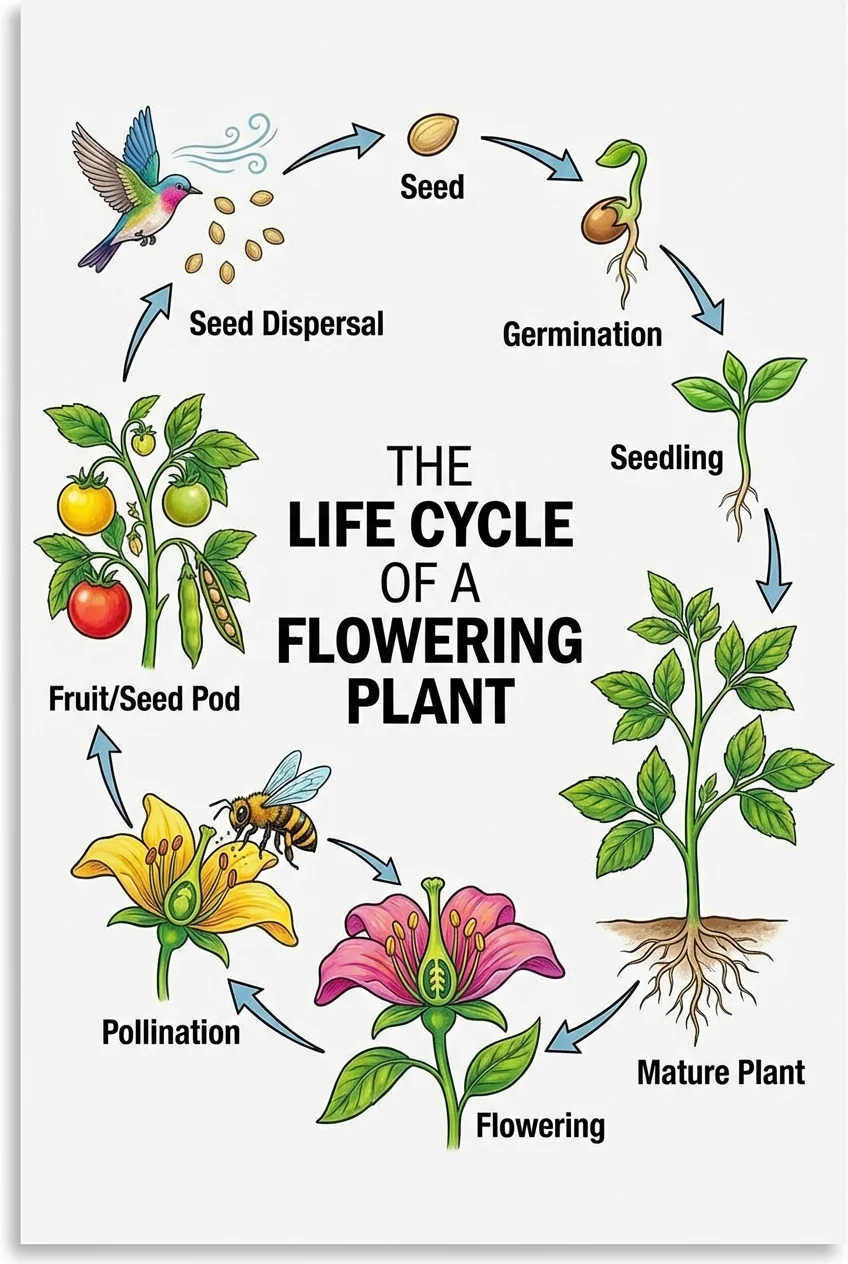
Générateur de Diagramme de Cycle de Vie
Générez des diagrammes de cycle de vie pour les plantes, les animaux et d'autres organismes avec des étapes annotées.
 Recherche
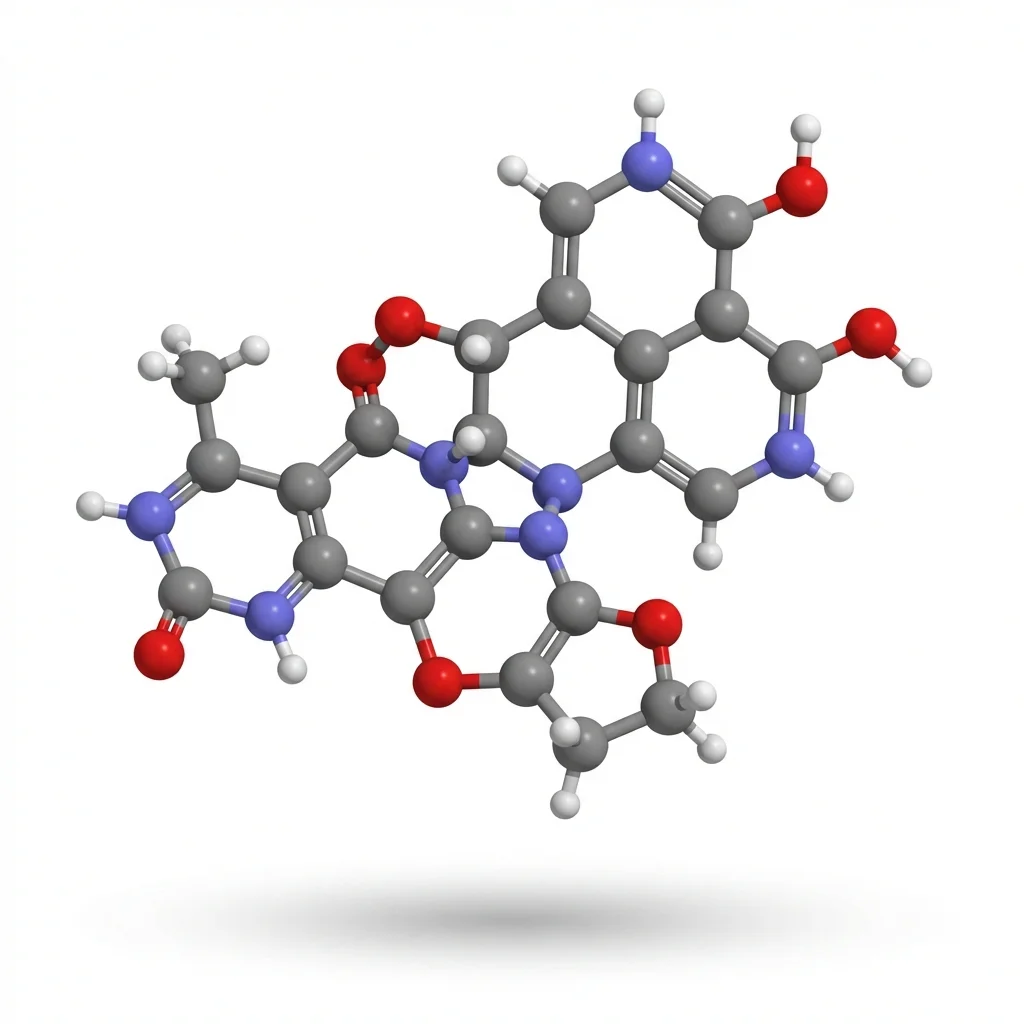
Générateur d'Images Scientifiques par IA
Créez des illustrations et diagrammes scientifiques professionnels pour les articles de recherche et les présentations.