Phase Diagram Generator for Water, CO₂ & More
Draw clear pressure–temperature (P–T) phase diagrams for water, CO₂, or any substance. Label the solid, liquid, and gas regions, the triple point, critical point, and 1 atm line, then export SVG or PNG — free. Also called a phase change diagram.
Solid–liquid boundary slopes left (negative).
Phase Diagram Examples
P–T phase diagrams rendered by the exact engine
Phase Diagram of Water
Water's solid–liquid line slopes backwards (negative) — the anomaly AI image tools usually get wrong.
Phase Diagram of CO₂
CO₂ sublimes at 1 atm (dry ice) because its triple point is above atmospheric pressure.
Generic Phase Diagram
A general P–T diagram with adjustable triple and critical points for any substance.
Water — Supercritical Region
Beyond the critical point, liquid and gas merge into a supercritical fluid.
Supercritical CO₂
Supercritical CO₂ is used in decaffeination and extraction — easy to show here.
Fully Labeled Phase Diagram
Everything labeled at once — regions, triple and critical points, 1 atm line, and supercritical fluid.
What is a phase diagram?
A phase diagram is a graph that shows which physical state (solid, liquid, or gas) a substance is in at a given temperature and pressure. Temperature is plotted on the x-axis and pressure on the y-axis. Three boundary curves — sublimation (solid–gas), fusion (solid–liquid), and vaporization (liquid–gas) — divide the graph into regions and meet at the triple point, while the vaporization curve ends at the critical point. It is sometimes called a phase change diagram because it shows where phase changes occur.
How to read a phase diagram
- Find the region your temperature–pressure point lands in: that is the stable phase (solid, liquid, or gas).
- A point on a boundary curve means two phases coexist in equilibrium — that is where a phase change (melting, boiling, or subliming) happens.
- The triple point is the single temperature and pressure where all three phases coexist. The critical point is where the liquid–gas boundary ends; beyond it the substance is a supercritical fluid.
- Draw the 1 atm line across the diagram to read the normal melting and boiling points where it crosses the fusion and vaporization curves.
The phase diagram of water
Water is unusual: its solid–liquid (fusion) boundary slopes backwards with a negative slope, so increasing the pressure lowers the melting point. This is why ice can melt under pressure, and it is the detail AI image generators most often draw incorrectly. This tool draws water's negative-slope boundary correctly, with the triple point at 0.01 °C / 0.006 atm and the critical point at 374 °C / 218 atm.
The phase diagram of carbon dioxide (CO₂)
Carbon dioxide's triple point is at about 5.1 atm — above atmospheric pressure. That means at 1 atm CO₂ has no liquid phase: solid CO₂ (dry ice) sublimes straight to gas. The CO₂ preset shows this clearly, with the 1 atm line sitting below the triple point and crossing only the sublimation curve.
Phase diagram vs phase change diagram (heating curve)
The term "phase change diagram" is used two ways. Most often it means this P–T phase diagram. It can also mean a heating (or cooling) curve — a plot of temperature versus heat added, with flat plateaus at the melting and boiling points. The two are complementary: the phase diagram shows the stable phase at each pressure and temperature, while the heating curve shows how temperature changes as heat is added. For a heating curve, use the AI illustration mode.
When to use the AI illustration mode
Use the exact P–T mode for accurate, free pressure–temperature diagrams of water, CO₂, or a generic substance. Switch to AI illustration for diagrams the template does not cover: binary or eutectic alloy phase diagrams (temperature vs composition, such as the iron–carbon diagram), heating and cooling curves, or richly annotated figures for a slide or poster.
Questions Fréquentes
Related Chemistry Tools
 Chemistry
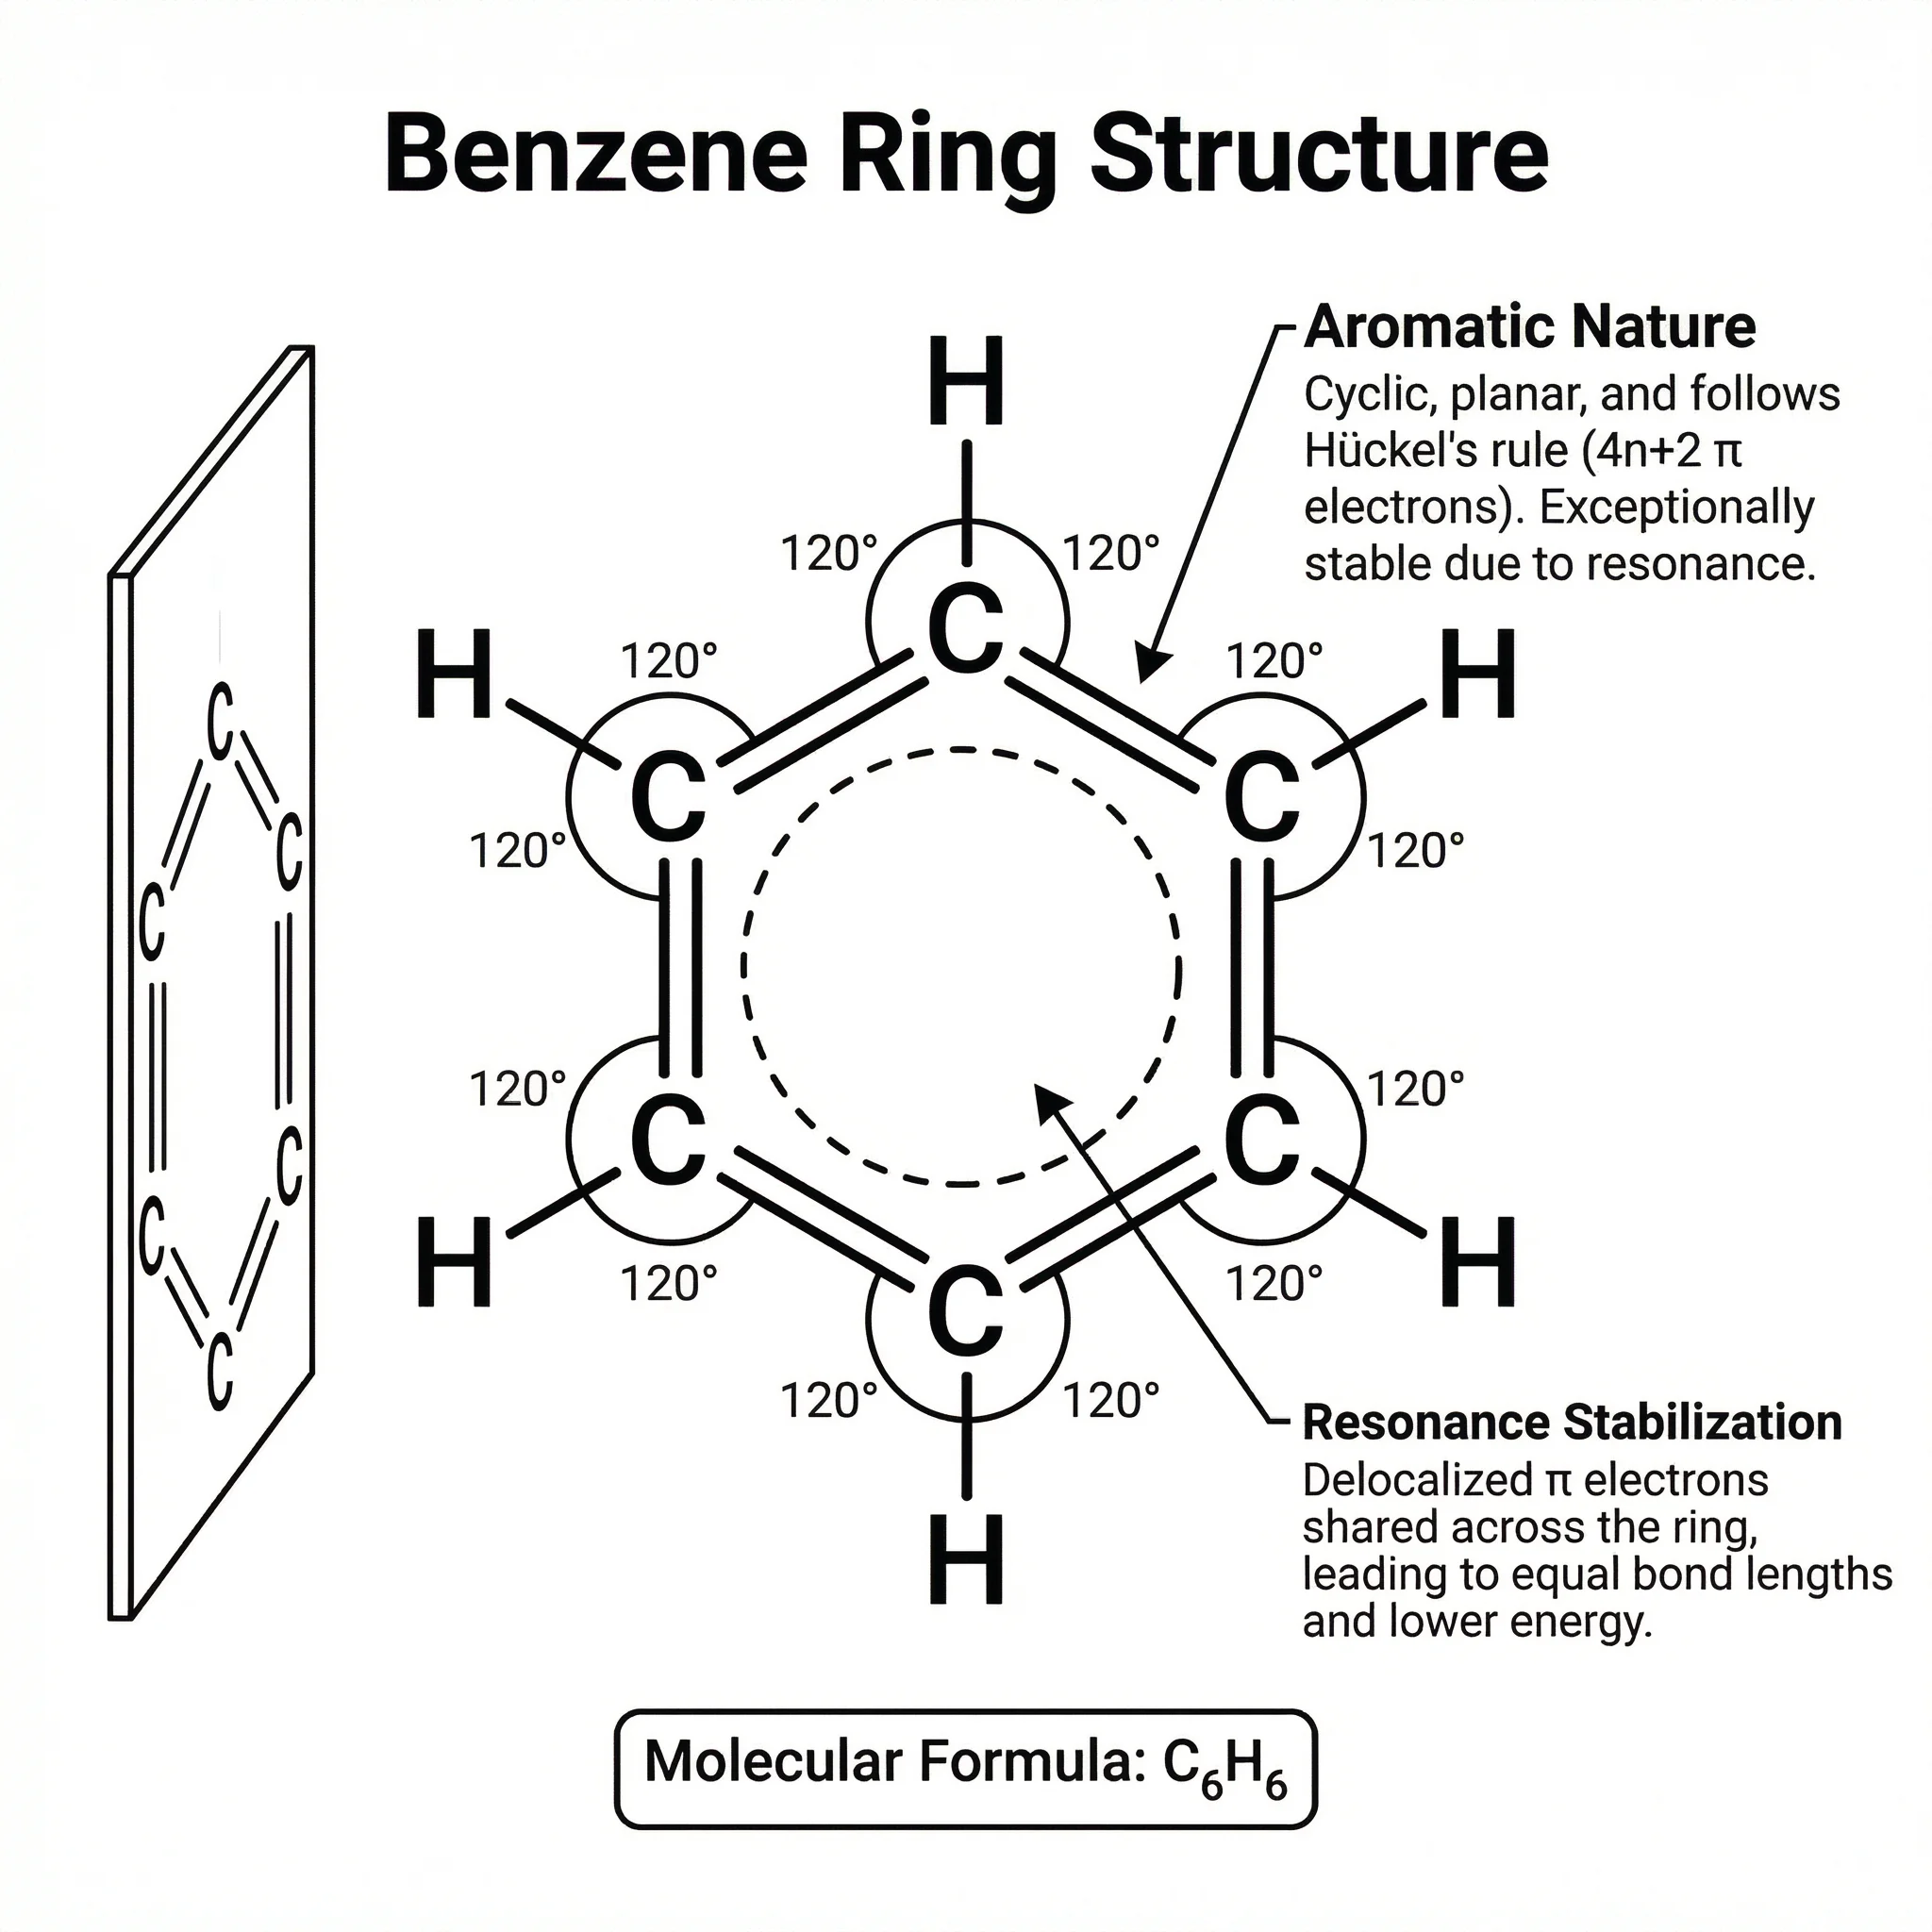
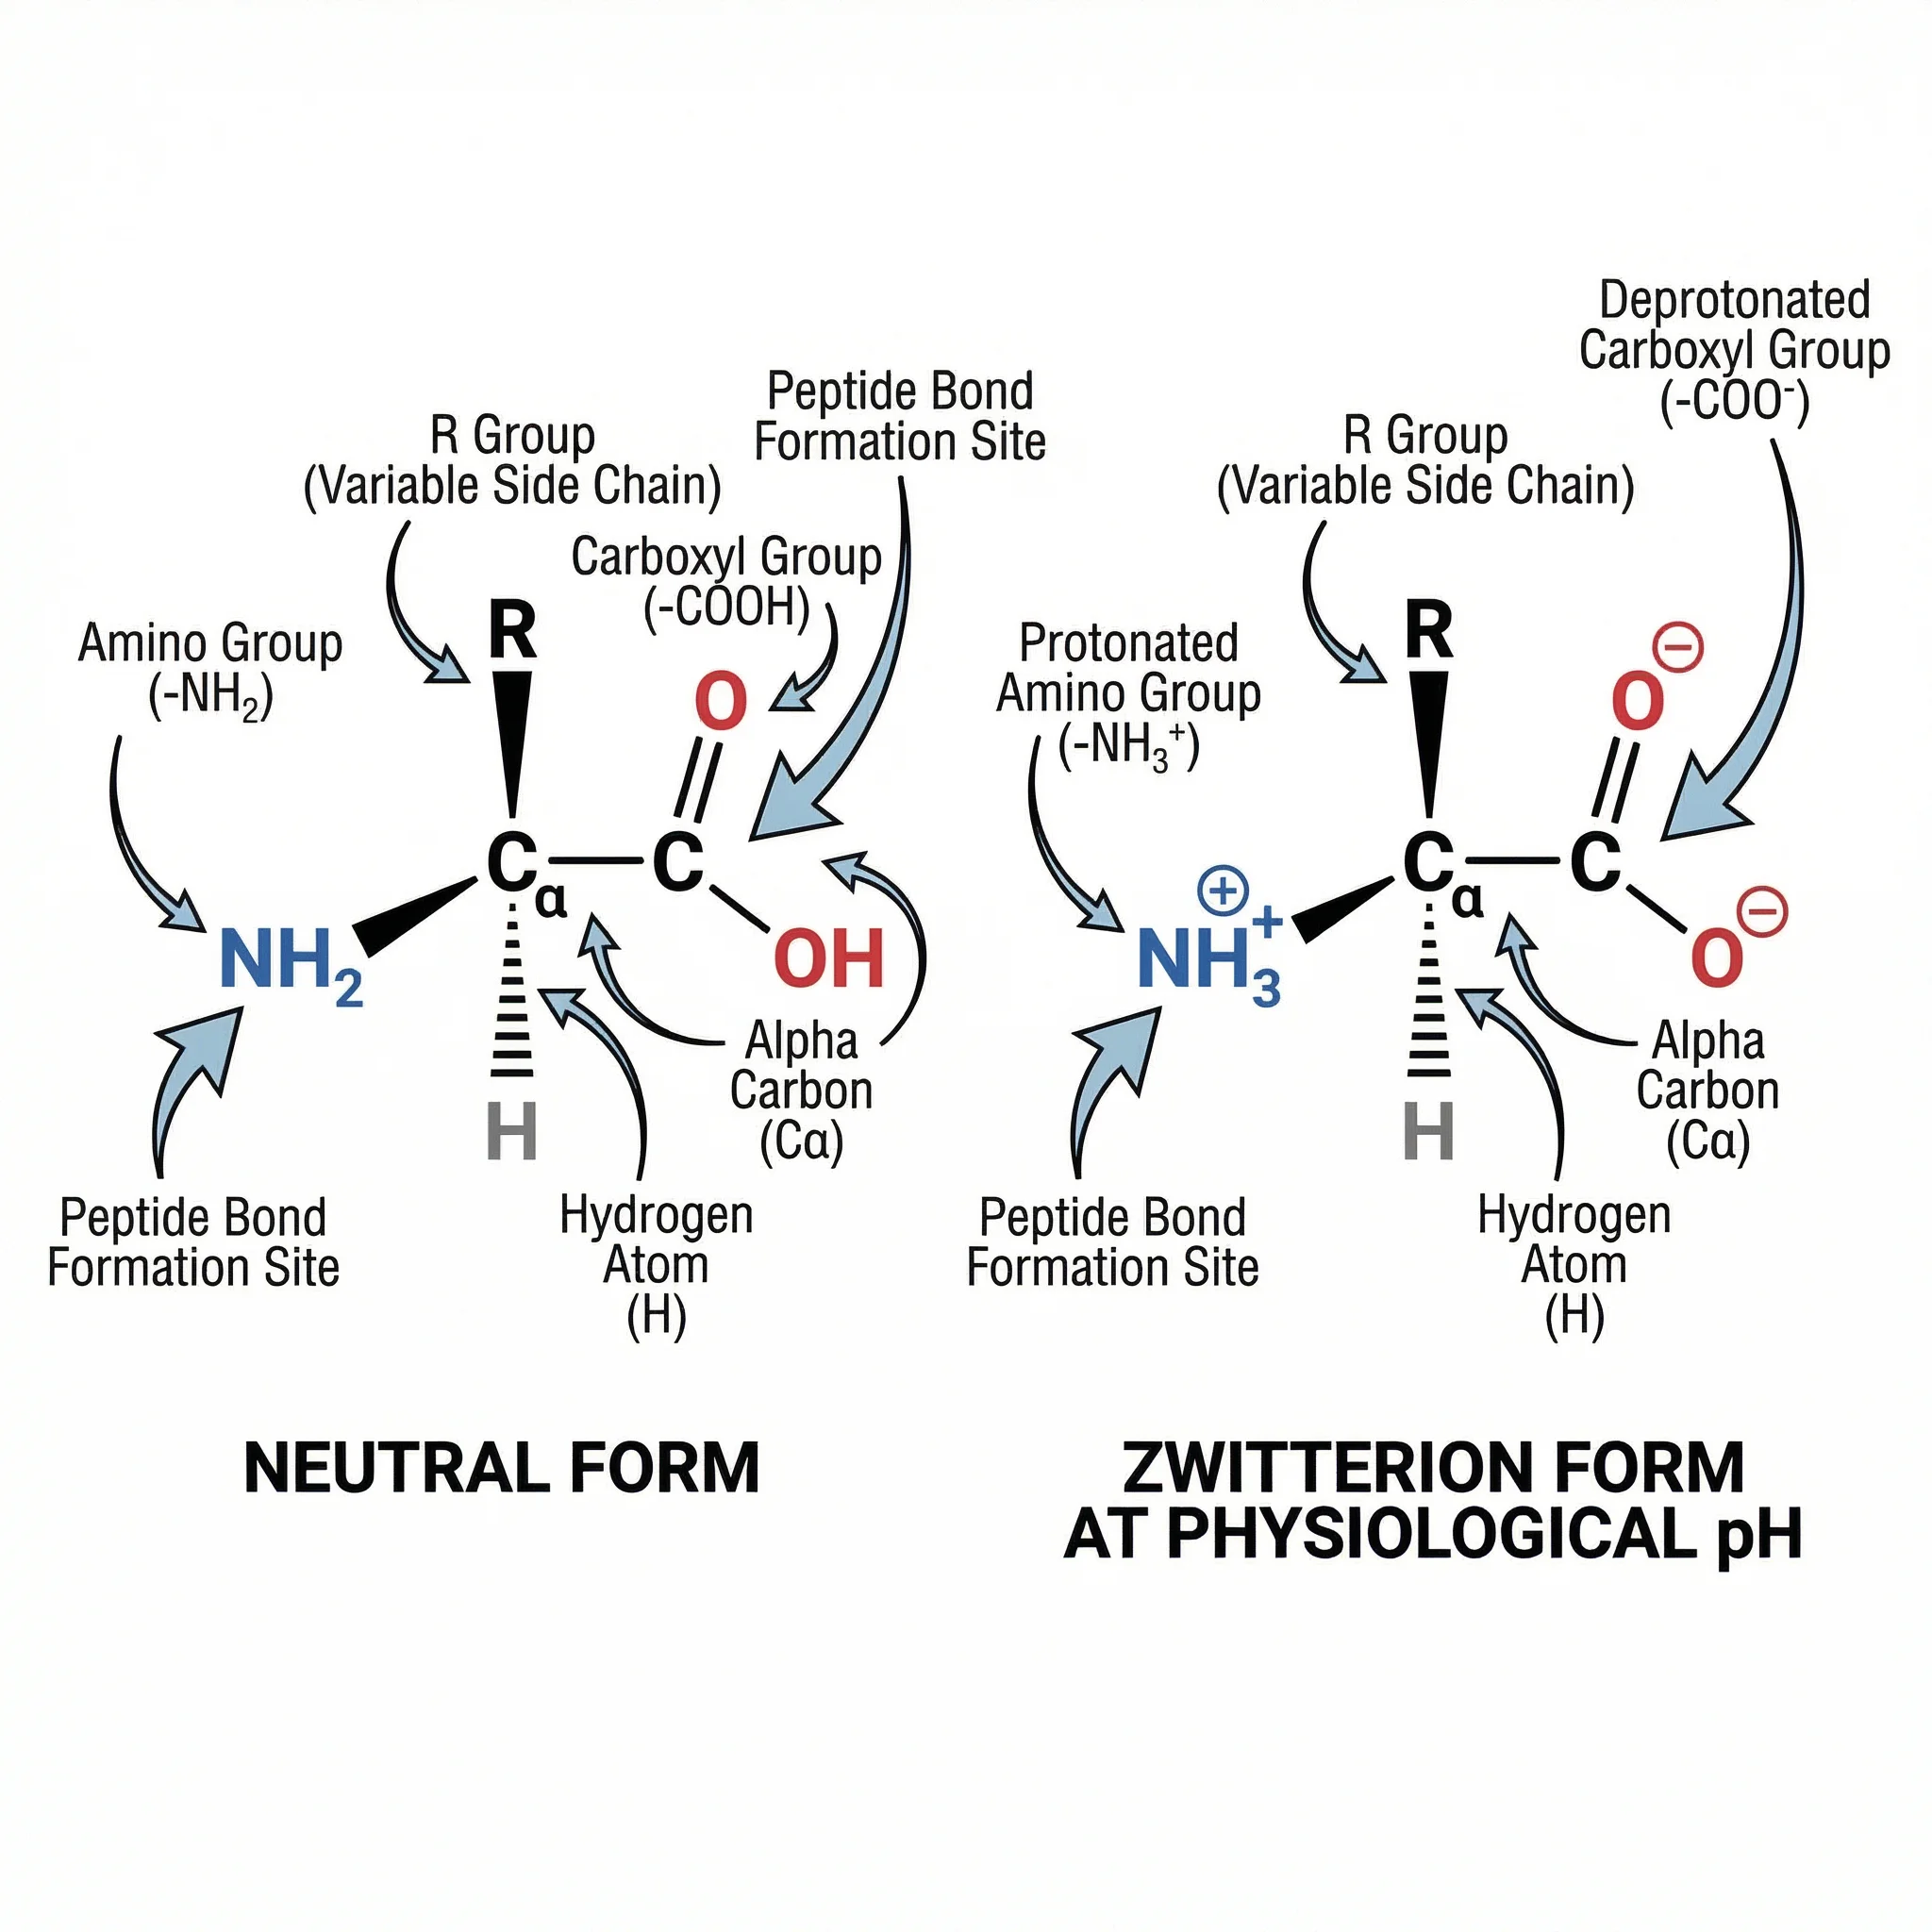
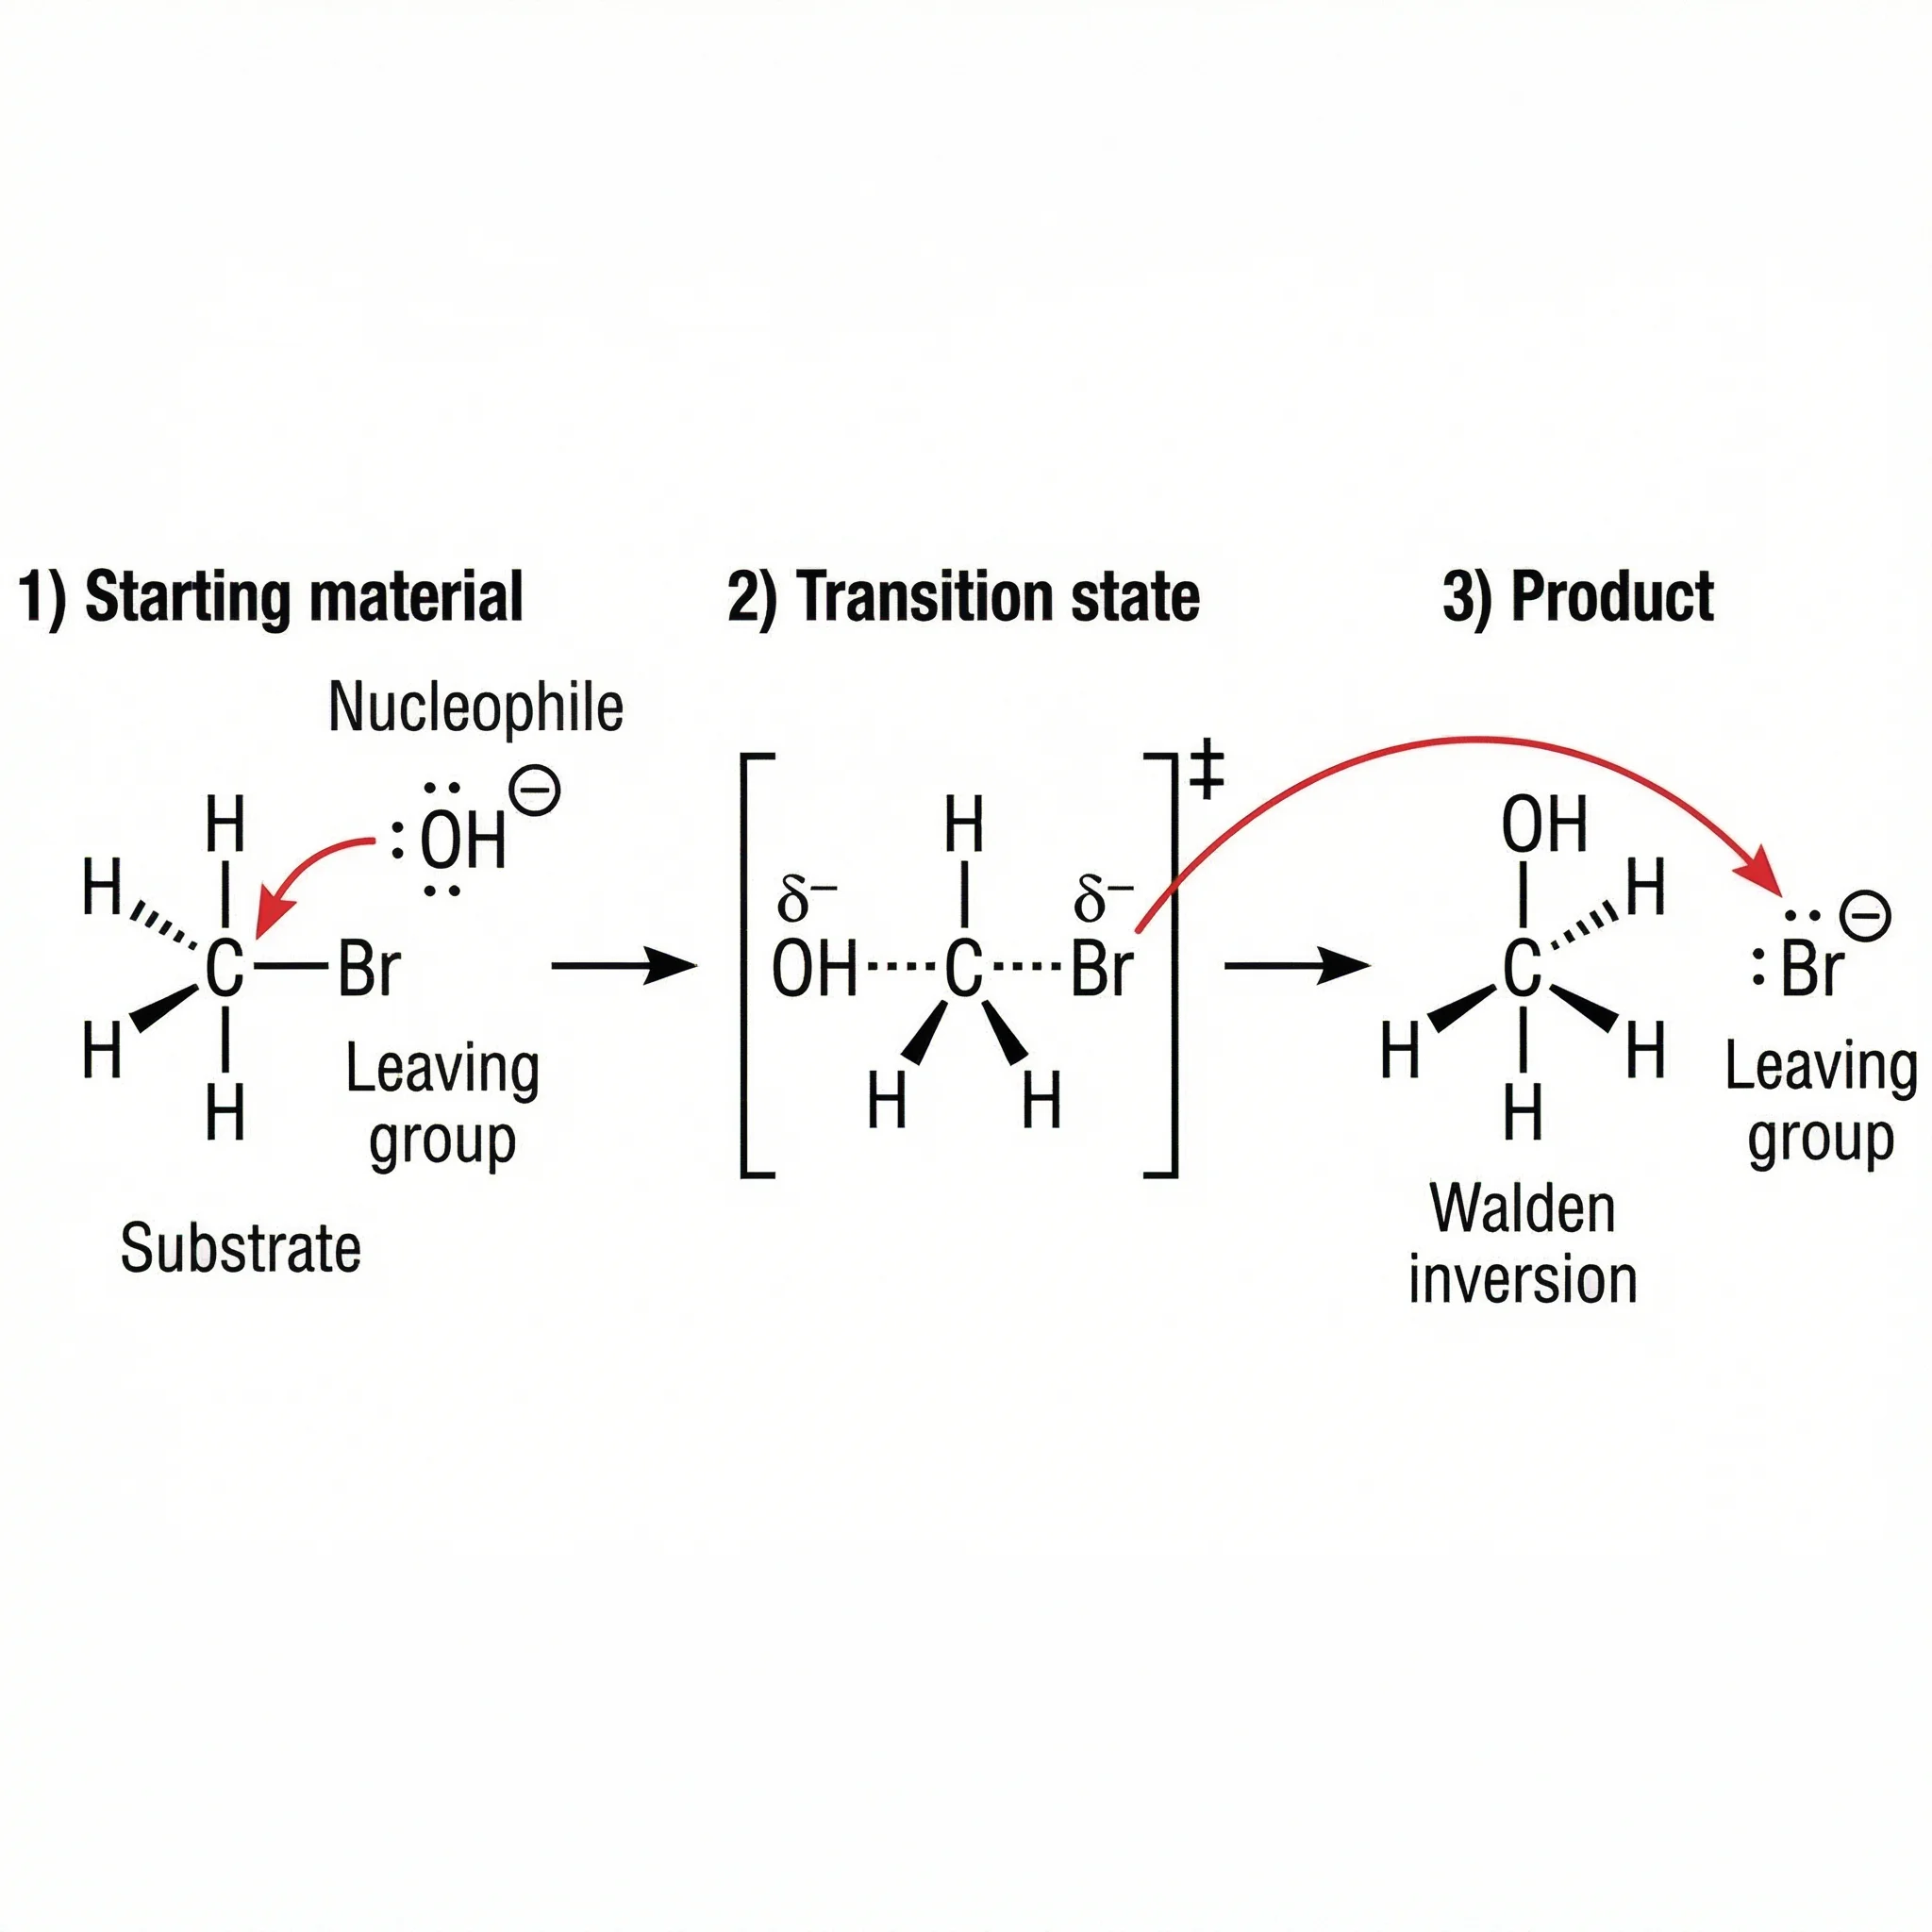
Chemistry Structure Generator
Draw molecules, mechanisms, and chemical structures with clean bonds and labels.
 Chemistry
Bohr Model Maker
Create Bohr model atomic diagrams showing electron shells for any element.
 Chemistry
Lewis Dot Structure Generator
Generate Lewis dot structures showing valence electrons and bonding for molecules.