
What Is a P&ID? Piping & Instrumentation Diagrams Explained
A P&ID shows every pipe, valve, and instrument in a process. Learn how to read piping and instrumentation diagrams, the standard ISA symbols, and how a P&ID differs from a PFD.
A P&ID — piping and instrumentation diagram — is the master schematic of a process plant. It shows every pipe, valve, vessel, pump, and instrument, and exactly how they connect, so engineers and operators can build, run, and troubleshoot the process from a single drawing.
This guide explains what a P&ID is, how to read its standard symbols, the instrument bubble notation, and how a P&ID differs from a process flow diagram (PFD).
Quick Answer: What Is a P&ID?
A piping and instrumentation diagram (P&ID) is a detailed schematic that shows the equipment, piping, valves, and instrumentation of a process and how they are interconnected. It is the working document used for design, construction, operation, and maintenance — far more detailed than a high-level process flow diagram.
P&ID symbols are standardized, most commonly by the ISA S5.1 standard, so the same drawing can be read by engineers anywhere.
P&ID Symbol Categories
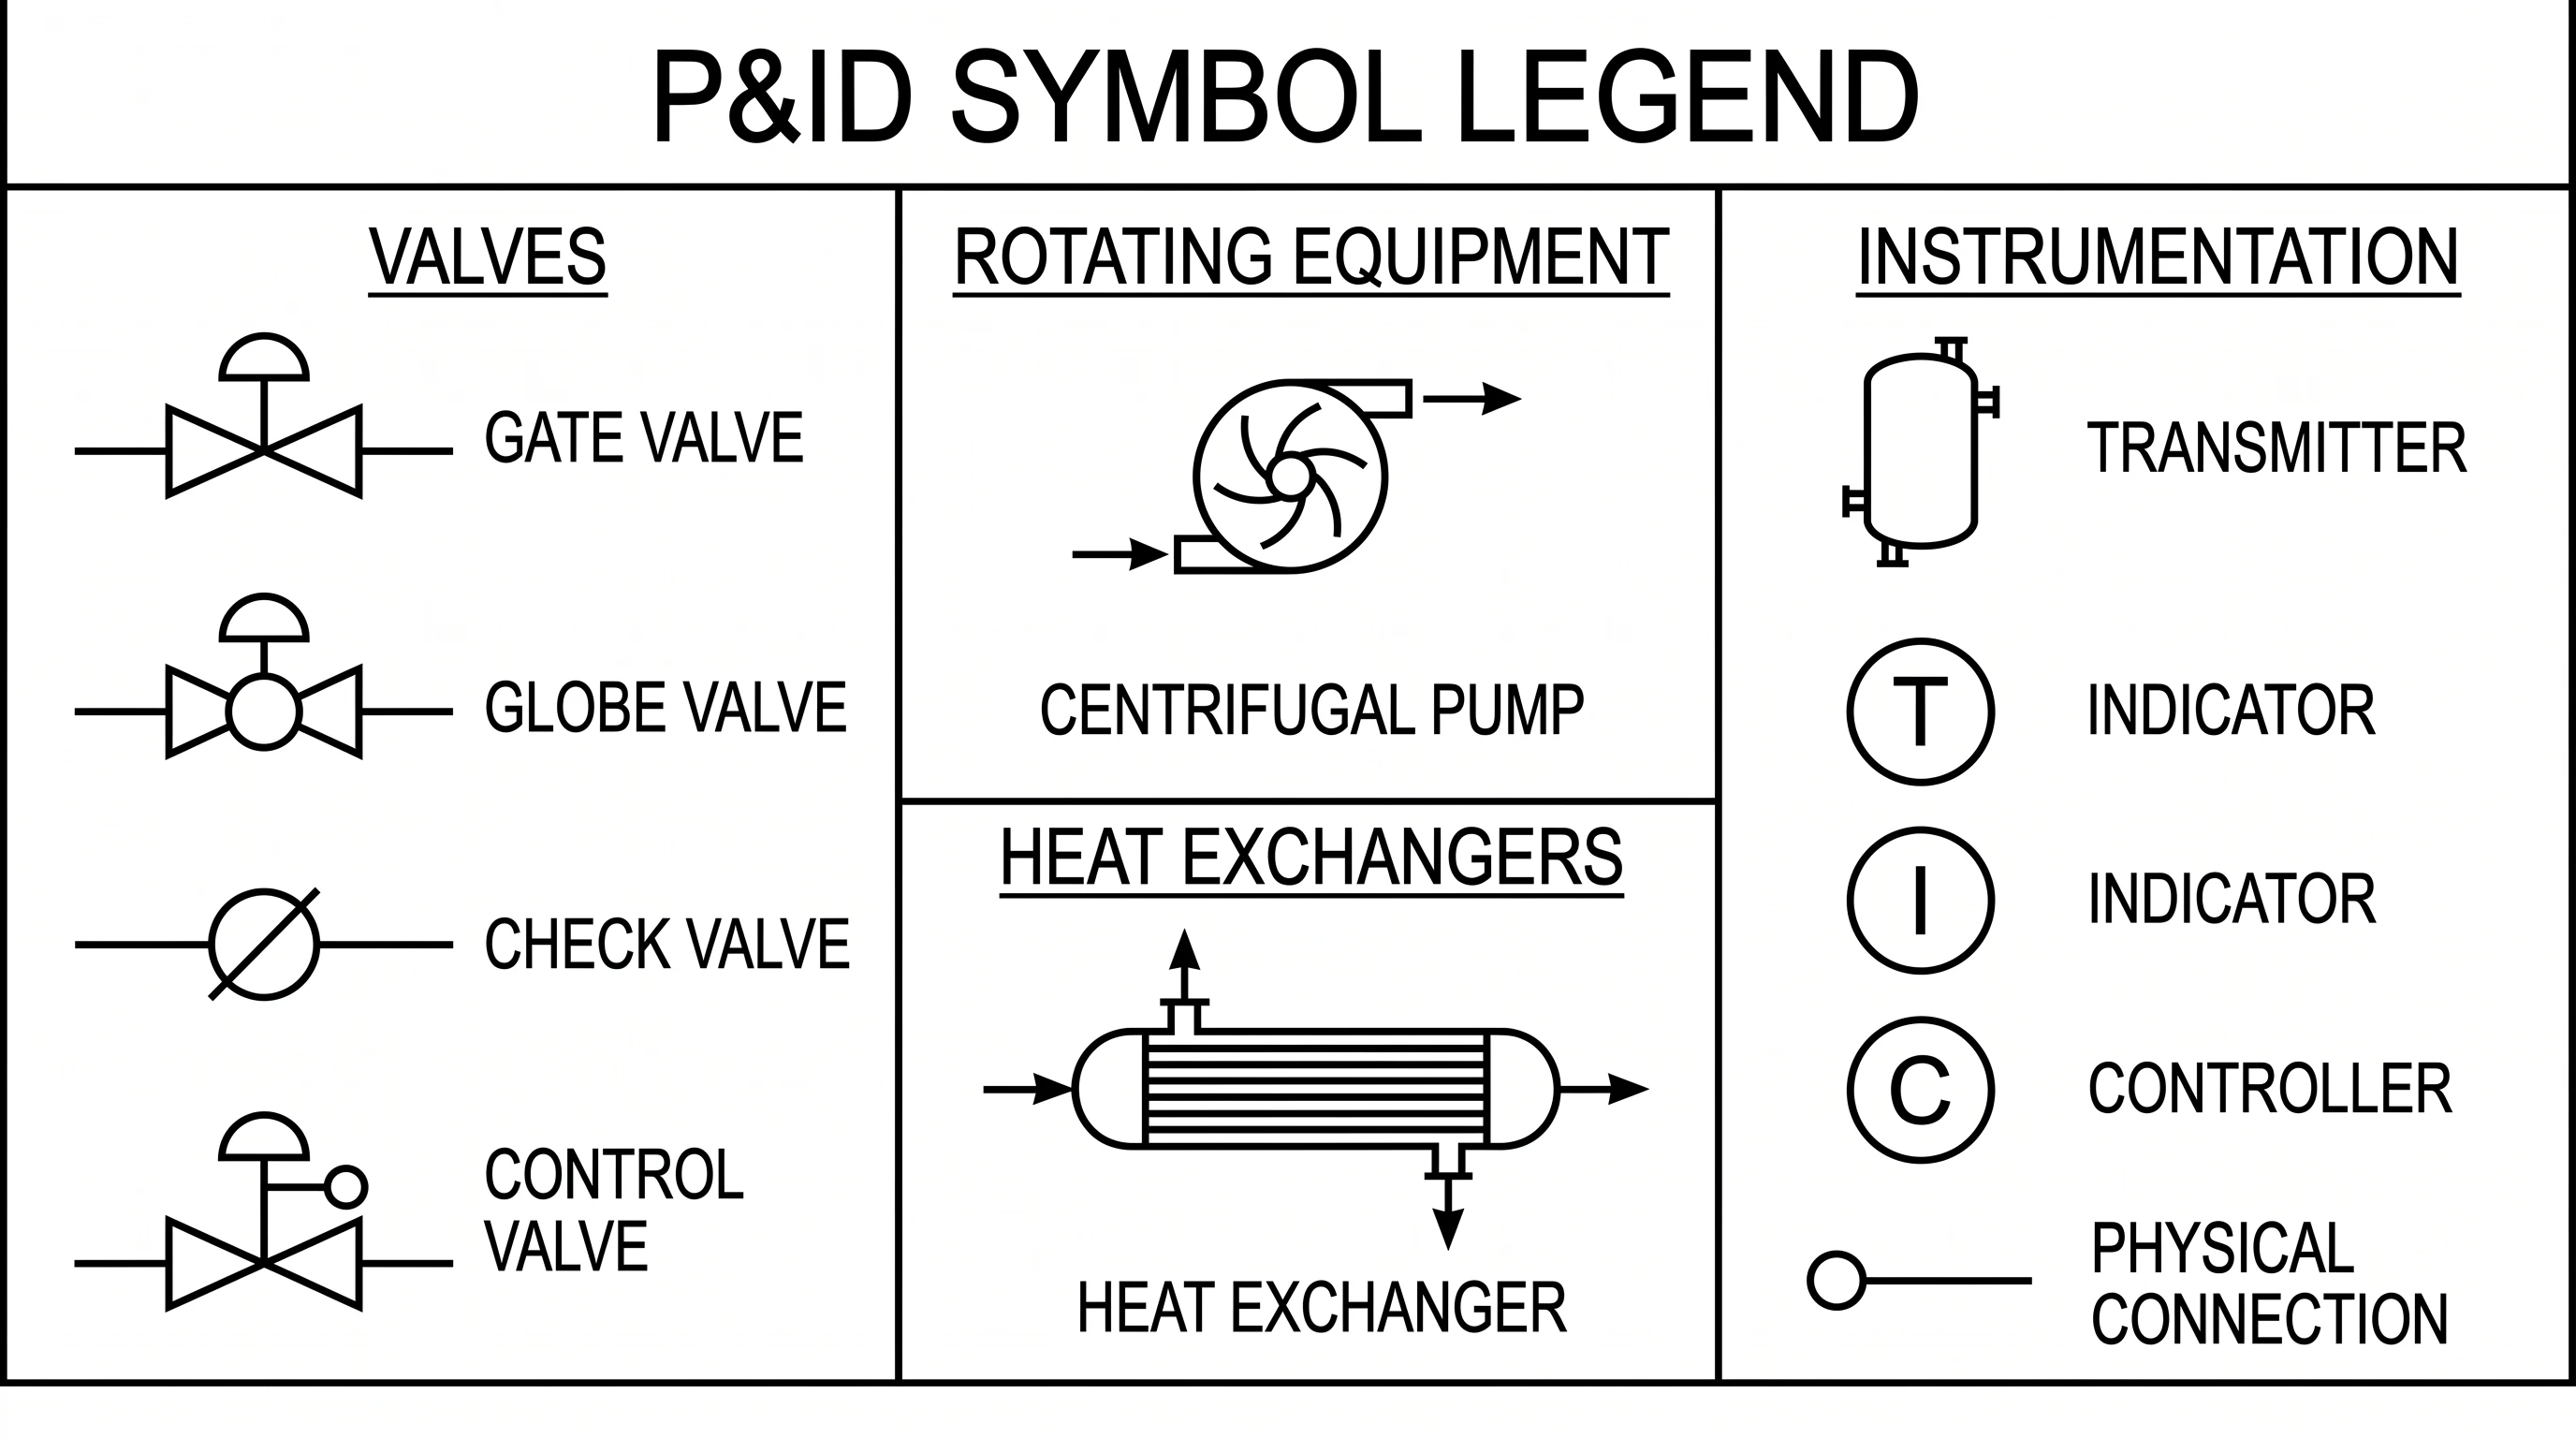
P&ID symbols fall into a few main groups:
- Piping — process lines, signal lines, connectors, reducers, and fittings.
- Valves — gate, globe, check, ball, and control valves, each with a distinct symbol.
- Equipment / vessels — tanks, columns, drums, and reactors.
- Rotating equipment — pumps, compressors, and turbines.
- Heat exchangers — shell-and-tube, condensers, and boilers.
- Instrumentation — measurement and control devices, drawn as circles ("bubbles").
P&ID Maker
Create piping and instrumentation diagrams with standard ISA symbols for valves, pumps, vessels, and instruments, then download them free as SVG or PNG.
Make a P&ID ->Reading Instrument Bubbles
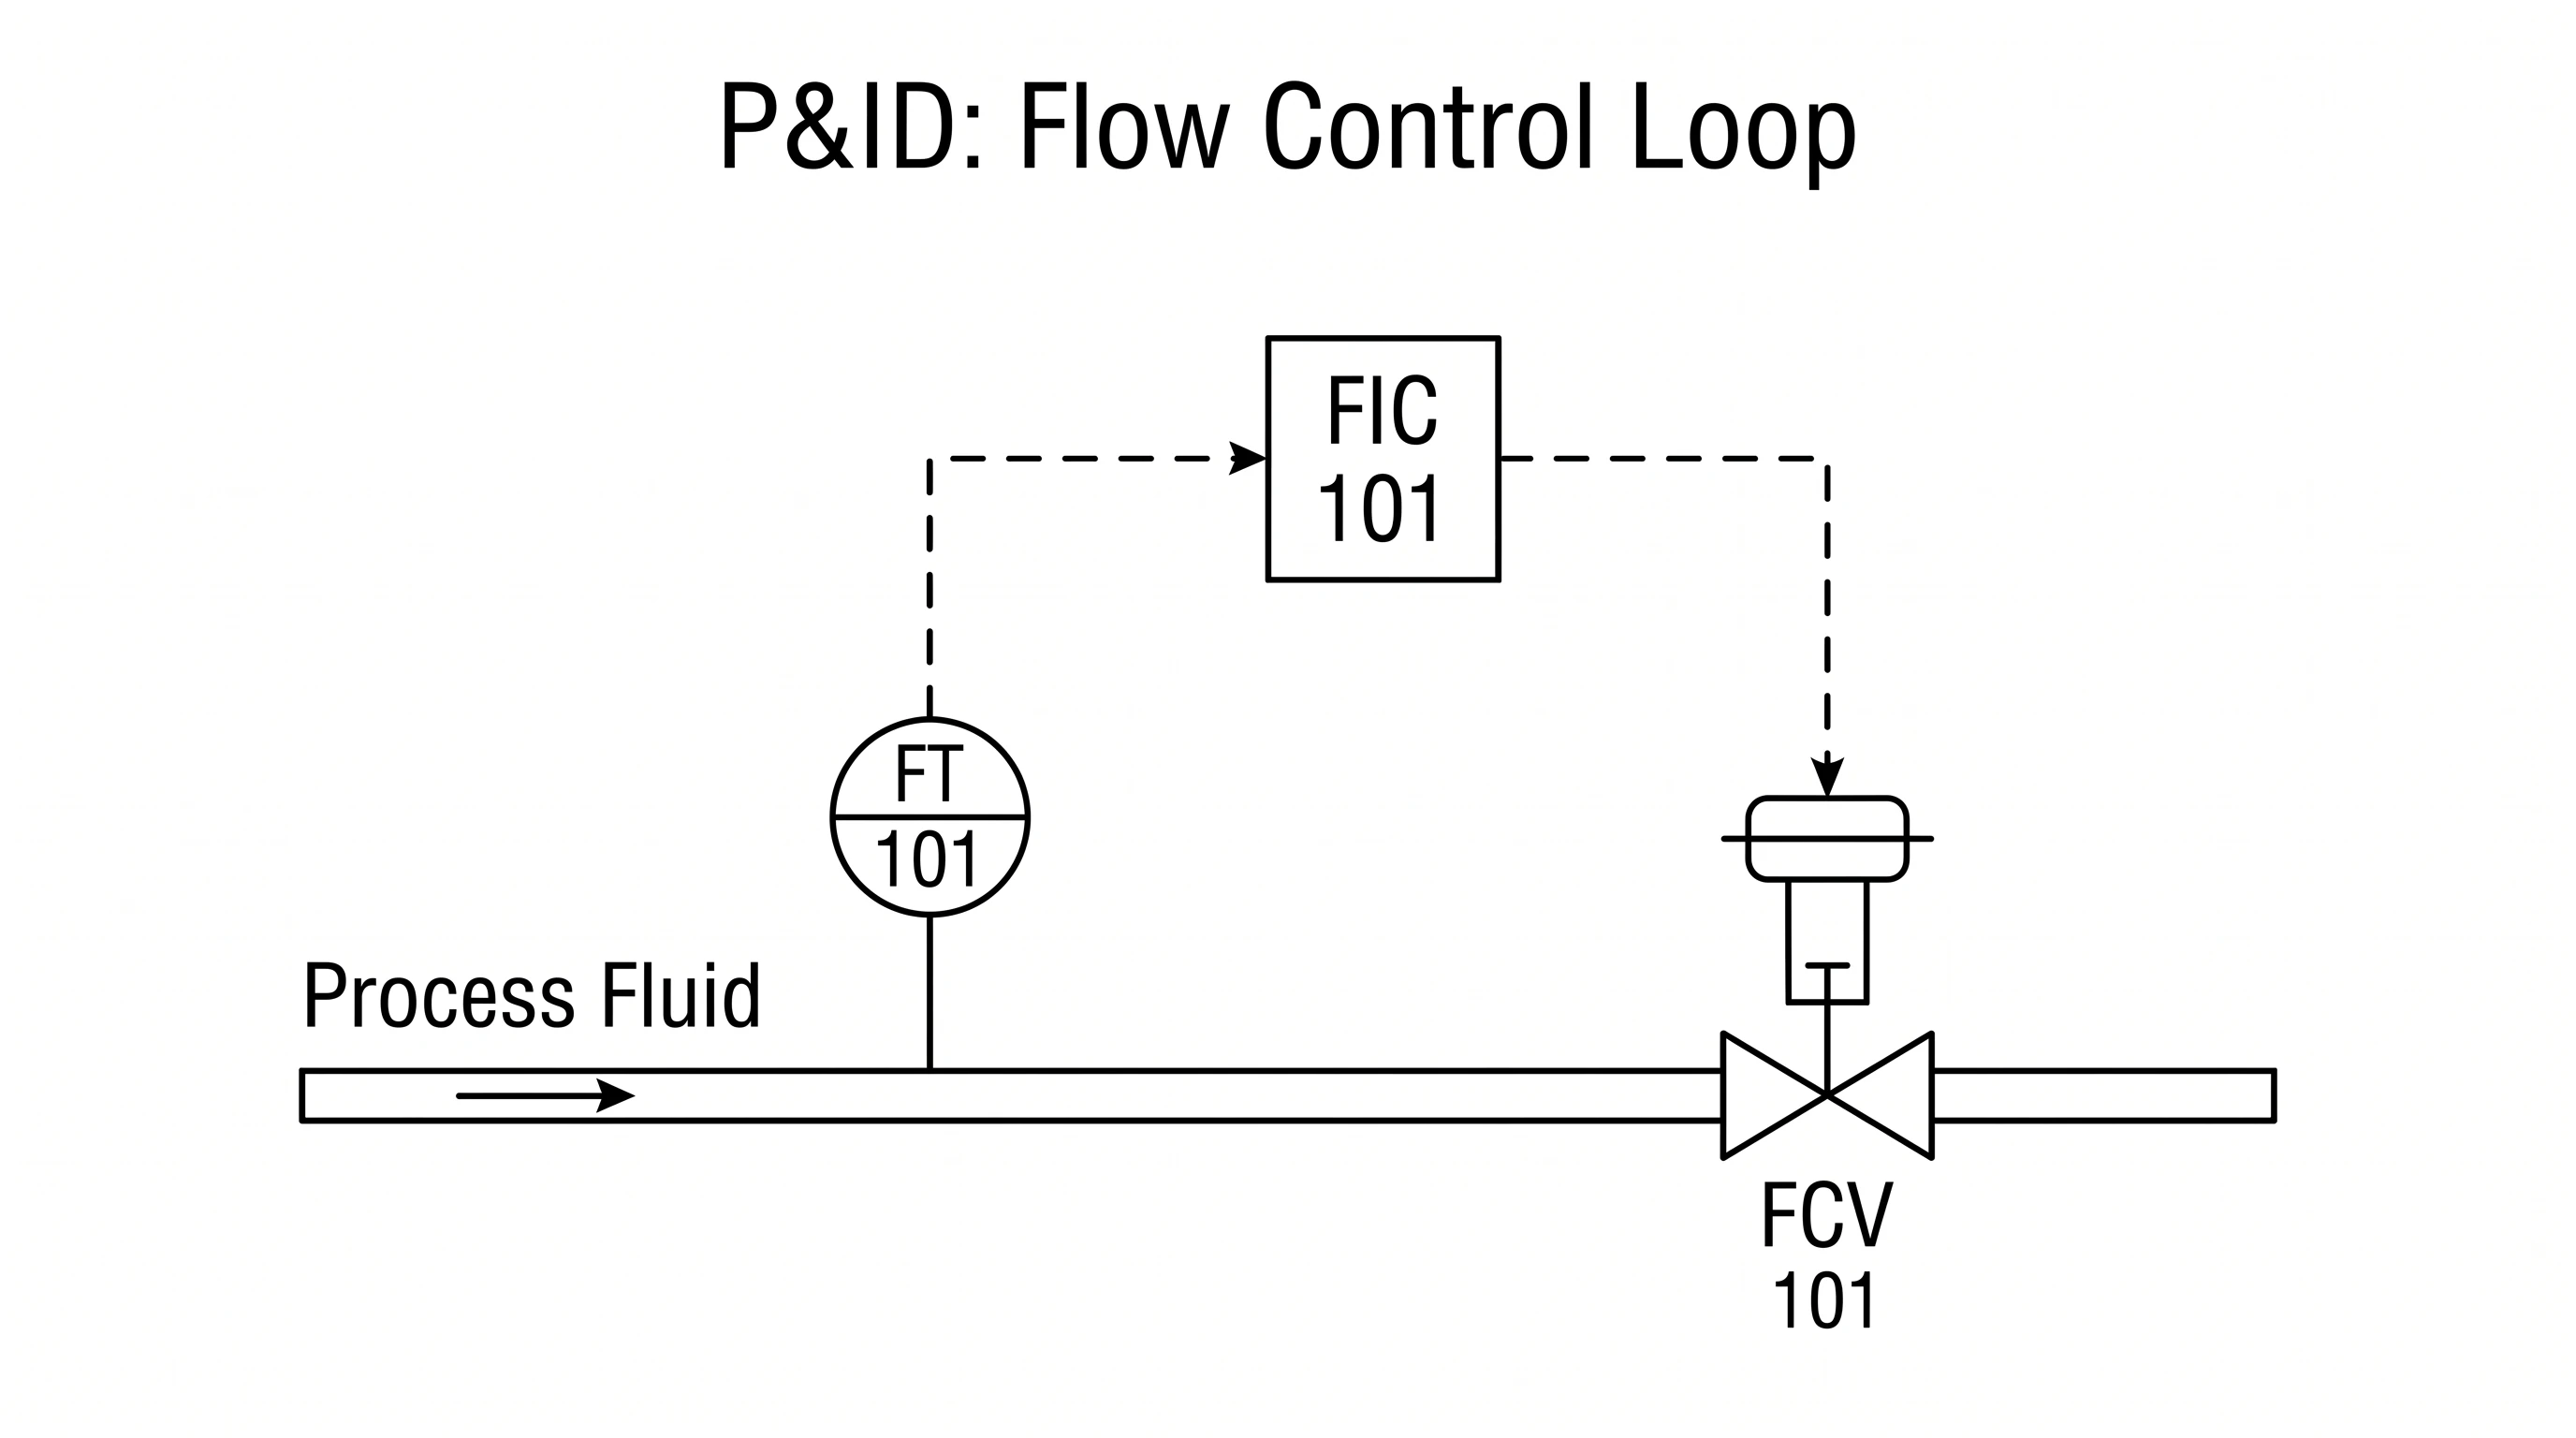
Instruments are drawn as circles, and two things tell you what each one does:
- The letters inside follow the ISA tag system. The first letter is the measured variable (F = flow, T = temperature, P = pressure, L = level), and the following letters are the function (I = indicator, T = transmitter, C = controller, R = recorder). So FIC is a flow indicating controller and PT is a pressure transmitter.
- The line through the bubble tells you where it lives: no line = a field instrument near the process; a solid line = mounted in the control room; a dashed line = a shared/DCS function. Dashed lines connecting instruments are signal lines, not pipes.
How to Read a P&ID
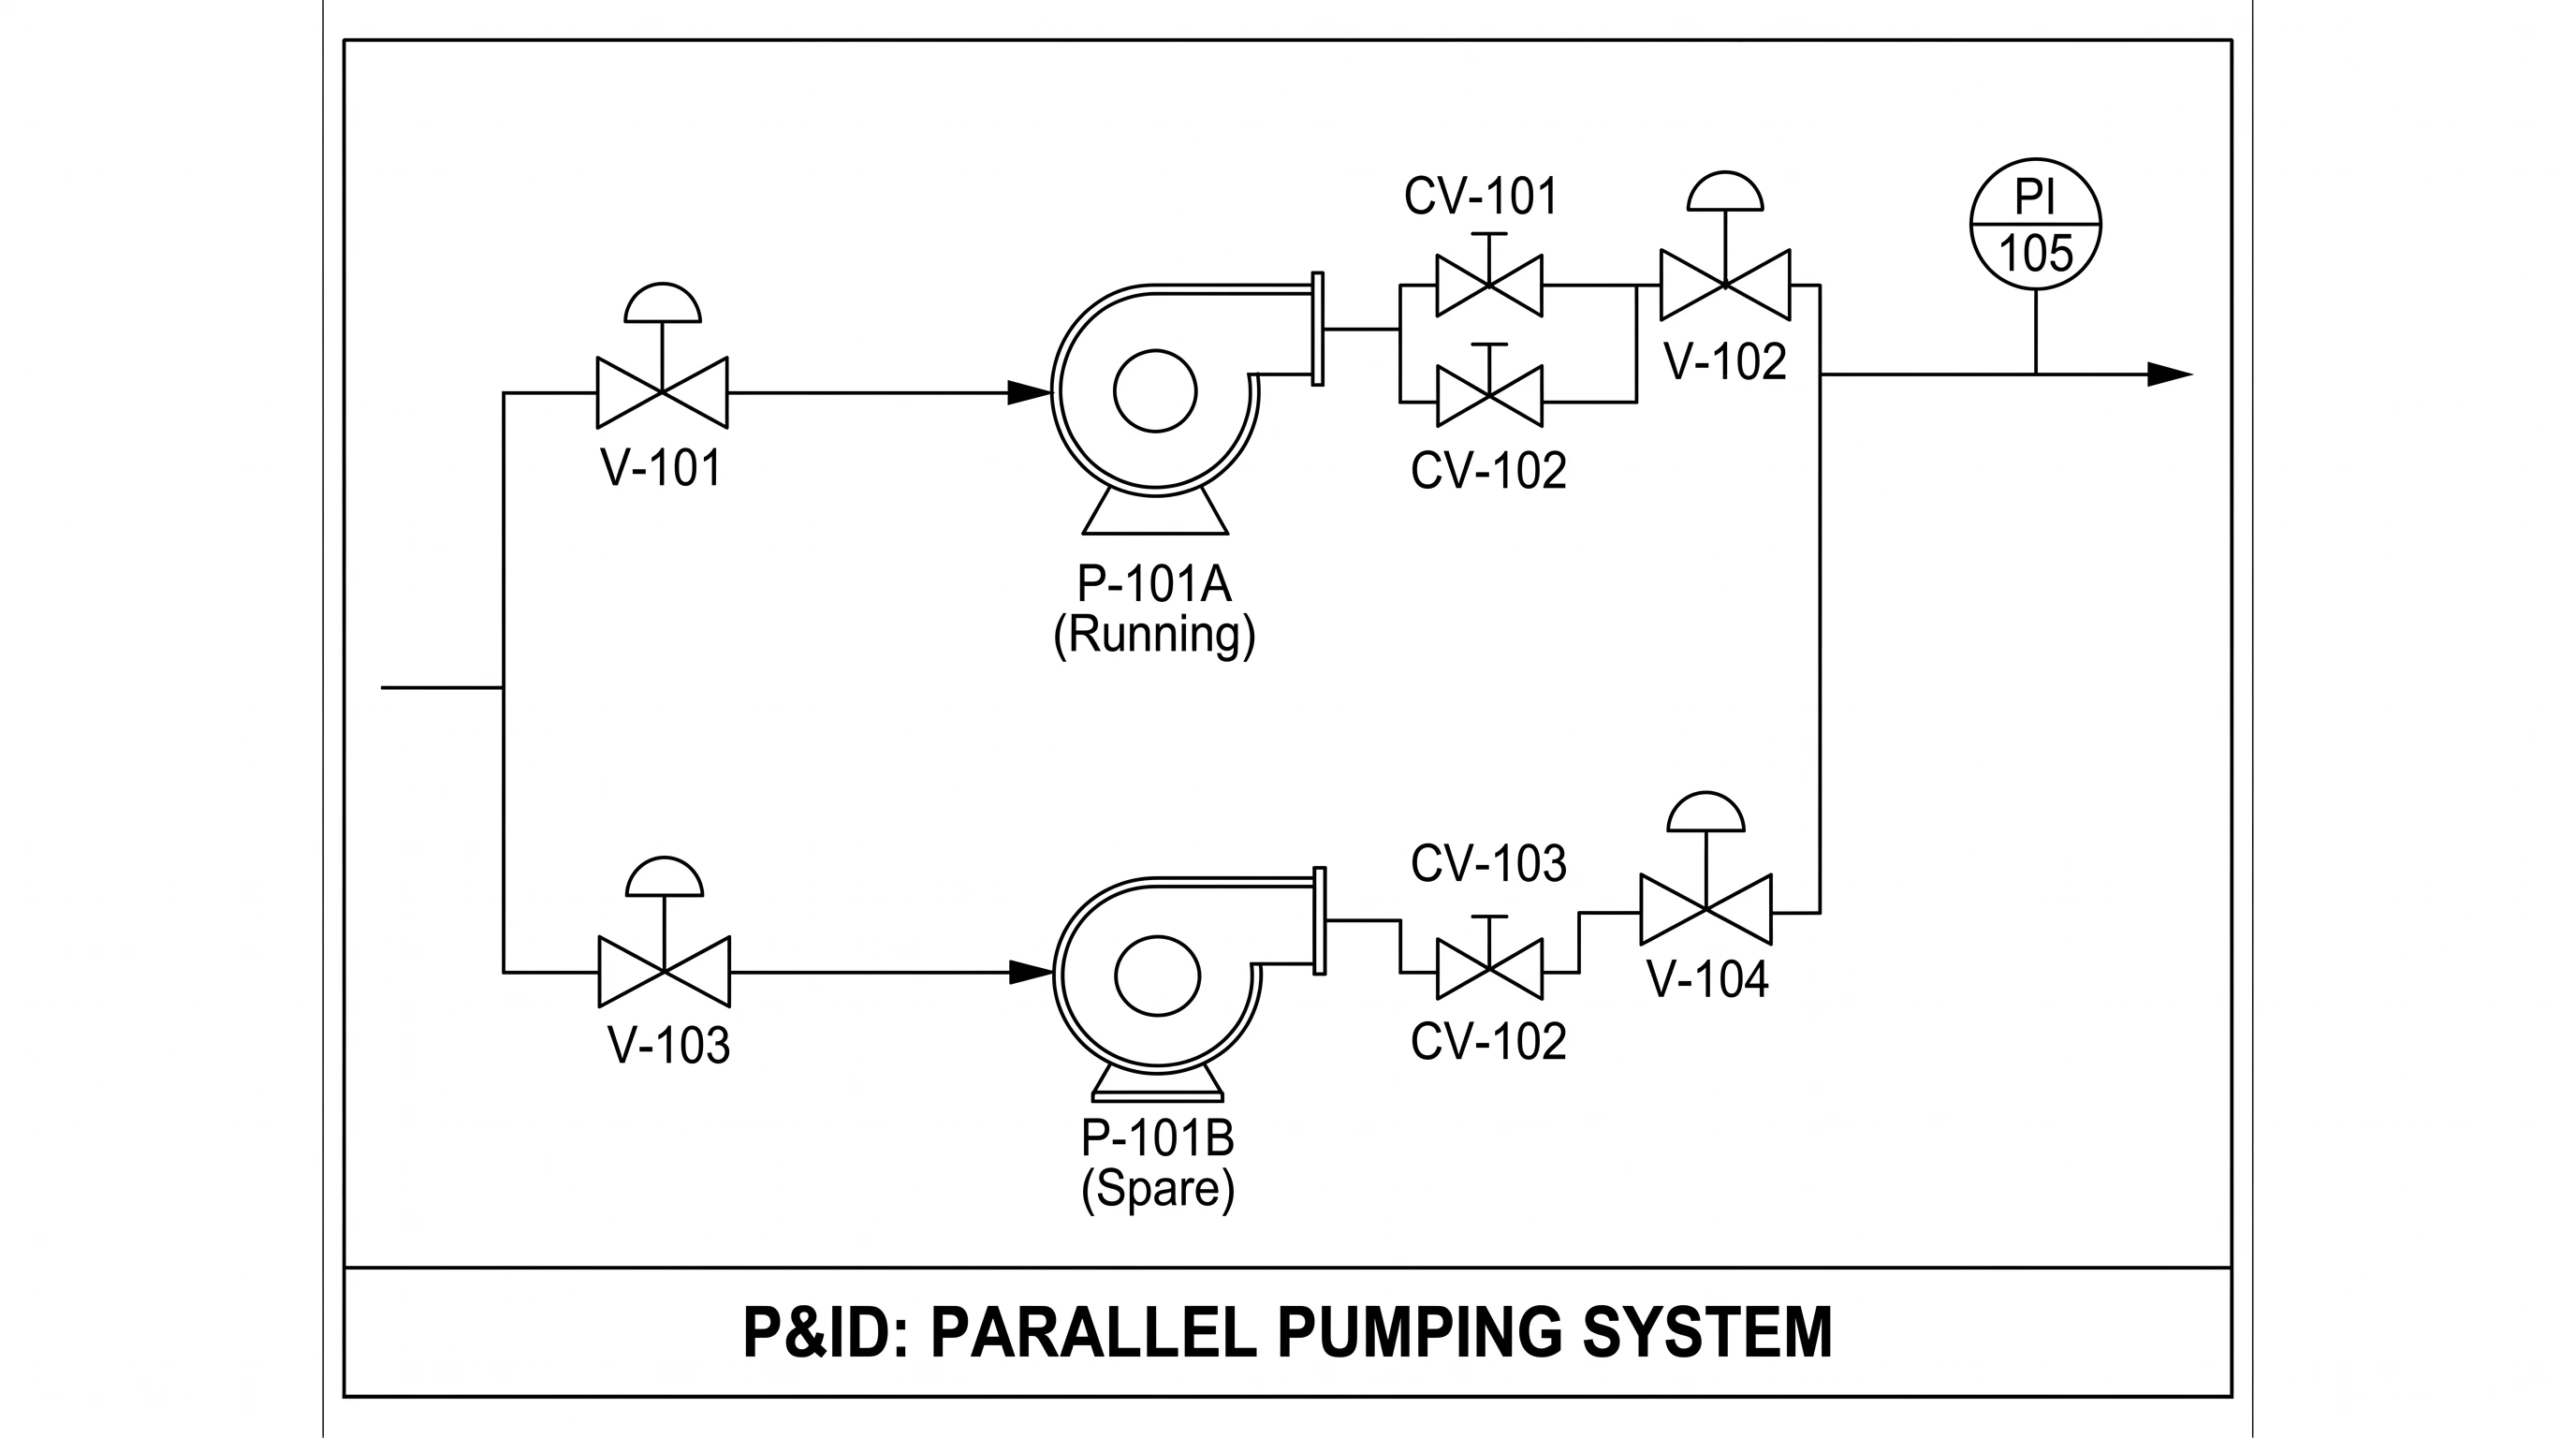
- Follow the process lines (the heavy lines) to trace the flow of material through the plant.
- Identify the equipment by its symbol and tag number (for example T-101 for a tank, P-101 for a pump).
- Note the valves along each line and what type they are.
- Read the instrument bubbles to see what is measured and controlled, and how the control loops work.
- Distinguish signal lines (dashed) from process pipes (solid).
P&ID vs PFD
A process flow diagram (PFD) is the big-picture overview: it shows the major equipment and the main flow of material, often with operating conditions, but leaves out most valves and instruments. A P&ID zooms in and adds every valve, line, and instrument needed to actually build and control the plant. In short: the PFD shows what the process does; the P&ID shows how it is built and controlled.
Common Mistakes
- Confusing process lines and signal lines. Solid heavy lines are pipes; dashed (or specially marked) lines are instrument signals.
- Misreading instrument tags. The first letter is the variable, the rest are the function — FIC ≠ FI.
- Ignoring the bubble line convention. No line, solid line, and dashed line mean different instrument locations.
- Treating a P&ID like a PFD. A P&ID is detailed and to-symbol, not a simplified overview.
FAQ
What is a P&ID?
A P&ID (piping and instrumentation diagram) is a detailed schematic showing all the equipment, piping, valves, and instrumentation in a process and how they are connected. It is used for design, construction, operation, and maintenance.
What do the symbols on a P&ID mean?
They are standardized graphics (commonly ISA S5.1) for piping, valves, vessels, pumps, heat exchangers, and instruments. Each symbol represents a specific component so the diagram can be read consistently.
What do the letters in an instrument bubble mean?
They follow the ISA tag system: the first letter is the measured variable (F, T, P, L) and the following letters are the function (I = indicator, T = transmitter, C = controller). For example, FIC is a flow indicating controller.
What is the difference between a P&ID and a PFD?
A PFD (process flow diagram) is a simplified overview of the major equipment and flow. A P&ID is far more detailed, showing every valve, line, and instrument needed to build and control the process.
What standard is used for P&ID symbols?
The most widely used is ISA S5.1 (Instrumentation Symbols and Identification) from the International Society of Automation, which defines instrument symbols and tag identification.
Further Reading
Catégories
Plus d'articles

What Is a Particulate Diagram? Particle Models Explained
A particulate diagram shows matter as individual particles. Learn how particle diagrams represent solids, liquids, gases, elements, compounds, and mixtures, with examples.

Definition of Terms in Research: Thesis Examples, Format & Chapter 1 Guide
What definition of terms means in research and thesis Chapter 1, with examples, format rules, alphabetical order guidance, and common mistakes.

Best AI Scientific Illustration Tools in 2026: Complete Guide
Compare the best AI-powered scientific illustration tools for researchers in 2026. From BioRender to ConceptViz, find the right tool for publication-quality scientific figures.